

Abstract
High sensitivity and high resolution LC/MS instrumentation has been applied in PET radiopharmaceutical development to provide quantitative measurement of the mass of radiotracers extracted from tissues of rats. We employed the highly sensitive Waters Q-TOF premier MS coupled with an Acquity UPLC system to demonstrate that LC-MS can generate ex vivo biodistribution data for PET 5-HT1A ligand FPWAY without the need to radiolabel. For the biodistribution studies, we injected rats with [18F]FPWAY containing various amounts of non-radioactive FPWAY. At the end of the allotted time, the animals were killed and six regions of brain and plasma from each animal were processed for quantitative measurement of parent compound concentration by LC-MS. This data was then converted to the differential uptake ratio DUR( %ID/g) and the brain tissue specific binding ratio to allow direct comparison with data obtained by gamma counting of the co-injected radioactive [18F]FPWAY. The differential uptake ratio (DUR) and the brain tissue specific binding ratio calculated using the LC-MS method was highly correlated to the values obtained by standard radioactivity measurements of [18F]FPWAY.
In conclusion, there was significant concordance between the LC/MS and radioactivity method in determination of Differential Uptake Ratio and the specific binding ratio in the rat brain. This concordance indicated that high sensitivity LC/MS is an indispensable tool in evaluating the quantity of administered chemical in tissue as part of the development of new molecular imaging probes.
Keywords: PET radiotracer, biodistribution, LC/MS, FPWAY, 5-HT1A, Metabolites
1 Introduction
Positron Emission Tomography (PET) is a highly sensitive imaging technique that has many potential applications for improving diagnosis and monitoring therapy for individual patients [1]. The technique depends upon the availability of selective, validated radiolabeled compounds [2,3]. Chemists and radiochemists continue to search and evaluate compounds for enhanced selectivity, optimal affinity, appropriate pharmacokinetics and metabolic fate. Novel compounds are chemically synthesized and tested for affinity and selectivity for the desired target using typical binding assay procedures. The best compounds are then radiolabeled for evaluation of affinity and selectivity in tissues, cells, or living animals [4, 5]. Pharmacokinetics can be evaluated in the living animal model using several time points or with small animal PET imaging [6, 7]. As we have previously shown, metabolic fate can be predicted using hepatocytes to generate metabolites followed by HPLC-MS analysis to elucidate metabolite structures [8, 9]. Other groups have utilized liver microsomes to generate metabolites for in vitro studies [10]. The knowledge of typical metabolic transformations may allow reasonable predictions of metabolic products and their propensity to be cleared from the body or contribution to background radioactivity [8, 11].
Advances in HPLC-MS instrumentation and procedures have greatly increased the sensitivity of the technique. Ultra performance liquid chromatography (UPLC), which utilizes 1.7 micron particles, allows high resolution chromatographic separation of components while providing extremely narrow chromatographic bands and thus relatively higher concentration of mass components. Advances in mass spectrometry instrumentation have also led to increased signal to noise ratio. This type of high sensitivity and high resolution instrumentation should be capable of detecting the mass peak of high specific activity PET radiopharmaceuticals at tracer doses in small animal tissues. LC/MS has recently been reported in the study of dopamine D2 receptor occupancy in preclinical investigations [12, 13].
Radioligands that are specific for the serotonin 5-HT1A receptor will be useful in characterizing the physiological role of this receptor subtype in diseases such as anxiety, dementia, and depression [7]. With radioligands of varying pharmacokinetic properties, investigators can measure not only receptor density, but also the effect of endogenous serotonin concentration. [11C]WAY [14,15] and [18F]FCWAY [16,17] were developed and showed high affinity to the receptor. We conducted a search for a somewhat lower affinity ligand that we would expect to be sensitive to endogenous serotonin. This led to the development of 5-HT1A ligand [18F]FPWAY {4-Fluoro-N-{2- [4-(2-methoxyphenyl)-1-piperazinyl]ethyl}-N-(2-pyrimidinyl)benzamide} [9,16,18]. In this manuscript we employ the highly sensitive Waters Q-TOF premier MS coupled with an Acquity UPLC system to demonstrate that LC- MS can generate ex vivo biodistribution data for FPWAY without the need to radiolabel. We compared the differential uptake ratio (DUR) and the brain tissue specific binding ratio of the non radiolabeled 5-HT1A ligand [19F]FPWAY obtained by the HPLC-MS method to the value obtained by standard radioactivity measurements of [18F]FPWAY.
2. Experimental
2.1. Chemicals, reagents, and solutions
Acetonitrile (HPLC grade) was purchased from Fisher Scientific, Pittsburgh, PA. All other reagents for synthesis and analysis were purchased from Aldrich Chemical Co. Milwaukee, WI, unless otherwise indicated in the text. FBWAY, FPWAY and [18F]FPWAY were prepared according to the published procedure [9, 16, 18].
FPWAY was dissolved in ethanol at a concentration of 100 μg/mL. The stock concentration of internal standard FBWAY was 200 ng/mL in ethanol. The final concentration of internal standard in injection was 20 ng/ml. The mass concentration of [18F]FPWAY, and hence the specific activity at EOB, was determined by LC/MS according to the following method.
2.2. LC/MS
All experiments were performed with a Waters Qtof Premier (Waters, Milford, MA, USA) coupled with Waters Acquity UPLC system. LC/MS analysis employed an Acquity BEH Shield RP18 column (150 × 2.1 mm) interfaced to the Waters Q-TOF MS. The elution profile had the following components: initial conditions 95% (v:v) 25 mM ammonium acetate 5% CH3CN; gradient 5–46% acetonitrile over 1 min; isocratic elution at 46% acetonitrile for an additional 9 min; 95% acetonitrile for 1min; and re-equilibrated with 95% aqueous for additional 1 min. The retention time for FPWAY and internal standard FBWAY were 9.32 and 8.48 min, respectively. The injection volume was 10 μL. The entire column elute was introduced into Waters Qtof premier mass spectrometer, which had been tuned for optimum sensitivity to FPWAY. The Qtof was set for positive ESI mode with single peak extract of 435 for FBWAY and 436 for FPWAY. Ion detection was achieved with the ESI using a source capillary voltage of 0.5 kV, source temperature of 110°C, desolvation temperature of 200°C, cone gas flow of 50 L/Hr (N2), and desolvation gas flow of 700 L/Hr (N2).
2.3 HPLC-MS calibration for FPWAY using FBWAY as internal standard (IS)
Calibration standards were prepared with standard FPWAY (0.1, 1, 5, 20, 200 ng/mL) containing the same concentration of FBWAY (20 ng/mL) as an internal standard. A second calibration, in order to evaluate extraction efficiency, used homogenized brain tissue and plasma from non-treated animals as media. Tissue (200–500 mg) or plasma (200 μL) was added with 0.1, 1, 5, 20, 200 ng of standard FPWAY respectively, mixed with 0.1 mL FBWAY (200 ng/mL), incubated for 5 minutes followed by adding 0.4 mL buffer (pH 12.5) and homogenization, the suspensions were extracted with 1 mL of hexane:ethyl acetate (4:1). The upper phase was separated and evaporated to dryness [11]. The residue was taken up in 1 ml 50% CH3CN/water for LC-MS analysis. Calibration curves were generated using triplicate injections of each standard.
2.4. Biodistribution studies of FPWAY using simultaneous injection of radioactivity and mass
All animal studies were conducted under protocol approved by the NIH Animal Care and Use Committee. Adult male Sprague-Dawley rats weighing 220–260 g were used for the studies. Each data group contains 3 rats. Awake rats were injected i.v. with 0.5 to 1 mCi of [18F]FPWAY in 100 μL; the doses contained either 1 nmol (NCA), 11 nmol, or 18 nmol of FPWAY as determined by this same LC/MS quantitation method. The concentrat[ion of non-radioactive FPWAY in the injection solution was confirmed by LC/MS by diluting the stock 100 fold then adding the internal standard. The rats were sacrificed 5 or 30 min after injection. The brains were removed and dissected. Blood was taken and centrifuged. The dissected regions (caudate, thalamus, hippocampus, brain stem, cerebellum and cortex) and plasma were weighed (0.05–0.4 g) and counted to determine the radioactivity. After counting, the tissues were processed as described above for the tissue generated standard curve. All samples were analyzed in triplicate.
Both mass, determined by LC-MS, and radioactivity counting in each region, was expressed as DUR (%ID/g * body weight/100). The specific binding ratios were defined as [(DURtissue / DURcerebellum)−1].
3. Results and discussion
The purpose of this study was to demonstrate the utility of high sensitivity UPLC-MS in determination of biodistribution of PET radioligands at no-carrier-added level without the need for radiolabeling. The main factor in sensitivity was the development of ionization parameters to efficiently ionize the molecule to be analyzed. Since the ionization efficiency is compound specific, it was necessary to demonstrate sensitivity for each molecule. The sensitivity of mass spectral instrumentation has been increased with each new generation of instrument and is clearly able to detect no-carrier-added radiochemicals at the specific activity typically produced in our facility.
To test our hypothesis that new mass spectrometry equipment can be used to evaluate high specific activity tracers, we set out to reproduce biodistribution data for FPWAY, a 5HT1A ligand previously developed in our laboratory [9, 16, 18]. The hippocampus to cerebellum ratio is a direct measurement of the affinity of the ligand for its receptor [16]. We conducted experiments to determine the brain region to cerebellum ratio using both radioactivity and mass determination by UPLC-MS and compared the results.
Optimal quantitation by mass spectrometry is obtained using an internal standard method. An internal standard method provides %RSD (percent relative standard deviation) of around 2% whereas an external standard method has %RSD near 20%. The internal standard provides a better control for extraction efficiency, injection volume deviations, and ionization variability.
The internal standard should be added at the beginning of the sample work-up, typically before the plasma protein precipitation, tissue homogenization, or solid phase extraction. The internal standard should be added at the same level in every sample including the standards and give a reliable MS response. Care should be taken that the amount of the internal standard is well above the limit of quantitation but not so high as to suppress the ionization of the analyte. A good rule of thumb is to target the internal standard to the lower 1/3 of the working standard curve. This is a range that will give an appropriate response without interfering with the ionization of the analyte.
The best internal standard is a stable-isotopically labeled version of the molecule to be quantified (ideally with a mass difference of 6 amu), since the isotopically labeled analogue will have nearly the same extraction recovery, chromatographic retention, and mass spectral ionization response. However, we did not have access to an isotopically labeled reference standard. Instead, we utilized FBWAY as our internal standard. FBWAY differs from FPWAY by substitution of the pyrimidine ring with a pyridine ring.(Fig. 1). We found that the extraction recovery of FBWAY and FPWAY were not statistically different in plasma (93 ± 2% versus 90 ± 3%, n = 4, p = 0.15) or brain (84 ± 4% versus 82 ± 3%, n = 4, p=0.15) as evaluated by t-test. The comparison of ionization response in ESI mass spectrometry was conducted by determining the correlation between the areas of the two compounds at the same concentrations. A plot of the paired points of peak area of each compound ( X = FPWAY, Y = FBWAY) yielded a line with slope of 0.998 ± 0.03, n = 3, R =0.9998 in 0.1 to 20 ng/ml range. The linear regression test (p = 0.99) comparing the slopes of the two lines demonstrated that they were not statistically different. The chromatographic retention time were 8.46 (FBWAY), 9.32 (FPWAY) min with peak resolution from 2.5 to 2.8.
Fig. 1.
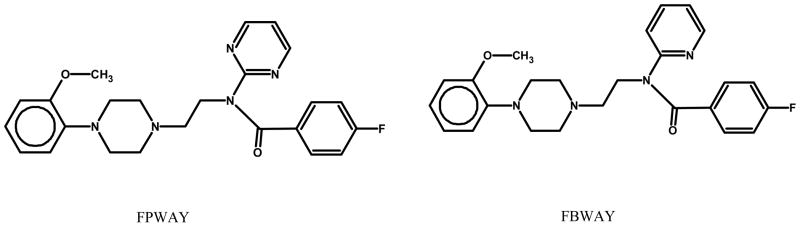
Chemical structures of FPWAY and FBWAY
Standard curves were established from two different sets of standards. The first set used various concentrations of FPWAY with IS FBWAY in CH3CN:water (1:1), UPLC-MS analysis showed a linear response from 0.1– 200.0 ng/mL (1 pg to 2 ng on column) (Slope 0.052 ± 0.003, n=5, R 0.999). The signal to noise ratio of the 0.04 ng/ml standard measured > 3 and thus is approaching our limit of detection.
The second set was generated using various concentrations of FPWAY with IS FBWAY added to either plasma or mixed brain tissue followed by homogenization and extraction of the mixture with ethyl acetate : hexane (25:75). The detection limit in the extraction of plasma and brain tissue was 0.05 ng/ml. We utilized liquid-liquid extraction of the parent compounds with hexane-ethyl acetate in order to increase the sensitivity, by allowing rapid concentration by evaporation, and to reduce the amount of protein and other polar impurities injected onto the UPLC column. We observed some extraction difference between plasma and brain tissue. In order to reduce the matrix effect and extraction difference, we used different standard curves for brain tissue and plasma to analyze our data, the slope of the standard curves are 0.051±0.004,R=0.9994, n=6 with tissue correction and 0.049±0.003, R=0.9987, n=5 with plasma correction. With the suggestion of a reviewer, we did a stacked linear regression test for statistical difference between the slopes of the two standard curves(brain tissue and plasma) and found the difference non-significant(p-value is 0.17). We plot the paired points of same concentration from standard curve against each other (X = Brain/Y = Blank), the slope is high(1.17) at high values(20.0–100 ng/ml) and close to one (1.02) at low values (0.1–20.0 ng/ml). The tissue concentration could be underestimating at high concentrations even though we used the extended linear range function of QTOF Premier. The concentrations of FPWAY in the final assayed solutions from brain tissues and plasma after extraction ranged from 0.3 to 12 ng/ml and fall in the low linear range of corrected standard curve.
For the in vivo biodistribution studies we injected rats (i.v.) with 0.5–1.0 mCi of [18F]FPWAY containing 1, 11 and 18 nmol non-radioactive FPWAY. At the end of the allotted time (5 or 30 min), the animals were killed and six regions of brain and plasma from each animal were processed for quantitative measurement of radioactivity parent compound concentration by UPLC-MS. The data was then converted to DUR %ID/g (table 1) and the brain tissue specific binding ratio [(DURtissue / DURcerebellum)-1] (table 2), and allow us to direct comparison with data obtained by gamma counting of the co-injected radioactive [18F]FPWAY.
Table 1.
The differential uptake ratio DUR (%ID/g * body weight/100)
| DUR (%ID/g * body weight/100) | 1 nmol | 11 nmol | 18 nmol | |||||
|---|---|---|---|---|---|---|---|---|
| 5 min | 30 min | 30 min | 30 min | |||||
| LC/MS | Radioactivity | LC/MS | Radioactivity | LC/MS | Radioactivity | LC/MS | Radioactivity | |
| Hippocampus | 4.28±0.35 | 4.50±0.41 | 2.20±0.38 | 2.34±0.22 | 0.79±0.08 | 0.83±0.03 | 0.53±0.03 | 0.53±0.02 |
| cortex | 3.10±0.78 | 3.75±0.74 | 1.06±0.25 | 1.12±0.18 | 0.52±0.05 | 0.50±0.04 | 0.41±0.18 | 0.41±0.13 |
| cerebellum | 1.31±0.21 | 1.55±0.24 | 0.32±0.08 | 0.36±0.05 | 0.23±0.03 | 0.22±0.02 | 0.16±0.02 | 0.15±0.01 |
| caudate | 1.70±0.30 | 2.14±0.27 | 0.60±0.04 | 0.56±0.01 | 0.38±0.06 | 0.30±0.02 | 0.25±0.08 | 0.24±0.04 |
| brain stem | 2.36±0.35 | 2.53±0.48 | 0.98±0.05 | 0.78±0.08 | 0.32±0.05 | 0.37±0.05 | 0.30±0.05 | 0.27±0.03 |
| thalamus | 2.39±0.45 | 2.54±0.43 | 0.81±0.02 | 0.84±0.06 | 0.41±0.08 | 0.38±0.02 | 0.30±0.04 | 0.28±0.02 |
| plasma | 0.49±0.17 | 0.21±0.07 | 0.13±0.02 | 0.33±0.11 | ||||
Table 2.
The brain tissue specific binding ratio [(DURtissue/DURcerebellum)−1].
| Specific binding ratios [(DURtissue/DURCb)−1] | 1 nmol | 11 nmol | 18 nmol | |||||
|---|---|---|---|---|---|---|---|---|
| 5 min | 30 min | 30 min | 30 min | |||||
| LC/MS | Radioactivity | LC/MS | Radioactivity | LC/MS | Radioactivity | LC/MS | Radioactivity | |
| Hippocampus | 2.30±0.42 | 1.95±0.45 | 5.87±0.56 | 5.38±0.23 | 2.43±0.35 | 2.72±0.37 | 2.42±0.28 | 2.57±0.21 |
| cortex | 1.34±0.27 | 1.41±0.13 | 2.29±0.06 | 2.04±0.18 | 1.26±0.28 | 1.26±0.11 | 1.61±0.39 | 1.81±0.83 |
| caudate | 0.30±0.13 | 0.38±0.06 | 0.95±0.06 | 0.53±0.17 | 0.65±0.31 | 0.33±0.06 | 0.67±0.31 | 0.63±0.34 |
| brain stem | 0.75±0.35 | 0.63±0.08 | 1.99±0.53 | 1.12±0.06 | 0.42±0.33 | 0.68±0.14 | 0.93±0.13 | 0.85±0.26 |
| thalamus | 0.84±0.30 | 0.64±0.04 | 1.58±0.58 | 1.29±0.13 | 0.78±0.29 | 0.70±0.12 | 0.91±0.14 | 0.90±0.13 |
As shown in table 1, the brain tissue specific uptake ratios determined by the two methods differed by less than 20% [paired t-test, p>0.05] in all brain regions except caudate ( 1 nmol, 5 min and 11 nmol, 30 min ) and brain stem (1 nmol, 30 min). Caudate has low tissue mass and lower actual mass of test compound; the measurement of the mass, accurate dissection and efficient extraction can introduce error. We have no rationale for differences observed in brain stem. LC/MS method average COV is little higher than radioactivity method, this may caused by extraction or the nature of Qtof MS in quantitation. This can be improved by using the isotopically labeled analogs as IS or using Triple Quadrupole MS. The hippocampus had the highest uptake because of the highest density of 5-HT1A receptor. The cerebellum had the lowest uptake because it has no 5-HT1A receptor, therefore cerebellum served as the reference tissue for specific binding[16].
The sensitivity of our mass spectrometer allowed determination of FPWAY at the no-carrier-added level [1 nmol] and allowed determination of the level of blocking by the same cold parent compound [11 nmol and 18 nmol]. At the no-carrier-added level, the hippocampus uptake (DUR) was 4.28 (4.50 by radioactivity) at 5 min and decreased to 2.20(2.38 radioactivity) by 30 minutes. During the same time period, the specific binding ratio increase from 2.30 at 5 min to 5.87 at 30 min. At the higher mass doses of FPWAY (11 and 18 nmol), blocking of uptake was observed. The DUR decreased from 2.20 (no-carrier-added, 1 nmol) to 0.79(11 nmol) and 0.53(17 nmol). The specific binding ratio was decreased from 5.87(no-carrier-added, 1 nmol) to 2.43(11 nmol) and 2.42(17 nmol). This data indicated FPWAY demonstrates saturability of binding with increasing mass dose as expected for a typical 5-HT1A antagonist. [16].
Quantitation of known metabolites could be done with this technique[8], provided a pure calibration standard of the metabolite was prepared. Without a standard only qualitative knowledge of metabolites can be deduced. Although we did not attempt, in principal full kinetic curves could be generated for the parent compound. The physical half-life of the radionuclide is no longer a limiting factor in sample analysis. Only the stability of the compound under storage will affect the time available for analysis.
In conclusion, we have demonstrated that a LC/MS method can be utilized to determine the biodistribution of a potential novel radiotracer without the need to radiolabel the compound. Though the instrument we used in this study may not detect some high specific radiotracers and the limits of detection, which will be different for each chemical identity, still need to explored, the new highly sensitive Triple Quadrupole MS could detect this class of compounds at a total mass dose of less than 1 nmol per animal. We observed a significant concordance between the LC/MS biodistribution analysis and radioactivity method in determination of Differential Uptake Ratio and the specific binding ratio in the rat brain. This concordance indicates that high sensitivity LC/MS is an indispensable tool in quantitating tracer molecule in target and non-target tissues and can be applied to the development of new molecular imaging probes.
References
- 1.Phelps ME. PET: physics, instrumentation and scanners. Springer; New York: 2006. [Google Scholar]
- 2.Welch MJ, Redvanly CS. Handbook of Radiopharmaceuticals. 1. Wiley; 2002. [Google Scholar]
- 3.Stöcklin G, Pike VW. Radiopharmaceuticals for Positron Emission Tomography - Methodological Aspects. 1. Springe; 1993. [Google Scholar]
- 4.Giovacchini G, Lang L, Ma Y, Herscovitch P, Eckelman W, Carson RE. Differentaila effects of the seleective serotonin reuptake inhibitor paroxetine on raphe and cortical 5-HT1A binding; A PET study in monkey with [18F]FPWAY. Neuroimage. 2004;22(Suppl 2):T25–T26. doi: 10.1016/j.neuroimage.2005.05.042. [DOI] [PubMed] [Google Scholar]
- 5.Lang L, Jagoda E, Schmall B, Sassaman M, Ma Y, et al. Fluoro analogs of WAY-100635 with varying pharmacokinetics properties. Nucl Med Biol. 2000;27:457–462. doi: 10.1016/s0969-8051(00)00111-6. [DOI] [PubMed] [Google Scholar]
- 6.Lang L, Jagoda E, Schmall B, Sassaman M, Ma Y, Eckelman WC. Fluoro analogs of WAY-100635 with varying pharmacokinetics properties. Nuclear Medicine and Biology. 2000;27(5):457– 462. doi: 10.1016/s0969-8051(00)00111-6. [DOI] [PubMed] [Google Scholar]
- 7.Fletcher A, Clif IA, Dourish CT. Silent 5-TH1A receptor antagonist: utility as research and therapeutic agents. TIPS. 1993;141:441–448. doi: 10.1016/0165-6147(93)90185-m. [DOI] [PubMed] [Google Scholar]
- 8.Ma Y, Kiesewetter D, Lang L, Eckelman WC. Application of LC-MS to the analysis of new radiopharmaceuticals. Mol Imaging Biol. 2003;5(6):397–403. doi: 10.1016/j.mibio.2003.09.013. [DOI] [PubMed] [Google Scholar]
- 9.Ma Y, Lang L, Kiesewetter D, Jagoda E, Eckelman WC. Species Differences In Metabolites of PET Ligands – Serotonergic 5-HT1A Receptor antagonists, 3-trans and 3-cis-FCWAY. NUCL MED BIOL. 2006;33:1013–1019. doi: 10.1016/j.nucmedbio.2006.09.006. [DOI] [PubMed] [Google Scholar]
- 10.Matusch A, Meyer P, Bier D, Holschbach M, Woitalla D, Elmenhorst D, Winz O, Zilles K, Bauer A. Metabolism of the A1 adenosine receptor PET ligand [18F]CPFPX by CYP1A2: implications for bolus/infusion PET studies. NUCL MED BIOL. 2006;33:891– 898. doi: 10.1016/j.nucmedbio.2006.07.006. [DOI] [PubMed] [Google Scholar]
- 11.Ma Y, Kiesewetter DO, Lang L, Der Margaret Huang BX, Carson RE, Eckelman WC. Determination of [18F]FC-WAY, [18F]FP-TZTP, and their metabolites in plasma using rapid and efficient liquid-liquid and solid phase extractions. NUCL MED BIOL. 2003;30:235–240. doi: 10.1016/s0969-8051(02)00452-3. [DOI] [PubMed] [Google Scholar]
- 12.Chernet E, Martin LJ, Li D, Need AB, Barth VN, Rash KS, Phebus LA. Use of LC/MS to assess brain tracer distribution in preclinical, in vivo receptor occupancy studies: Dopamine D2, serotonin 2A and NK-1 receptors as examples. Life Sciences. 2005;78:340–346. doi: 10.1016/j.lfs.2005.04.075. [DOI] [PubMed] [Google Scholar]
- 13.Barth VN, Chernet E, Martin LJ, Need AB, Rash KS, Morin M, Phebus LA. Comparison of rat dopamine D2 receptor occupancy for a series of antipsychotic drugs measured using radiolabeled or nonlabeled raclopride tracer. Life Sciences. 2006;78:3007–3012. doi: 10.1016/j.lfs.2005.11.031. [DOI] [PubMed] [Google Scholar]
- 14.Mathis CA, Simpson NR, Mahmood K, Kinahan PE, Mintun MA. [11C]WAY 100635: A radioligand for imaging 5-HT1A receptors with positron emission tomography. Life Science. 1994:403–407. doi: 10.1016/0024-3205(94)00324-6. [DOI] [PubMed] [Google Scholar]
- 15.Pike VW, McCarron JA, Lammertsma AA, Hume SP, Poole K, et al. First delineation of 5-HT1A receptors in human brain with PET and [11C]WAY-100635. Eur J Pharmacol. 1995;283:R1–R3. doi: 10.1016/0014-2999(95)00438-q. [DOI] [PubMed] [Google Scholar]
- 16.Lang L, Jagoda E, Schmall B, Vuong BK, Adams HR, et al. The Development of fluorine-18-labeled 5-HT1A antagonists. J Med Chem. 1999;42:1576–1586. doi: 10.1021/jm980456f. [DOI] [PubMed] [Google Scholar]
- 17.Carson RE, Lang L, Watabe H, Der MG, Adams HR, et al. PET evaluation of [(18)F]FCWAY, an analog of the 5-HT(1A) receptor antagonist, WAY-100635. Nucl Med Biol. 2000;27:493–497. doi: 10.1016/s0969-8051(00)00118-9. [DOI] [PubMed] [Google Scholar]
- 18.Lang L, Jagoda E, Ma Y, Sassaman MB, Eckelman WC. Synthesis and in vivo biodistribution of F-18 labeled 3-cis-, 3-trans-, 4-cis-, and 4-trans fluorocyclohexane derivatives of WAY 100635. Bioorg Med Chem. 2006;14:3737–3748. doi: 10.1016/j.bmc.2006.01.064. [DOI] [PubMed] [Google Scholar]