

Abstract
All-trans-retinal (AtRal) can accumulate in the retina as a result of excessive exposure to light. The purpose of this study was to compare cytotoxicity of AtRal and photodegraded AtRal (dAtRal) on cultured human retinal pigment epithelial cells in dark and upon exposure to visible light. AtRal was degraded by exposure to visible light. Cytotoxicity was monitored by imaging of cell morphology, propidium iodide staining of cells with permeable plasma membrane and measurements of reductive activity of cells. Generation of singlet oxygen photosensitized by AtRal and dAtRal was monitored by time-resolved measurements of characteristic singlet oxygen phosphorescence. Photodegradation of AtRal resulted in a decrease in absorption of visible light and accumulation of the degradation products with absorption maximum at ~330 nm. Toxicity of dAtRal was concentration-dependent and was greater during irradiation with visible light than in dark. DAtRal was more cytotoxic than AtRal both in dark and during exposure to visible light. Photochemical properties of dAtRal indicate that it may be responsible for the maximum in the action spectra of retinal photodamage recorded in animals. In conclusion, photodegradation products of AtRal may impose a significant threat to the retina and therefore their roles in retinal pathology need to be explored.
INTRODUCTION
All-trans-retinal (AtRal) is formed in the retina as a result of photoisomerisation of the visual pigment chromophore, 11-cis-retinylidene followed by its hydrolysis from the protein, opsin (reviewed in 1–3). During exposure to light under conditions where the rate of AtRal release exceeds the rate of its enzymatic removal, AtRal can accumulate in photoreceptor outer segments (POS). AtRal is a potent photosensitizer which upon photoexcitation with UVA or blue light in the presence of oxygen leads to formation of singlet oxygen (1O2), highly capable of oxidizing biological molecules such as nucleic acids, proteins and unsaturated lipids (1–3). POS are composed mainly from lipids and proteins, which themselves may become targets of photosensitized damage mediated by AtRal. POS are in intimate proximity to the retinal pigment epithelium (RPE), a monolayer of cells separating the retina from the choroidal blood supply which is essential for proper function and survival of photoreceptors (4). Experiments in vitro and in vivo have revealed several pathways by which AtRal can be damaging to the RPE in dark (1–3,5–13). Dysfunction of the RPE is followed by dysfunction and ultimately loss of photoreceptors, and, as a consequence, visual loss.
The role of AtRal as the major causative factor in light-induced damage to the retina was deduced in 2005 (1). Recent studies on knockout mice with delayed clearance of AtRal from the retina confirmed that finding and added a wealth of information on the cellular and molecular effects exerted by AtRal on retinal cells [reviewed by Maeda et al. 2012 in this Symposium-in-Print on Light-Induced Damage to the Retina (5)]. Maeda and colleagues demonstrated that AtRal causes activation of NADPH oxidase which, in turn, produces superoxide leading to increased oxidative stress. Activation of NADPH oxidase initiated by AtRal is mediated by at least two G-protein coupled receptors, involves production of inositol triphosphate (PI3), and mobilization of intracellular calcium stores resulting in an increase in cytoplasmic calcium. Also toll-like receptor 3 (TLR-3) is activated by AtRal and, in turn, stimulates further signalling cascade involving activation of nuclear factor kappa-light-chain-enhancer of activated B cells (NF-κB) and interferon regulatory factor 3 (IRF3), eventually leading to apoptosis and an inflammatory response.
Retinoids are very susceptible to oxidation and photodegradation induced by ultraviolet light under aerobic conditions (12,14–16). The degradation products include several endoperoxides, shorter-chain aldehydes and epoxides. Thus, it may be hypothesized that these products of AtRal degradation also contribute to cytotoxicity. UV light normally does not reach the retina in an adult human eye. Absorption spectrum of AtRal extends into the violet-visible part of the optical spectrum and photoexcitation of AtRal with blue light in the presence of oxygen leads to photosensitized generation of singlet oxygen, which in turn can oxidize AtRal. Thus it can be expected that irradiation of AtRal with visible light will lead to AtRal degradation. The purpose of this study was to compare cytotoxic effects of AtRal and AtRal photodegraded by visible light (dAtRal) on cultured RPE cells in dark and upon exposure to visible light. Cytotoxicity was monitored by imaging of cell morphology, propidium iodide staining of cells with permeable plasma membrane and measurements of reductive activity of cells. Generation of singlet oxygen photosensitized by AtRal/dAtRal was monitored by time-resolved measurements of characteristic singlet oxygen phosphorescence. Our results demonstrate that AtRal is susceptible to degradation induced by visible light and that the degradation products are more cytotoxic than AtRal. The absorption spectrum of the degradation products and their photosensitizing properties indicate that they may be responsible for the maximum in UV in the action spectra of retinal photodamage recorded in previous studies on aphakic monkeys and rats (3,17,18).
MATERIALS AND METHODS
Photodegradation of all-trans-retinal (AtRal)
AtRal (Sigma-Aldrich Co.) was degraded by exposure of AtRal solubilized in benzene to visible light from a solar simulator Sol lamp (Hönle UV Ltd, Birmingham). Benzene was used as a solvent due to its low chemical reactivity. Heat and UV filters (Lee Heat Shield and #226 Lee UV filter, respectively; Lee Filters, UK) were placed between the lamp and glass Petri dish with the solution of AtRal. Spectral irradiance of the light source between 380 and 780 nm was measured in each experiment using a handheld spectroradiometer (Specbos 1201 with JETI LiMeS software; Glen Spectra, UK). The distance between the lamp and the glass shelf where the Petri dishes were positioned was adjusted so the irradiance at the sample level was ~12 mW cm−2 (Fig. 1). During exposure to light, the temperature was held at 34°C.
Figure 1.
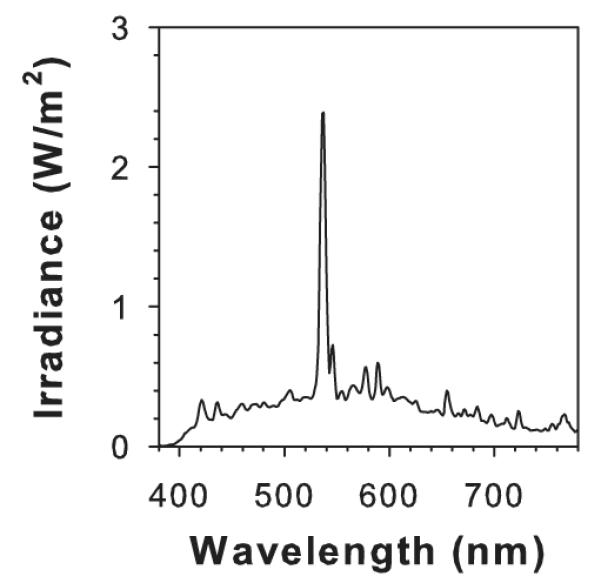
Irradiance spectrum of visible light used for AtRal degradation and exposure of ARPE19 cells; ~12 mW cm−2.
Photodegradation of AtRal was monitored at selected times of 0, 10, 30, 60, 90 and 120 min by measurements of absorbance spectra. The level of degradation was estimated by a decrease in absorption maximum of AtRal at 380 nm and an increase in ratio of absorbance at shorter wavelengths (at 337 nm) to absorbance at 380 nm or at longer wavelengths. For each wavelength, the contribution of products of AtRal degradation to the absorption spectrum was calculated using the equation below:
where ADP,λ denotes the lower limit for contribution to absorbance at wavelength λ by the degradation products (DP) of AtRal; AdAtRal,λ—the recorded absorbance at wavelength k of the mixture of the degradation products and the remaining AtRal; AdAtRal,λ—the recorded absorbance at wavelength λ of AtRal; AdAtRal,380 nm—the recorded absorbance of the mixture of the degradation products and the remaining AtRal at 380 nm; AAtRal,380 nm—the recorded absorbance of AtRal at 380 nm. This was based on an assumption that absorbance at 380 nm was due to AtRal only. However, as the subtraction from the recorded spectra of the assumed AtRal contribution produced substantial negative values of absorbance, an analogous procedure was applied with an assumption that AtRal is the major absorber at 450 nm.
For storage of dAtRal, benzene was evaporated on a rotary evaporator immediately after photodegradation and degraded AtRal was stored under argon until use.
Calculations of intensities of absorbed light and numbers of absorbed photons
Intensity of absorbed light for each wavelength was calculated based on irradiance spectrum and sample absorbance spectra:
where IA,λ denotes intensity of absorbed light at wavelength λ; Aλ—sample absorbance at wavelength λ; I0,λ—intensity of incident light at wavelength λ.
The ratios of total numbers of absorbed photons for dAtRal samples relative to the initial sample of AtRal, NdAtRal, Total/NAtRal, Total were calculated based on the following equation:
where ∑ denotes summation for each wavelength from the range of 380–780 nm, ∑NdAtRal,λ, ∑NAtRal,λ—sums of fluxes of absorbed photons for each wavelength λ from the range of 380–780 nm for dAtRal and AtRal samples, respectively; ∑IA,dAtRal,λλ, ∑IA,AtRal,λλ—sums of products of the wavelength λ and absorbed light intensity at λ for each wavelength from the range of 380–780 nm for dAtRal and AtRal samples, respectively.
RPE cell culture
Spontaneously immortalized cell line ARPE-19 derived from a 19 year old donor of human retinal pigment epithelial cells was obtained from the American Type Culture Collection (ATCC; Manassas, VA). ARPE-19 cells have been shown to exhibit several, but not all, functional and structural properties of human RPE cells (19). Cells were cultured in a 1:1 mixture of Dulbecco’s Eagle’s medium and Ham’s F12 medium (DMEM:F12, GIBCO, UK) supplemented with antibiotics (0.1 mg mL−1 streptomycin, 0.1 mg mL−1 kanamycin and 0.06 mg mL−1 penicilin; Sigma, UK), fungizone (1.25 μg mL−1 amphotericin; GIBCO, UK) and 10% vol/vol heat-inactivated fetal calf serum (FCS; BioSera) at 37°C in a humidified incubator containing 5% CO2 and 95% air. For cytotoxicity experiments, cells were cultured in 24-well plates. As soon as cells reached confluence, the concentration of FCS was decreased to 2% and cells were maintained in culture medium with 2% FCS for 4–5 days before the experiments to reduce the variability in their responses to photo-oxidative stress (20).
Exposure of ARPE-19 cells to ATR or dATR, and light
Before exposure to AtRal or degraded AtRal, cell culture medium was removed and the wells were gently washed twice with phosphate-buffered saline (PBS) with an addition of calcium chloride and magnesium chloride (Dulbecco’s PBS, GIBCO, UK; DPBS) in order to remove the remnants of culture medium which itself contains photosensitzers (21). ARPE-19 cells were exposed to 1 mL/well of AtRal or degraded AtRal which were first solubilized in dimethylsulfoxide (DMSO) and then diluted in DPBS to the final 0.2% DMSO. Culture plates with cells in the presence of AtRal/dAtRal or the vehicle (0.2% DMSO) were exposed for 60 min to visible light from the same light source as for AtRal photodegradation. For incubations with AtRal/dAtRal in dark, culture plates were wrapped in blackened aluminium foil and then in aluminium foil, and placed above the lamp to mimic the temperature and air conditions experienced by light-exposed cells. Spectral irradiance at the sample level was measured in each experiment using a handheld spectroradiometer (Specbos 1201 with JETI LiMeS software; Glen Spectra, UK). One hour exposure was followed by washing cells twice with D-PBS, covering with culture medium containing 2% FCS and then returning them to the incubator until cytotoxicity assays which were performed 24 h postexposure unless stated otherwise.
Phase contrast microscopy for imaging of cell monolayer morphology
Cells were visualized using an Olympus IX70 inverted microscope with phase contrast. Images were obtained using a Spot RT color CCD camera and Spot Advanced software (Diagnostic Instruments Inc, UK).
Staining with Hoechst 33342 and propidium iodide to visualize apoptotic and necrotic cells by fluorescence microscopy
Hoechst 33342 (Hoechst) permeates through the plasma membrane and binds to DNA emitting blue fluorescence (maximum at ~460 nm) when excited with UV-A light (excitation maximum at about 350 nm) so allows visualization of all nuclei and differentiation between normal and apoptotic cells whose nuclei appear shrunken and exhibit brighter fluorescence (12). Propidium iodide (PI) is a red-fluorescence dye (excitation/emission maxima ~535/617 nm when bound to DNA) which is normally not permeant through the plasma membrane so stains nuclei of dead cells with permeable plasma membrane. At selected times postexposure to AtRal/dAtRal (2 or 24 h), cells were incubated for 15 min at 37°C with 3 μg mL−1 Hoechst and 1 μg mL−1 PI in DPBS. After labelling, cells were washed with DPBS and imaged immediately for fluorescence with the Olympus IX70 inverted microscope. There were two filter sets used—one optimized for red emission of PI (excitation with filter transmitting 510–550 nm light; emission monitored after long-pass filter transmitting light >590 nm) and the other—for blue emission of Hoechst (excitation 330–385 nm; long-pass emission filter >420 nm).
Assay of reductive activity of cells
Living cells can reduce 3-(4,5-dimethylthiazol-2-yl)-2,5-diphenyl tetrazolium bromide (MTT) to formazan, and therefore quantification of formazan can be used as a rapid test of cell viability (22,23). ARPE-19 cells 24 h after exposure to AtRal/dAtRal were incubated for 1 h with 1 mL/well of 0.5 mg mL−1 MTT. Then, MTT solution was aspirated, cell monolayers in wells were washed with DPBS and after apirating DPBS, formazan was dissolved in acidified isopropanol (200 μL/well of isopropanol with 0.04 M HCl). Accumulated formazan was quantified by its absorbance at 590 nm in a microplate reader (BioTek ELx800). A reference filter at 690 nm was used and absorbance values at this wavelength were subtracted from the absorbance at 590 nm to minimize artefacts due to light scatter. Background measurements were taken in cells exposed to acidified isopropanol only (i.e. no ATR/dATR and no MTT) and corresponding absorbance values were subtracted. For all experiments the reductive activity was calculated as a ratio to control cells from the same plate (expressed as percentage) which were exposed only to the vehicle (0.2% DMSO). In a set of control experiments, reductive activities of cells incubated in dark or exposed to visible light in the presence of 0.2% DMSO were compared and it was demonstrated that there was no statistically significant difference between these two groups. Reductive activitites of ARPE-19 cells (A) in dark or upon exposure to visible light as a function of AtRal or dAtRal concentrations (c) were fitted to a four parameter logistic curve:
where m, M, EC50 and s stand for the fitted parameters representing a minimum and maximum of reductive activities, the concentration responsible for 50% inhibition of reductive activity and the slope of the curve, respectively.
Detection of singlet oxygen
To monitor formation and decay of singlet oxygen, time-resolved detection of characteristic singlet oxygen phosphorescence at 1270 nm was used (24–26). Air-saturated solutions of AtRal or dAtRal solubilised in benzene were photoexcited either by a 5 ns laser pulse of 355 nm wavelength from Continuum Surelite II-10 Q-switched Nd:YAG laser (Photonic Solutions Plc., Edinburgh, UK) or by selected wavelengths from a range of 414–2550 nm obtained from a tuneable Continuum Panther type II optical parametric oscillator pumped by the third harmonic of Nd:YAG laser (Photonic Solutions Plc., Edinburgh, UK). Laser energy of each shot was monitored by a photodiode, digitized and fed into a RISC computer (Acorn, Swadlincote, Derbyshire) for data normalization. The photodiode was calibrated with a J25LP-MB laser energy meter (Coherent, Portland, OR). The laser energy reaching the sample was varied using neutral density filters. Sample luminescence was monitored by a nitrogen-cooled germanium detector (Applied Detectors Co., CA), equipped with a cut-off filter transmitting light only above 1200 nm and an interference filter with maximum transmission centered at 1270 nm (LOT-Oriel UK, Leatherhead, UK), coupled to an Agilent digitizing scope (Infiniium 54830B DSO, Agilent, Santa Clara, CA) and interfaced with a LKS.60 nanosecond time-resolved spectrometer (Applied Photophysics, Leatherhead, UK) and RISC computer.
To compare the yields of singlet oxygen photosensitized by AtRal and dAtRal, the growth and decay of sample luminescence of samples containing AtRal or its equivalent after photodegradation were recorded. The decaying part of phosphorescence signal was fitted with a single exponential model, using the following equation:
where I denotes phosphorescence intensity, I0—the initial emission intensity extrapolated to the time of the laser pulse; k—rate constant of decay; t—time; I∞—emission intensity at t → ∞. The initial emission intensity was measured as a function of laser energy and the slopes of the linear portion of the curve were taken as yields of singlet oxygen.
To measure the quantum yields of singlet oxygen formation, AtRal was used as a standard with a known quantum yield of singlet oxygen generation of 0.30 ± 0.04 (24). AtRal sample was diluted to match absorbance of dAtRal at the excitation wavelength. The initial emission intensity was measured as a function of laser energy and relative slopes of the linear portion of the curve were used for calculation of singlet oxygen quantum yield generated by dAtRal according to the formula:
where ΦdAtRal denotes quantum yield of singlet oxygen generation for dAtRal, ΦAtRal—quantum yield of singlet oxygen generation for AtRal, αdAtRal—fitted slope for dAtRal; αAtRal—fitted slope for AtRal.
Calculations of total yields of singlet oxygen by samples illuminated with visible light
Total yields of singlet oxygen photosensitized by AtRal and dAtRal were calculated using the following equation:
where ψTotal denotes the total yield of singlet oxygen when sample was excited with visible light; [AtRal] denotes concentration of remaining AtRal relative to its initial concentration before photodegradation; ΦAtRal, ΦdAtRal denote quantum yields of singlet oxygen generation for AtRal and dAtRal, respectively; NAtRal, TotalNorm, NdAtRal, Total-Norm—total flux of absorbed photons relative to its initial value by AtRal and its degradation products, respectively.
Data analysis
Data analyses were carried out using Microsoft Office Excel 2007 and SigmaPlot for Windows version 11.0. Unless stated otherwise, data points in graphs represent the means, while error bars represent SEM from at least three independent experiments. Unless stated otherwise, statistical comparisons were carried out using SigmaPlot 11.0 by one way analysis of variance (ANOVA) and pairwise multiple comparison procedures (Holm–Sidak method).
RESULTS
Photodegradation of AtRal
Irradiation of AtRal with visible light led to a rapid decrease in absorbance at 380 nm corresponding to the absorption maximum of AtRal solubilized in benzene (Fig. 2a). After 2 h irradiation, the absorbance at 380 nm reached 20% of its initial value. The decrease in absorbance at 380 nm was accompanied by a relative increase of absorbance at shorter wavelengths indicating that the degradation products absorb shorter wavelength light than AtRal. For example, the ratio of absorbance of 380 nm to the absorbance at 337 nm decreased almost five-fold from 2.27 to 0.47 when the initial absorbance spectrum was compared with the spectrum after 2 h irradiation.
Figure 2.

Photodegradation of AtRal with visible light leads to AtRal depletion and accumulation of degradation products. Absorption spectra of AtRal before irradiation and after indicated times of exposure to 12 mW cm−2 of visible light (a). Absorbance spectra obtained after subtraction of AtRal contribution based on absorbance at 380 (b) and 450 nm (c). Ratios of absorbances at 450 and 337 nm as a function of the photodegradation time (d). Absorbances at 380 and 450 nm expressed as the percentage of the initial absorbances at the corresponding wavelengths as a function of the photodegradation time (e). Absorbance at 337 nm of the degradation products (from part c) as a function of the photodegradation time (f).
Because AtRal contributes to the absorbance at 337 nm, the measured absorbance at 337 nm of the mixture of AtRal and its degradation products represented the upper limit for the absorbance of the degradation products at this wavelength. Lack of an isosbestic point suggested that AtRal is degraded to more than one degradation product.
It can be expected that the degradation product(s) contribute to absorption at 380 nm. This notion was supported by the absorbance spectra obtained after subtracting from the measured spectra the contribution of AtRal estimated based on absorbance at 380 nm (Fig. 2b). The resulting difference spectra exhibited substantial negative values of absorbances between 380 and 460 nm, suggesting that quantification of AtRal at 460 nm or longer wavelengths may be a better approach. However, the absorbance of AtRal at 460 nm was rather small and therefore its measurement prone to increased experimental uncertainties. Therefore in attempt to quantify AtRal loss, absorbance at 450 nm was selected. The difference spectra of absorbance obtained after subtracting AtRal contribution (estimated based on absorbance at 450 nm) exhibited negative values only for 10 and 30 min photodegradation times, but not for longer degradation times, suggesting minor contributions of the late degradation products to absorbance at 450 nm (Fig. 2c). The ratio of absorbances at 337 nm to 450 nm exhibited an exponential decay with the irradiation time (Fig. 2d). Here, the ratios decreased ~11-fold when the initial absorbance spectrum was compared with the spectrum after 2 h irradiation, thus the change was about twice greater than the change in ratios of absorbances at 337 and 380 nm, supporting the choice of 450 nm over 380 nm for quantification of AtRal depletion.
The decay of atRal monitored at 450 nm demonstrated a monotonic decrease with photodegradation time, whereas at 380 nm there was an initial delay observed after 10 min irradiation time, corresponding possibly to the formation of a mixture of different isomers of retinal (27) (Fig. 2e). Within the range of 10–120 min of photodegradation time, the decrease in absorbances at 380 and 450 nm followed an exponential decay. After 2 h irradiation, ~92% of AtRal was degraded (Fig. 2e).
Assuming that AtRal was the main contributor to the absorbance at 450 nm, the subtraction of the remaining AtRal from the absorbance spectra allowed estimation of the absorbance spectrum of the degradation products (Fig. 2c). The absorbance of the degradation products at 337 nm rose exponentially to maximum approaching the plateau already after 90 min of photodegradation (Fig. 2f).
Depletion of AtRal and accumulation of the degradation products resulted in substantial changes of the absorption of photons from the visible part of the electromagnetic spectrum (Fig. 3). The absorbance integrated over the whole range of visible light (390–780 nm) and consequently the number of absorbed photons from the light source decreased rapidly with the degradation time (Fig. 3a). After 10 min photodegradation the decrease followed an exponential decay. After 120 min degradation, the integrated absorbance in the visible range was ~six-fold smaller than for the intact AtRal.
Figure 3.

Photodegradation of AtRal results in a decrease in absorption of visible light. Integrated absorbance for visible light (390–780 nm) and fluxes of absorbed photons of blue light as a function of the photodegradation time (a). Values are expressed as percentages of the initial integrated absorbance and flux of absorbed photons by AtRal/dAtRal. Spectra of absorbed visible light by a layer of AtRal/dAtRal solution in benzene (with absorption spectra shown in Fig. 2) after indicated photodegradation times (b).
To determine how changes in absorbance spectra due to photodegradation of AtRal affect absorption of photons from the light source, spectra of absorbed fluxes of light for AtRal/dAtRal solubilized in benzene were calculated (Fig. 3b). All samples absorbed only blue-violet light and the fluxes of absorbed light decreased rapidly with the photodegradation time (Fig 3b). The number of absorbed photons by samples photodegraded for 60 and 120 min decreased to 37% and 17%, respectively, when compared with the initial sample of AtRal (Fig. 3a).
Effects of AtRal and its degradation products solubilized in DMSO on RPE cell function and viability
Both AtRal and a mixture of all-trans-retinal and its degradation products obtained after 60 min of photodegradation (dAtRal) exhibited a dose-dependent effect on cell morphology, attachment and reductive capacity in dark and these effects were exacerbated by exposure to visible light (Figs. 4–6). Changes in cell morphology in dark were observed after incubation with 25 μM dAtRal with apparent cell shrinkage and rounding up (Fig. 4). The shrunken cells appeared above the monolayer as bright white spots when attempting to focus at the level of the monolayer. At 50 μM dAtRal, the majority of cells were affected. AtRal at the same concentration did not exert noticeable effects. Toxic effects of AtRal in dark were clearly visible at concentrations of 100 μM and higher.
Figure 4.

Effects of AtRal and degraded AtRal (dAtRal) on morphology of the ARPE-19 cell monolayer. Phase contrast images of ARPE-19 cells taken 24 h after 60 min incubation with indicated concentrations of AtRal or its degradation mixture in dark (dark) or during exposure to 12 mW cm−2 of visible light (light).
Figure 6.

Reductive capacity of ARPE-19 cells as a function of initial concentration of AtRal or degraded AtRal (dAtRal) measured by MTT assay 24 h after 60 min incubation with AtRal or degraded AtRal (dAtRal) in dark or during exposure to visible light (~12 mW cm−2) (a). Cells without AtRal/dAtRal were used as control (100% reductive capacity). Concentrations of AtRal/dAtRal responsible for inhibiting by 50% (EC50) of the reductive activity of ARPE-19 cells in dark and during exposure to visible light (b). EC50 ± SE were obtained from fitting experimental data to a four parameter logistic curve.
Concentrations of AtRal and dAtRal producing damage during exposure to visible light were at least twice lower than those producing similar damage in dark (Fig. 4). Rounding up of cells was observed in cells subjected to 18 and 12.5 μM of AtRal and dAtRal, respectively. The majority of cells were rounded up in wells subjected to 50 μM and 18 μM of AtRal and dAtRal, respectively.
Morphological changes also included condensation of the chromatin in the nuclei which was noticeable already 2 h postexposure and became more pronounced 24 h postexposure to 25 μM dAtRal both in dark and while irradiated with visible light (Fig. 5). Condensation of nuclei occurred also for cells treated with AtRal but for concentration of 50 μM and higher. Two hours postexposure there was very little labelling of nuclei with propidium iodide indicating that the majority of cells retained intact plasma membrane even when treated with the highest concentrations of AtRal and dAtRal. Twenty-four hours after exposure to AtRal or dAtRal, almost every field of view included some cells with plasma membrane permeable to propidium iodide.
Figure 5.
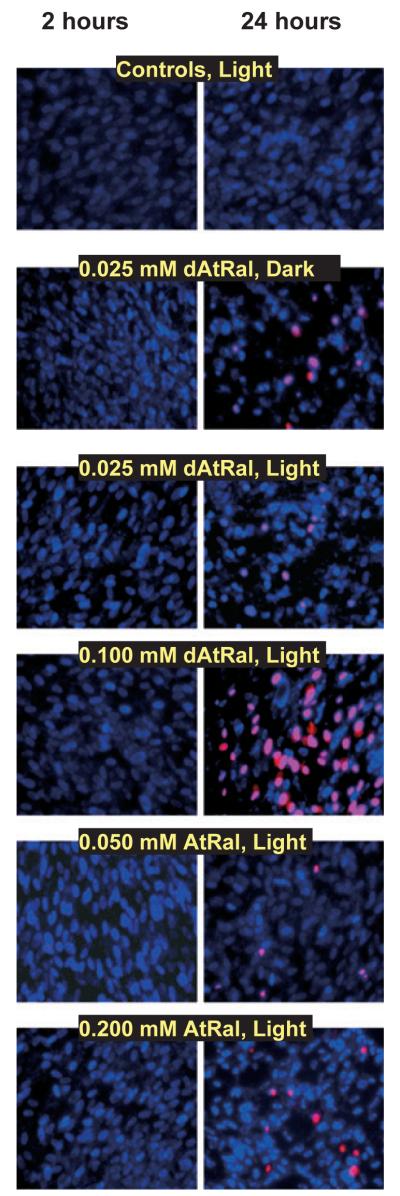
Representative photographs of ARPE-19 cells labelled with Hoechst (emission of fluorescence in blue) and propidium iodide (red emission) 2 or 24 h after completing 60 min incubation with indicated concentrations of AtRal or degraded AtRal (dAtRal) in the dark (dark) or during exposure to visible light (12 mW cm−2, light).
Measurements of the reductive capacity of cells gave consistent results with observations of cell morphology (Fig. 6). The lowest concentrations of AtRal and dAtRal significantly decreasing formazan formation (P < 0.05) in dark were 100 μM and 50 μM, respectively. For cells exposed to light, the lowest concentrations of AtRal and dAtRal significantly decreasing formazan formation were 50 and 25 μM. Concentrations of AtRal and dAtRal decreasing formazan formation by 50% (EC50) were 71 ± 6 and 39 ± 3 μM, respectively, in dark; whereas for light-exposed cells, concentrations of AtRal and dAtRal decreasing formazan formation by 50% were 30 ± 3 and 23 ± 2 μM, respectively (Fig. 6b).
To further determine how degradation of AtRal affects its cytotoxic properties, RPE cells were subjected to 50 μM AtRal or 50 μM AtRal photodegraded for different times up to 120 min when 92% of AtRal was degraded (Fig. 7a,b). The more degraded AtRal was the greater the inhibition of reductive activities of ARPE-19 cells. Already 30 min of degradation resulted in a significantly increased inhibitory effect in dark when compared to treatment with nondegraded AtRal. Despite the degradation-related decrease in fluxes of absorbed photons (Fig. 3), the inhibitory effect on reductive activity increased with increasing degradation time and loss of AtRal (Fig. 7).
Figure 7.
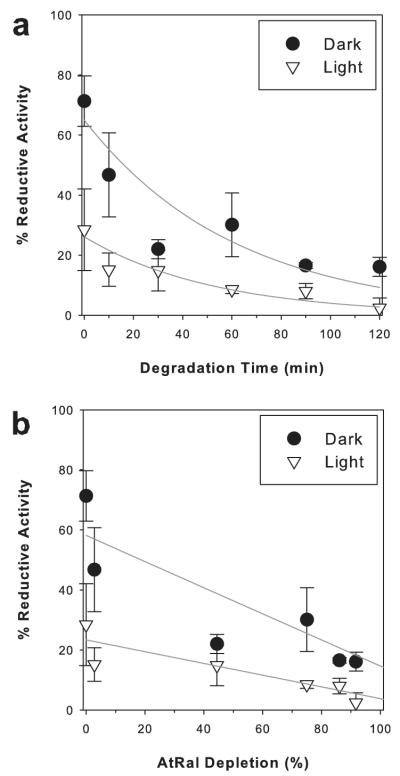
Reductive capacity of ARPE-19 cells as a function of the degree of AtRal degradation. The reductive activity was measured by MTT assay 24 h after 60 min incubation with 0.05 mM AtRal photodegraded by visible light for the indicated time (a) leading to the indicated loss of AtRal (b). During exposure to AtRal/degraded AtRal cells were kept in dark (dark) or exposed to visible light (~12 mW cm−2; light). Cells without AtRal/dAtRal were used as controls corresponding to 100% reductive capacity.
Comparison of photosensitized generation of singlet oxygen by AtRal and dAtRal
Both AtRal and dAtRal photosensitized singlet oxygen when excited with UV-A (355 nm) or blue (422 nm) light (Fig. 8). The yields of singlet oxygen photosensitized by samples of photodegraded AtRal were 34% and 72% lower than for AtRal for photoexcitation with 355 and 422 nm light, respectively (Fig. 8; Table 1). However, when the yields were compared for samples of AtRal and dAtRal absorbing the same number of photons, the quantum yields were the same within the experimental uncertainty both for excitation with UV-A light and blue light (Fig. 8; Table 1). It suggests that the photodegradation products have the same quantum yield of 1O2 generation as AtRal.
Figure 8.
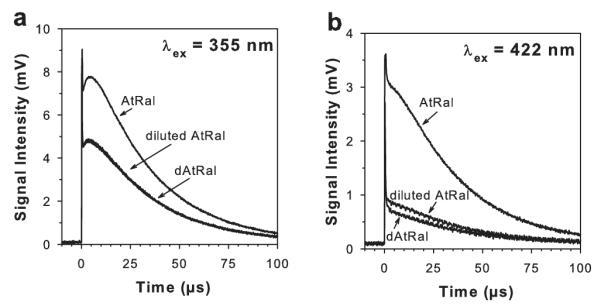
Representative kinetics of formation and decay of characteristic singlet oxygen phosphorescence at 1270 nm upon photoexcitation with 355 nm (a) and 422 nm (b) laser pulse. Samples contained 10 μM AtRal or degraded AtRal (dAtRal; obtained by photodegradation for 60 min of 10 μM AtRal with ~12 mW cm−2 visible light) solubilized in benzene in air equilibrium. For measurements shown in graph (a), absorbances of AtRal and dAtRal at 355 nm were 0.350 and 0.182, respectively. For measurements shown in graph (b), absorbances of AtRal and dAtRal at 422 nm were 0.181 and 0.042, respectively. To compare quantum yields of singlet oxygen photosensitized by AtRal and dAtRal, AtRal was diluted to match absorbance of dAtRal at the excitation wavelength (diluted AtRal).
Table 1.
Summary of singlet oxygen yields (relative to AtRal) and quantum yields in samples of (i) AtRal, (ii) AtRal photodegraded by visible light for 60 min, ~12 mW cm−2 (dAtRal), and (iii) AtRal diluted to match absorbance of dAtRal at the excitation wavelength (diluted AtRal).
| Excitation with UV-A light (355 nm) |
Excitation with blue light (422 nm) |
|||
|---|---|---|---|---|
|
1O2 yield ψ (%) |
1O2 quantum yield Φ |
1O2 yield ψ (%) |
1O2 quantum yield Φ |
|
| AtRal | 100 | 100 | ||
| dAtRal | 66 ± 4 | 0.31 ± 0.02 | 28 ± 2 | 0.33 ± 0.02 |
| Diluted AtRal | 0.30 ± 0.04* | 0.30 ± 0.04* | ||
Values represent means ± standard deviations from three experiments.
Value from reference (24).
The same quantum yields of photosensitized generation of singlet oxygen by excitation with 355 and 422 nm light, suggests that the quantum yields of singlet oxygen photosensitized by AtRal or dAtRal may be the same for the whole range of visible light they absorb. Based on that assumption, a ratio of singlet oxygen photogenerated by dAtRal and AtRal during irradiation with visible light could be calculated. To validate this approach, the ratio of yields of singlet oxygen photosensitized by AtRal/dAtRal samples of known absorbance at the excitation wavelength were calculated. For example, for samples of AtRal and dAtRal of absorbance at 355 nm of 0.350 and 0.182, respectively, the calculated ratio of yields of singlet oxygen produced by dAtRal and AtRal was 64%, which was in good agreement with its measured value of 66 ± 4% (Fig. 8a; Table 1). For excitation with 422 nm light, the calculated ratio of 30% was also in good agreement with the measured ratio of singlet oxygen produced by dAtRal and AtRal (28 ± 2)% (Fig. 8a; Table 1). When analogous calculations were made for the entire range of the visible spectrum taking into account absorption of light from our light source, the yield of singlet oxygen photosensitized by AtRal was 2.5-fold greater than for dAtRal obtained from 60 min photodegradation (Fig. 9a).
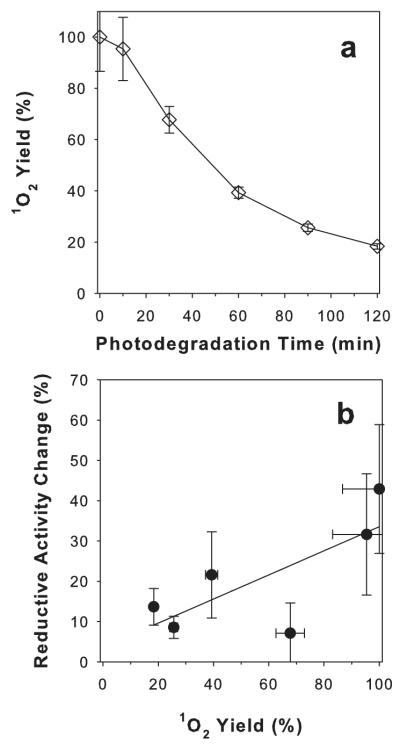
Figure 9.
Calculated singlet oxygen yields in samples containing AtRal or AtRal photodegraded for up to 120 min when excited with visible light in benzene (a). Difference between reductive activity of ARPE-19 cells maintained in dark and cells exposed to visible light during incubation with AtRal photodegraded for up to 120 min as a function of calculated yields of singlet oxygen generated during irradiation. The calculated yields are based on assumptions that AtRal and dAtRal remain in solubilized form and the relative quantum yields of singlet oxygen photosensitized by AtRal and dAtRal are the same as in benzene.
Assuming that AtRal/dAtRal remain in solubilized form and the relative quantum yields of singlet oxygen photosensitized by AtRal and dAtRal are the same as in benzene when they are delivered to ARPE-19 cells, the difference between reductive activity of ARPE-19 cells maintained in dark and cells exposed to visible light during incubation with AtRal photodegraded for up to 120 min was plotted against the calculated yields of singlet oxygen photosensitized by the visible light from the light source. There was a positive correlation between the calculated yield of singlet oxygen photosensitized by AtRal/photodegraded AtRal and an increase in inhibitory effect on reductive activities of ARPE-19 cells suggesting that singlet oxygen can play an important role in increasing the inhibitory effect (Fig. 9b). It needs to be noted though that an extrapolation of the results from singlet oxygen photosensitized by AtRal and dAtRal solubilized in nonpolar solvent to experiments with cells need to be treated with caution. The quantum yields of singlet oxygen photosensitized by AtRal vary depending on the local environment (24,28). For example, in nonprotic nonpolar benzene the quantum yield of singlet oxygen generation by AtRal is 0.3 whereas in much more polar and protic methanol it is decreased to 0.05 (24,28). The sub-cellular localization of AtRal and dAtRal after delivery from 0.2% DMSO remains unknown. It is likely that at least some products of AtRal degradation are more hydrophilic than AtRal itself and therefore more likely to diffuse between different sub-cellular compartments or even remain solubilized in the aqueous environment. This different distribution of AtRal and dAtRal can affect their corresponding absorption cross-sections as well as quantum yields of singlet oxygen generation.
DISCUSSION
Susceptibility of AtRal to degradation induced by visible light and photochemical properties of the degradation products
There are numerous studies reporting photodegradation of retinoids, including AtRal, upon exposure to UV light (12,14–16). Our results demonstrate that exposure of AtRal to visible light under aerobic conditions also results in its rapid photodegradation. One of the potential mechanisms responsible for photodegradation of AtRal is its oxidation by singlet oxygen, which can be generated by energy transfer from photoexcited AtRal to molecular oxygen. The quantum yields of photosensitized generation of singlet oxygen by AtRal are the same irrespective of whether AtRal is photoexcited with UV-A or blue light (24) and therefore this pathway can account at least in part for AtRal photodegradation. The susceptibility of AtRal to photodegradation by visible light is important considering that in the adult eye, the crystalline lens filters out almost completely all UV light so only visible light can be responsible for photodegradation of AtRal in the normal adult human retina (29).
Our results show that photodegradation of AtRal with visible light results in accumulation of products absorbing shorter wavelength light than AtRal with absorption maximum at about 320–340 nm but still extending their absorption into the violet-blue range of the visible spectrum. Interestingly, the mixture of AtRal and its degradation products exhibits almost the same quantum yields of singlet oxygen generation as AtRal both when excited with UV-A (355 nm) or blue (422 nm) light, suggesting that the degradation products of AtRal can be important contributors to photosensitized damage in the retina in vivo particularly in young children or in animals like rodents whose lenses transmit UV light (29–32).
Cytotoxic effects of AtRal and its degradation products
Our results demonstrate that AtRal and dAtRal exert cytotoxic effects on cultured ARPE-19 cells involving a delayed type of cell death. Immediately and 2 h after exposure, AtRal or dAtRal do not substantially affect integrity of the plasma membrane, but cell morphology changes gradually with condensation of nuclear chromatin and shrinkage of nuclei suggesting an apoptotic type of cell death. Both AtRal and dAtRal affect the reductive activity of ARPE-19 cells measured with MTT assay.
The reduction of MTT to formazan is usually ascribed to the activity of mitochondrial enzymes (33). However, some contribution can be caused by activity of oxidoreductases other than those present in mitochondria, such as NADPH oxidase (33,34). It has been shown that exposure of ARPE-19 cells to AtRal results in up-regulation of NADPH oxidase activity (11). Some indication that this may have occurred in our experiments can be seen in Fig. 6 where the concentration of the formazan formed in cells incubated with 12.5 μM AtRal in dark was 9% greater than in control samples; however, the difference was not statistically significant. Higher concentrations of AtRal exerted an inhibitory effect on reductive activity of ARPE-19 cells and this effect was exacerbated upon exposure to visible light.
Our results on AtRal cytotoxicity are in agreement with previous reports on cytotoxic effects of AtRal to cultured RPE cells despite some differences in the experimental conditions (6,9). Maeda and colleagues demonstrated that 16 h incubation of ARPE-19 cells with 30 μM AtRal results in an inhibition of reductive activity measured by MTT assay by more than 90% both in dark and after exposure to blue light (9). AtRal caused an increase in the cytoplasmic calcium, activation of caspase and activation of Bax-dependent apoptosis. Wielgus and colleagues tested on ARPE-19 cells the effects of incubation for up to 24 h with 20–60 μM AtRal (6). AtRal caused an incubation time- and dose-dependent inhibition of reductive activity, and an increase in leakage of lactate dehydrogenase. Already 3 h exposure in dark to 20 μM AtRal induced significant cytotoxic effects, whereas 40 μM AtRal led to >90% decrease in reductive activity and release of lactate dehydrogenase similar to that of lysed cells. These effects were exacerbated by exposure to visible light. In all these experiments, the cytotoxic concentrations of AtRal were equivalent to only a small fraction of AtRal which can be released from visual pigments upon photoexcitation (1–3).
Interestingly, our results demonstrate that the cytotoxicity of degraded AtRal is even greater than of AtRal. One possible explanation is that degradation of AtRal leads to generation of aldehydes and epoxides with reactivities comparable to AtRal but more hydrophilic and therefore able to diffuse more freely to different cellular compartments. Moreover, unlike AtRal which can act as an efficient antioxidant, its degradation products may no longer exhibit similar antioxidant properties (35–37).
A considerable research effort has been devoted to identify products of oxidation of a pirydynium bisretinoid called A2E (38–46). Most of the identified molecules are hydrophobic and therefore sequestered within the lipofuscin granules. For example, A2E remains in the granule despite treatments with proteinase K and SDS, and thus is unlikely to cause damage in cellular compartments other than the lipofuscin granule (44,47). Except for the methylglyoxal, all other small cleavage products of A2E have been largely ignored (43,44). These small molecules are likely to be the same as some of the degradation products of AtRal. Due to their increased hydrophilicity, they are more likely than AtRal to diffuse between cellular compartments while photosensitizing singlet oxygen formation and exerting other deleterious effects, such as binding to proteins affecting their structure and function. Therefore, the degradation products of AtRal appear to be the ones that deserve to be identified and their photochemical and cytotoxic properties investigated.
In particular, it would be of great interest to determine whether or not the aldehydic products derived from AtRal can bind to complement factor H (CFH). It has been recently shown that CFH is a major protein binding malondialdehyde (MDA), a small aldehyde derived from peroxidation of lipids, and this way protecting from its deleterious effects (48). Interestingly, the CFH polymorphism H402, which is strongly associated with a greater risk of developing age-related macular degeneration (AMD), substantially reduces the ability of CFH to bind MDA.
Cytotoxic effects of degradation products of AtRal can provide an alternative explanation of results in other studies. Shiose and colleagues exposed Y79 cells (derived from human retinoblastoma cells) first to all-trans–retinal and then to 365 nm UV light in order to completely degrade AtRal (12). Supernatants obtained from damaged Y79 cells promoted apoptosis in ARPE-19 cells, induced up-regulation of NF-κB activity in both ARPE-19 cells and HEK293 cells transfected with human TLR3, as well as up-regulation of IRF3. These effects were not observed in the absence of TLR3 suggesting that TLR3 was orchestrating all these downstream events. Up-regulation of NF-κB and IRF3 were decreased in cells treated with nucleases leading to a suggestion that RNAs may be the ligands which activate TLR3 (12). While double-stranded RNA is a typical ligand for TLR3, it cannot be excluded that degradation products of AtRal can bind and activate TLR3. The inhibitory effect of nucleases may be due to scavenging of aldehydic products of AtRal degradation by amine groups of nucleobases.
Can degradation of AtRal explain the maximum in UV in the action spectra of light-induced damage to the retina?
Importantly, our results suggest an explanation for the wavelength dependence observed in the action spectra for retinal photodamage recorded on aphakic primates and rodents showing an increase in susceptibility to light-induced damage with decreasing wavelength down to 325 and 320 nm, respectively (3,17,18). Based on the changes in absorption spectra during photodegradation of AtRal and the photosensitizing properties of the degradation products, it can be expected that during photoexcitation with 325 nm light AtRal undergoes photodegradation and, while its degradation products, with absorption maximum close to 325 nm accumulate, both AtRal and its degradation products can act as photosensitizers. However, photoexcitation of AtRal with 380 nm or violet/blue light can lead to rapid degradation of AtRal so no chromophores are left to absorb that light and cause retinal photodamage.
It can be suggested that in the retina in vivo the photosensitizing effects of all-trans-retinal and its degradation products will be damaging mostly to structures where these compounds accumulate and upon photoexcitation can produce reactive oxygen species and degradation products—photoreceptors. Indeed, studies on animals demonstrate that photoreceptors are the primary site of damage induced by 380 nm light (49). RPE cells become the primary site of photodamage for irradiations with wavelengths >440 nm. The dose of 470 nm light which is required to induce threshold damage in the retina is ~3 orders of magnitude greater than for 380 nm light (11,49). Due to much smaller absorption coefficients of AtRal above 440 nm in comparison to 380 nm, it can be suggested that direct photosensitized damage induced by AtRal and damaging RPE is unlikely. However 470 nm light is effectively absorbed by rhodopsin (extinction coefficient for 470 nm is smaller only by a factor of ~0.8 in comparison to that at the rhodopsin maximum at 500 nm), and therefore it can be expected that during exposure to 470 nm light, photoexcitations of rhodopsins result in considerable fluxes of all-trans-retinals released from photobleached visual pigments. Some of accumulated all-trans-retinal may diffuse out of the photoreceptors to the RPE, where it can activate NADPH oxidase and TLR-3, which in turn, increase oxidative stress, lead to apoptosis and inflammatory response (5,7–13).
CONCLUSION
In conclusion, AtRal is susceptible to degradation by visible light and the degradation products of AtRal are more cytotoxic than AtRal itself. This warrants further investigation of the degradation products, including the identification of their chemical structures, presence in the retina, metabolism, and their effects on retinal function.
AtRal degradation products exhibit similar quantum yields of singlet oxygen generation but their absorption is shifted towards shorter wavelengths in comparison with AtRal. This may explain the action spectra of retinal photodamage observed in animals. Degraded AtRal may play the major role in photosensitized damage in retinas exposed to UV light such as in young children or rodents.
Acknowledgements
This work has been supported by the National Eye Research Centre (NERC), the Wellcome Trust, UK; NIH grant EY019688 (MB), and the Ministry of Science and Higher Education, Poland.
Footnotes
This invited paper is part of the Symposium in Print “Light-Induced Damage to the Retina.”
REFERENCES
- 1.Rozanowska M, Sarna T. Light-induced damage to the retina: Role of rhodopsin chromophore revisited. Photochem. Photobiol. 2005;81:1305–1330. doi: 10.1562/2004-11-13-IR-371. [DOI] [PubMed] [Google Scholar]
- 2.Rozanowska M, Rozanowski B. Visual transduction and age-related changes in lipofuscin. In: Tombran-Tink J, Barnstable CJ, editors. Ophthalmology Research: The Visual Transduction Cascade. The Humana Press Inc.; Totowa, NJ: 2008. pp. 405–446. [Google Scholar]
- 3.Różanowska M, Różanowski B, Boulton M. Photobiology of the retina: Light damage to the retina. In: Smith KC, editor. Photobiological Sciences Online. American Society for Photobiology; [Accessed 12 February 2012]. 2009. Available at: http://www.photobiology.info. [Google Scholar]
- 4.Strauss O. The retinal pigment epithelium in visual function. Physiol. Rev. 2005;85:845–881. doi: 10.1152/physrev.00021.2004. [DOI] [PubMed] [Google Scholar]
- 5.Maeda T, Maeda A, Golczak M. Retinal photodamage mediated by all-trans-retinal. invited review. Photochem. Photobiol. 2012 doi: 10.1111/j.1751-1097.2012.01143.x. doi:10.1111/j.1751-1097.2012.01143x.x. [DOI] [PMC free article] [PubMed] [Google Scholar]
- 6.Wielgus AR, Chignell CF, Ceger P, Roberts JE. Comparison of A2E cytotoxicity and phototoxicity with all-trans-retinal in human retinal pigment epithelial cells. Photochem. Photobiol. 2010;86:781–791. doi: 10.1111/j.1751-1097.2010.00750.x. [DOI] [PMC free article] [PubMed] [Google Scholar]
- 7.Maeda A, Maeda T, Golczak M, Palczewski K. Retinopathy in mice induced by disrupted all-trans-retinal clearance. J. Biol. Chem. 2008;283:26684–26693. doi: 10.1074/jbc.M804505200. [DOI] [PMC free article] [PubMed] [Google Scholar]
- 8.Maeda A, Golczak M, Maeda T, Palczewski K. Limited roles of Rdh8, Rdh12, and Abca4 in all-trans-retinal clearance in mouse retina. Invest. Ophthalmol. Vis. Sci. 2009;50:5435–5443. doi: 10.1167/iovs.09-3944. [DOI] [PMC free article] [PubMed] [Google Scholar]
- 9.Maeda A, Maeda T, Golczak M, Chou S, Desai A, Hoppel CL, Matsuyama S, Palczewski K. Involvement of all-trans-retinal in acute light-induced retinopathy of mice. J. Biol. Chem. 2009;284:15173–15183. doi: 10.1074/jbc.M900322200. [DOI] [PMC free article] [PubMed] [Google Scholar]
- 10.Maeda T, Maeda A, Matosky M, Okano K, Roos S, Tang J, Palczewski K. Evaluation of potential therapies for a mouse model of human age-related macular degeneration caused by delayed all-trans-retinal clearance. Invest. Ophthalmol. Vis. Sci. 2009;50:4917–4925. doi: 10.1167/iovs.09-3581. [DOI] [PMC free article] [PubMed] [Google Scholar]
- 11.Chen Y, Okano K, Maeda T, Chauhan V, Golczak M, Maeda A, Palczewski K. Mechanism of all-trans-retinal toxicity: Implications for Stargardt’s disease and age-related macular degeneration. J. Biol. Chem. 2012;287:5059–5069. doi: 10.1074/jbc.M111.315432. [DOI] [PMC free article] [PubMed] [Google Scholar]
- 12.Shiose S, Chen Y, Okano K, Roy S, Kohno H, Tang J, Pearlman E, Maeda T, Palczewski K, Maeda A. Toll-like receptor 3 is required for development of retinopathy caused by impaired all-trans-retinal clearance in mice. J. Biol. Chem. 2011;286:15543–15555. doi: 10.1074/jbc.M111.228551. [DOI] [PMC free article] [PubMed] [Google Scholar]
- 13.Maeda A, Golczak M, Chen Y, Okano K, Kohno H, Shiose S, Ishikawa K, Harte W, Palczewska G, Maeda T, Palczewski K. Primary amines protect against retinal degeneration in mouse models of retinopathies. Nat. Chem. Biol. 2012;8:170–178. doi: 10.1038/nchembio.759. [DOI] [PMC free article] [PubMed] [Google Scholar]
- 14.Fu PP, Xia Q, Yin JJ, Cherng SH, Yan J, Mei N, Chen T, Boudreau MD, Howard PC, Wamer WG. Photodecomposition of vitamin A and photobiological implications for the skin. Photochem. Photobiol. 2007;83:409–424. doi: 10.1562/2006-10-23-IR-1065. [DOI] [PubMed] [Google Scholar]
- 15.Yin JJ, Xia Q, Fu PP. UVA photoirradiation of anhydroretinol – Formation of singlet oxygen and superoxide. Toxicol. Ind. Health. 2007;23:625–631. doi: 10.1177/0748233708090909. [DOI] [PubMed] [Google Scholar]
- 16.Baron MH, Coulange MJ, Coupry C, Baron D, Favrot J, Aboaly MM. All-trans retinal photoisomerization and photooxidation from UV laser radiation. Vibrational assignments of all-trans 5,8-peroxyretinal. Photochem. Photobiol. 1989;49:739–751. [Google Scholar]
- 17.van Norren D, Gorgels TGMF. The action spectrum of photochemical damage to the retina: A review of monochromatic threshold data. Photochem. Photobiol. 2011;87:747–753. doi: 10.1111/j.1751-1097.2011.00921.x. [DOI] [PubMed] [Google Scholar]
- 18.Ham WT, Mueller HA, Ruffolo JJ, Guerry D, Guerry RK. Action spectrum for retinal injury from nearultraviolet radiation in the aphakic monkey. Am. J. Ophthalmol. 1982;93:299–306. doi: 10.1016/0002-9394(82)90529-3. [DOI] [PubMed] [Google Scholar]
- 19.Dunn KC, Aotaki-Keen AE, Putkey FR, Hjelmeland LM. ARPE-19, a human retinal pigment epithelial cell line with differentiated properties. Exp. Eye Res. 1996;62:155–169. doi: 10.1006/exer.1996.0020. [DOI] [PubMed] [Google Scholar]
- 20.Zareba M, Raciti MW, Henry MM, Sarna T, Burke JM. Oxidative stress in ARPE-19 cultures: Do melanosomes confer cytoprotection? Free Radic. Biol. Med. 2006;40:87–100. doi: 10.1016/j.freeradbiomed.2005.08.015. [DOI] [PubMed] [Google Scholar]
- 21.Grzelak A, Rychlik B, Bartosz G. Light-dependent generation of reactive oxygen species in cell culture media. Free Radic. Biol. Med. 2001;30:1418–1425. doi: 10.1016/s0891-5849(01)00545-7. [DOI] [PubMed] [Google Scholar]
- 22.Mosmann T. Rapid colorimetric assay for cellular growth and survival: Application to proliferation and cytotoxicity assays. J. Immunol. Methods. 1983;65:55–63. doi: 10.1016/0022-1759(83)90303-4. [DOI] [PubMed] [Google Scholar]
- 23.Rozanowski B, Cuenco J, Davies S, Shamsi FA, Zadlo A, Dayhaw-Barker P, Rozanowska M, Sarna T, Boulton ME. The phototoxicity of aged human retinal melanosomes. Photochem. Photobiol. 2008;84:650–657. doi: 10.1111/j.1751-1097.2007.00259.x. [DOI] [PubMed] [Google Scholar]
- 24.Rozanowska M, Wessels J, Boulton M, Burke JM, Rodgers MA, Truscott TG, Sarna T. Blue light-induced singlet oxygen generation by retinal lipofuscin in non-polar media. Free Radic. Biol. Med. 1998;24:1107–1112. doi: 10.1016/s0891-5849(97)00395-x. [DOI] [PubMed] [Google Scholar]
- 25.Vakrat-Haglili Y, Weiner L, Brumfeld V, Brandis A, Salomon Y, McLlroy B, Wilson BC, Pawlak A, Rozanowska M, Sarna T, Scherz A. The microenvironment effect on the generation of reactive oxygen species by Pd-bacteriopheophorbide. J. Am. Chem. Soc. 2005;127:6487–6497. doi: 10.1021/ja046210j. [DOI] [PubMed] [Google Scholar]
- 26.Haralampus-Grynaviski N, Ransom C, Ye T, Rozanowska M, Wrona M, Sarna T, Simon JD. Photogeneration and quenching of reactive oxygen species by urocanic acid. J. Am. Chem. Soc. 2002;124:3461–3468. doi: 10.1021/ja016902x. [DOI] [PubMed] [Google Scholar]
- 27.Yuzawa T, Hamaguchi H. Investigation of the photoisomerization of all-trans-retinal by singular-value-decomposition analysis of nanosecond time-resolved infrared spectra. J. Mol. Struct. 1995;352-3:489–495. [Google Scholar]
- 28.Dillon J, Gaillard ER, Bilski P, Chignell CF, Reszka KJ. The photochemistry of the retinoids as studied by steady-state and pulsed methods. Photochem. Photobiol. 1996;63:680–685. doi: 10.1111/j.1751-1097.1996.tb05673.x. [DOI] [PubMed] [Google Scholar]
- 29.Boettner EA, Wolter JR. Transmission of the ocular media. Invest. Ophthalmol. 1962;1:776–783. [Google Scholar]
- 30.Dillon J, Zheng L, Merriam JC, Gaillard ER. Transmission spectra of light to the mammalian retina. Photochem. Photobiol. 2000;71:225–229. doi: 10.1562/0031-8655(2000)071<0225:tsoltt>2.0.co;2. [DOI] [PubMed] [Google Scholar]
- 31.Gaillard ER, Zheng L, Merriam JC, Dillon J. Age-related changes in the absorption characteristics of the primate lens. Invest. Ophthalmol. Vis. Sci. 2000;41:1454–1459. [PubMed] [Google Scholar]
- 32.Dillon J, Zheng L, Merriam JC, Gaillard ER. Transmission of light to the aging human retina: Possible implications for age related macular degeneration. Exp. Eye Res. 2004;79:753–759. doi: 10.1016/j.exer.2004.06.025. [DOI] [PubMed] [Google Scholar]
- 33.Bernas T, Dobrucki J. Mitochondrial and nonmitochondrial reduction of MTT: Interaction of MTT with TMRE, JC-1, and NAO mitochondrial fluorescent probes. Cytometry. 2002;47:236–242. doi: 10.1002/cyto.10080. [DOI] [PubMed] [Google Scholar]
- 34.Bernas T, Dobrucki JW. The role of plasma membrane in bioreduction of two tetrazolium salts, MTT, and CTC. Arch. Biochem. Biophys. 2000;380:108–116. doi: 10.1006/abbi.2000.1907. [DOI] [PubMed] [Google Scholar]
- 35.Rozanowska M, Cantrell A, Edge R, Land EJ, Sarna T, Truscott TG. Pulse radiolysis study of the interaction of retinoids with peroxyl radicals. Free Radic. Biol. Med. 2005;39:1399–1405. doi: 10.1016/j.freeradbiomed.2005.07.018. [DOI] [PubMed] [Google Scholar]
- 36.Livrea MA, Tesoriere L, Freisleben H-J. Vitamin A as an antioxidant. In: Cadenas E, Packer L, editors. Handbook of Antioxidants. Dekker; New York: 1996. pp. 371–405. [Google Scholar]
- 37.Palace VP, Khaper N, Qin Q, Singal PK. Antioxidant potentials of vitamin A and carotenoids and their relevance to heart disease. Free Radic. Biol. Med. 1999;26:746–761. doi: 10.1016/s0891-5849(98)00266-4. [DOI] [PubMed] [Google Scholar]
- 38.Murdaugh LS, Avalle LB, Mandal S, Dill AE, Dillon J, Simon JD, Gaillard ER. Compositional studies of human RPE lipofuscin. J. Mass Spectrom. 2010;45:1139–1147. doi: 10.1002/jms.1795. [DOI] [PubMed] [Google Scholar]
- 39.Murdaugh LS, Mandal S, Dill AE, Dillon J, Simon JD, Gaillard ER. Compositional studies of human RPE lipofuscin: Mechanisms of molecular modifications. J. Mass Spectrom. 2011;46:90–95. doi: 10.1002/jms.1865. [DOI] [PubMed] [Google Scholar]
- 40.Avalle LB, Wang Z, Dillon JP, Gaillard ER. Observation of A2E oxidation products in human retinal lipofuscin. Exp. Eye Res. 2004;78:895–898. doi: 10.1016/j.exer.2003.10.023. [DOI] [PubMed] [Google Scholar]
- 41.Dillon J, Wang Z, Avalle LB, Gaillard ER. The photochemical oxidation of A2E results in the formation of a 5,8,5′,8′-bis-furanoid oxide. Exp. Eye Res. 2004;79:537–542. doi: 10.1016/j.exer.2004.06.024. [DOI] [PubMed] [Google Scholar]
- 42.Gaillard ER, Avalle LB, Keller LMM, Wang Z, Reszka KJ, Dillon JP. A mechanistic study of the photooxidation of A2E, a component of human retinal lipofuscin. Exp. Eye Res. 2004;79:313–319. doi: 10.1016/j.exer.2004.05.005. [DOI] [PubMed] [Google Scholar]
- 43.Wang Z, Keller LMM, Dillon J, Gaillard ER. Oxidation of A2E results in the formation of highly reactive aldehydes and ketones. Photochem. Photobiol. 2006;82:1251–1257. doi: 10.1562/2006-04-01-RA-864. [DOI] [PubMed] [Google Scholar]
- 44.Wu Y, Yanase E, Feng X, Siegel MM, Sparrow JR. Structural characterization of bisretinoid A2E photocleavage products and implications for age-related macular degeneration. Proc. Natl Acad. Sci. USA. 2010;107:7275–7280. doi: 10.1073/pnas.0913112107. [DOI] [PMC free article] [PubMed] [Google Scholar]
- 45.Yoon KD, Yamamoto K, Zhou J, Sparrow JR. Photo-products of retinal pigment epithelial bisretinoids react with cellular thiols. Mol. Vis. 2011;17:1839–1849. [PMC free article] [PubMed] [Google Scholar]
- 46.Sparrow JR. Bisretinoids of RPE lipofuscin: Trigger for complement activation in age-related macular degeneration. Adv. Exp. Med. Biol. 2010;703:63–74. doi: 10.1007/978-1-4419-5635-4_5. [DOI] [PubMed] [Google Scholar]
- 47.Ng KP, Gugiu B, Renganathan K, Davies MW, Gu X, Crabb JS, Kim SR, Rozanowska MB, Bonilha VL, Rayborn ME, Salomon RG, Sparrow JR, Boulton ME, Hollyfield JG, Crabb JW. Retinal pigment epithelium lipofuscin proteomics. Mol. Cell. Proteomics. 2008;7:1397–1405. doi: 10.1074/mcp.M700525-MCP200. [DOI] [PMC free article] [PubMed] [Google Scholar]
- 48.Weismann D, Hartvigsen K, Lauer N, Bennett KL, Scholl HP, Charbel Issa P, Cano M, Brandstatter H, Tsimikas S, Skerka C, Superti-Furga G, Handa JT, Zipfel PF, Witztum JL, Binder CJ. Complement factor H binds malondialdehyde epitopes and protects from oxidative stress. Nature. 2011;478:76–81. doi: 10.1038/nature10449. [DOI] [PMC free article] [PubMed] [Google Scholar]
- 49.Busch EM, Gorgels TG, van Norren D. Temporal sequence of changes in rat retina after UV-A and blue light exposure. Vision. Res. 1999;39:1233–1247. doi: 10.1016/s0042-6989(98)00233-8. [DOI] [PubMed] [Google Scholar]