Abstract
Digital phantoms continue to play a significant role in modeling and characterizing medical imaging. The currently available XCAT phantom incorporates both the flexibility of mathematical phantoms and the realistic nature of voxelized phantoms. This phantom generates images based on a regular breathing pattern and can include arbitrary lung tumor trajectories. In this work, we present an algorithm that modifies the current XCAT phantom to generate 4D imaging data based on irregular breathing. First, a parameter is added to the existing XCAT phantom to include any arbitrary tumor motion. This modification introduces the desired tumor motion but, comes at the cost of decoupled diaphragm, chest wall and lung motion. To remedy this problem diaphragm and chest wall motion is first modified based on initial tumor location and then input to the XCAT phantom. This generates a phantom with synchronized respiratory motion. Mapping of tumor motion trajectories to diaphragm and chest wall motion is done by adaptively calculating a scale factor based on tumor to lung contour distance. The distance is calculated by projecting the initial tumor location to lung edge contours characterized by quadratic polynomials. Data from 10 patients were used to evaluate the accuracy between actual independent tumor location and the location obtained from the modified XCAT phantom. The rmse and standard deviations for 10 patients in x, y, and z directions are: (0.29 ± 0.04, 0.54 ± 0.17, and 0.39 ± 0.06) mm. To demonstrate the utility of the phantom, we use the new phantom to simulate a 4DCT acquisition as well as a recently published method for phase sorting. The modified XCAT phantom can be used to generate more realistic imaging data for enhanced testing of algorithms for CT reconstruction, tumor tracking, and dose reconstruction.
1. Introduction
Respiratory motion is a key variable which influences imaging, simulation and treatment aspects of radiotherapy of the thorax and abdomen (Vedam et al. 2003, Ford et al. 2003, Chen et al. 2004, Keall et al. 2006, Jiang 2006). Correctly modeling respiratory motion and its subsequent relation to different organs is critical for planning and delivery of an accurate, precise and conformal dose distribution. Therefore, a digital or voxel-based phantom should be a realistic representation of human anatomy as well as of physiological functions.
The current generation of computerized phantoms can be broadly divided into three categories: a) Mathematical phantoms (Pretorius et al. 1999, Zhu et al. 2005, Hu & Zhu 2010) b) Voxelized phantoms (Zubal et al. 1994, Caon 2004, Kramer et al. 2006) and c) Hybrid phantoms (Segars 2001, Segars et al. 2008, Segars et al. 2010). Mathematical phantoms use a set of geometric primitives e.g., B-splines (Piegl & Tiller 1997, Segars et al. 1999) or ”superquadrics” (FORBILD 2003, Zhu et al. 2005), to represent shapes of different organs. Because of their well-defined mathematical nature, these shapes can be easily manipulated to generate images for different resolutions and patient motions. These models, despite their flexibilities, are limited by the inherent simplistic nature of geometric primitives used to describe organs. Tomographic phantoms are a three-dimensional matrix of voxels which are assigned different numbers based on organ locations (Zubal et al. 1994, Kramer et al. 2006). Voxel based models rely on the acquisition of a suitable set of images and segmentation of organs in an anatomically correct fashion. These phantoms are realistic as they are based on point data but are prone to approximation errors when images for different resolutions are generated. Hybrid phantoms as the name suggests, exploit the inherent advantages offered by both tomographic as well as mathematical phantom. Hybrid models are based on actual data as well as mathematical primitives to represent organ surfaces. They provide the middle ground between the realism of tomographic phantoms and the flexibility of mathematical phantoms.
The non-uniform rational B-spline (NURBS) based 4D eXtended CArdiac-Torso (XCAT) phantom is one of the most flexible and realistic hybrid digital phantoms being used in the research community. This XCAT phantom uses data from the Visible Human Project to generate image data and respiratory mechanics for modeling respiratory motion (Segars et al. 2001). In this model the superior-inferior (SI) motion of diaphragm and the anterior-posterior (AP) motion of the chest controls the respiratory motion in the phantom. The XCAT phantom is limited by the lack of more realistic irregular breathing patterns which would make it better suited to test algorithms for CT reconstruction, tumor tracking, and dose reconstruction.
In this work ‡ we modify the standard XCAT phantom to incorporate recorded individual patient data of internal tumor motion for generating images. We also develop an algorithm that maps the independently defined tumor motion to the diaphragm and the chest wall motion. The tumor motion is independent in the sense that unlike previous versions of the XCAT phantom, the modified phantom allows direct input of the tumor motion. The challenge is to map the tumor trajectories to chest wall and diaphragm motion, the two parameters that govern respiratory motion in XCAT phantom. This algorithm also automatically calculates the average breathing period of the respiratory cycles based on the given tumor motion data. These synchronized variables are used to generate final imaging data based on an arbitrary irregular breathing pattern.
To demonstrate the realistic nature of the modified XCAT phantom a methodology is developed which mimics real clinical 4D CT data generation. This is accomplished by appropriately sampling the breathing trace to capture data corresponding to different couch positions interrupted briefly by idle time. The 4D CT data thus obtained is then sorted by an internal anatomical features-based phase sorting algorithm (Li et al. 2009). These applications show a possible use of the modified XCAT phantom for conducting imaging research.
2. Materials and methods
2.1. The XCAT Model
In the XCAT phantom, different organ surfaces are modeled using NURBS primitives. These NURBS surfaces provide a realistic model as they are fitted to actual patient data from the 3D Visible Human Male and Female datasets from the National Library of Medicine (The Visible Human Project 1986). NURBS surfaces are characterized by a set of control points of smaller surface segments and associated B-spline basis functions. Since these basis functions are continuous in nature, they can be manipulated via control points using a suitable transformation function to generate images with other resolutions, anatomical variations and patient motions.
The XCAT phantom uses a model for respiratory mechanics involving motion of diaphragm, liver, stomach, spleen, thoracic cage and lungs (Segars et al. 2001). This model assumes that lung motion in the AP direction is correlated with rib-cage motion, and motion in SI direction is correlated with diaphragm motion. Rib-cage motion is translated to lungs surfaces via a set of control points. The equations governing the change of diaphragm height in SI direction and the expansion of chest in AP direction are as follows (Segars 2001):
| (1) |
| (2) |
The diaphragm height was assumed to change a maximum of 2 cm sinusoidally for normal tidal breathing as in eq. 1. AP expansion in the phantom is dictated by eq. 2. The value N for AP motion was set to 1.2 cm which was calculated by trial and error to obtain a desired lung volume (Segars 2001). For both these equations the start was set at end-expiration i.e., t = 0 of breathing cycle. These equations assume that inspiration accounts for 40% breathing cycle and expiration for the remaining 60%.
The current phantom has only diaphragm and chest wall motions, with no direct input for tumor motion. In this work, the phantom has been modified to directly include an independent tumor motion-curve. The independent tumor motion is based on measured data which is described in section 2.6. Since the respiratory motion is governed by chest wall and diaphragm motion, a method is needed that converts a given arbitrary tumor motion to the these two variables. In the following section we describe an algorithm that allows the inclusion of independent tumor motion while maintaining realistic respiratory motion.
2.2. Parameterizing lung contours
The first step towards adapting diaphragm motion and and chest wall motion to a measured tumor motion is to find a mathematical tool for a parametric description of lungs contours. The parametric description is then used to find a scale factor (section 2.3) that can be used to convert tumor motion to discrete diaphragm and chest wall motion.
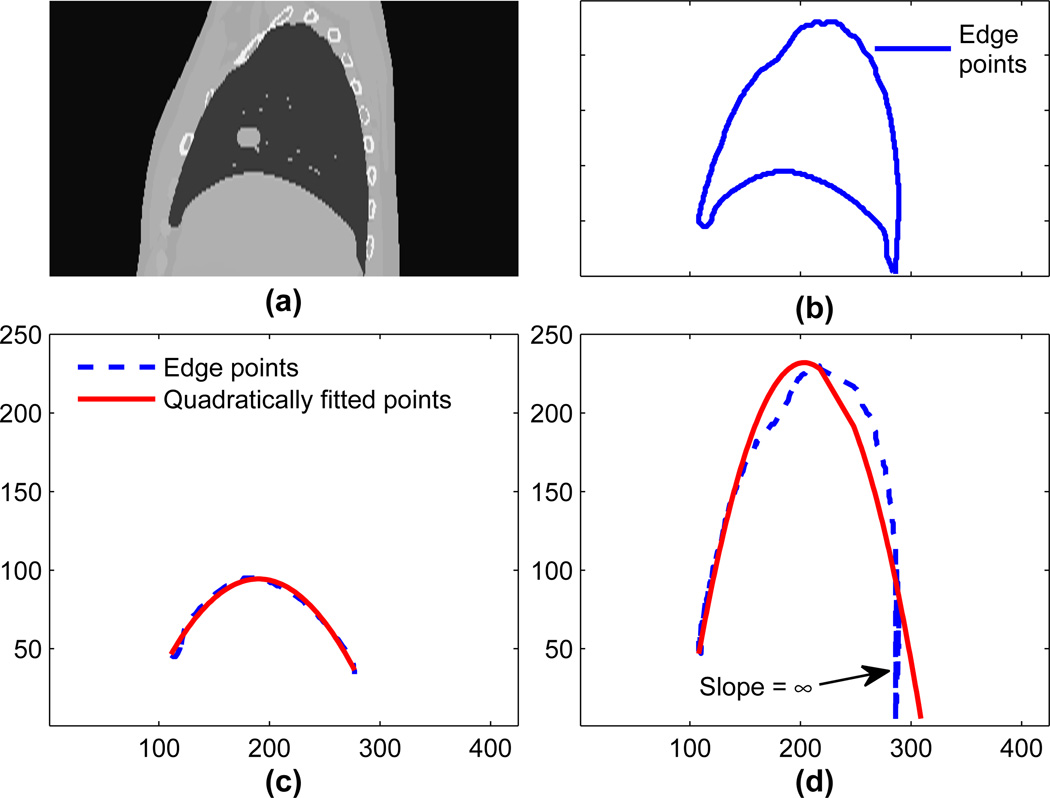
Parameterizing lung contours is a two step process. First, lower and upper edges are extracted, then these edges are fitted with polynomials. Edges are extracted using canny edge detection (edge points can also be extracted from the NURBS surfaces). The lung contour, as shown in figure 2(b), is extracted by canny edge detection with a Gaussian filter of standard deviation 1 pixel followed by lower and upper threshold values of 0.4 and 0.9. Similarly for extracting an upper edge, as shown by the broken line in figure 2(d), a Gaussian filter with a standard deviation of 0.75 pixel followed by upper and lower threshold values of 0.5 and 0.9 is used. The higher threshold value is first used to eliminate superfluous edges and determine prominent edges. The lower threshold value is then used to connect the prominent edges. The lower edge was calculated by subtracting the upper edge from the lung contour, shown by the broken line in figure 2(c).
Figure 2.
(a) A sagittal slice obtained from XCAT phantom. (b) Lung contours extracted using Canny edge detector. (c) Sampled points and quadratically fitted points for the lower edge of the right. (d) Sampled points and quadratically fitted points for the right lung.
Lung edges were approximated using polynomials of degree 2, 3 and 4. To choose the degree of the polynomial, correlation coefficients between original edge points and approximated edge points are used as a similarity metric. As the degree of polynomial increases there is only a marginal gain in approximation accuracy §. This marginal improvement comes with an added cost of over-fitting (Mendenhall & Sincich 2006). Therefore, we employ quadratic fitting for subsequent simulations.
Based on quadratic fitting, original extracted edge points and approximated edges are shown in figure 2. In figure 2(a) a sagittal slice obtained from the original phantom is shown followed by a lung contour extracted using the Canny edge detection in figure 2(b). In figure 2(c) and figure 2(d) lower edges and upper edges along with the quadratically fitted points in solids are shown. In figure 2(d) different edge points sometimes have equal values, thus introducing singularities for polynomial approximation. These points are the part of the curve where the slope of the edge is ∞ as pointed out in figure 2(d). As a result, predicted points deviate from the expected values. After fitting edges to a quadratic polynomial, the scaling factor is calculated as described in the next section. Based on the scaling factor the XCAT phantom is modified using the dataset described in section 2.6.
2.3. Synchronizing the modified XCAT phantom
In the current XCAT phantom, tumor motion is governed by diaphragm and rib-cage motion. The distance of tumor from both the chest wall and diaphragm dictates the impact of these two factors on tumor motion. In the XCAT phantom to include tumor-motion, 3D co-ordinates over discrete time steps are directly inserted. The ratio to inversely map tumor motion to diaphragm and chest motion is calculated by finding its distance from the lung boundaries. These steps are described as follows:
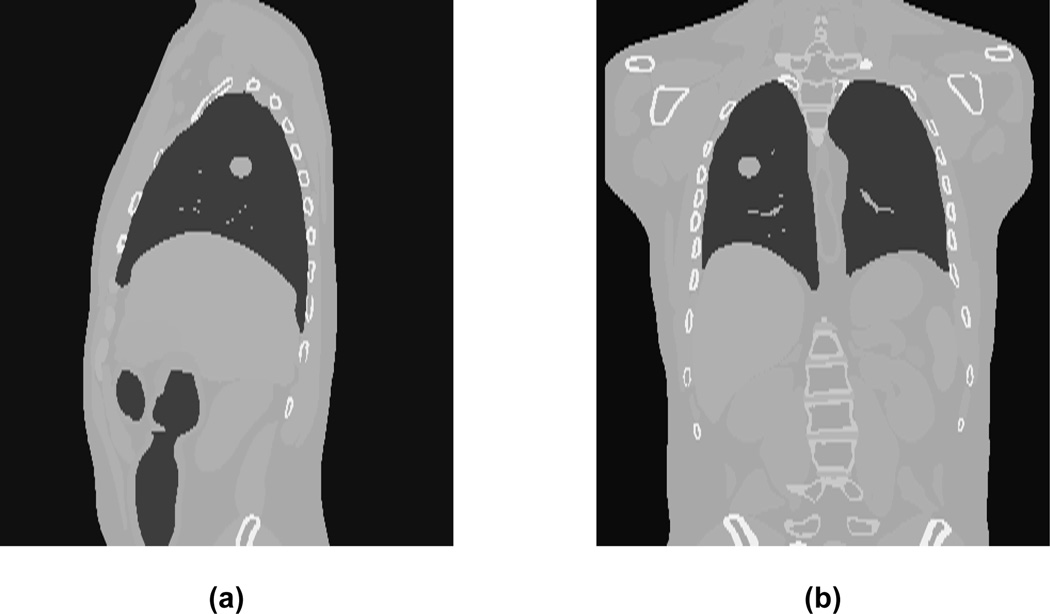
First a sagittal image slice from the phantom containing the tumor specified by the centroid location is generated. A typical example of a phantom slice with the tumor inserted at a given location is shown in figure 1.
Next the lung contour for a given image slice is extracted via canny edge detection (Canny 1986). The lung contour is bifurcated into lower and upper edges as described in section 2.2.
Points from the upper and lower lung edges are used to fit the data to a quadratic polynomial.
- The tumor location is projected to each of the parameterized edges and the closest corresponding points are calculated. Once these points are found a linear ratio based on tumor location is calculated as follows:
where T is tumor location, PU defines the distance between tumor location and its projection in the upper edge; similarly PL defines the distance between tumor location and the lower edge.(3) The linear scaling factor S, for mapping the independent tumor motion to the diaphragm (and chest-wall) motion curve is inversely proportional to R, i.e., . Tumor motion is shifted to the home position of the diaphragm (and chest-wall) and then multiplied by S to obtain the time curves for diaphragm and chest wall motion.
Figure 1.
Reconstructed (a) sagittal and (b) coronal CT slices obtained using digital phantom. The tumor is located in the right lung.
Once scaling factors for diaphragm and chest wall motion are calculated, corresponding parameter files for discrete time locations are generated. These two parameter files, along with tumor location, are used to generate images for synchronized tumor and anatomy motion.
2.4. Generation of realistic 4D CT data
The modified XCAT phantom can be used to simulate the process of acquiring data similar to 4D CT. In this section we describe how 4D CT data is generated from the phantom based on the dataset described in section 2.6. The steps for generating a clinical 4D CT dataset are as follows:
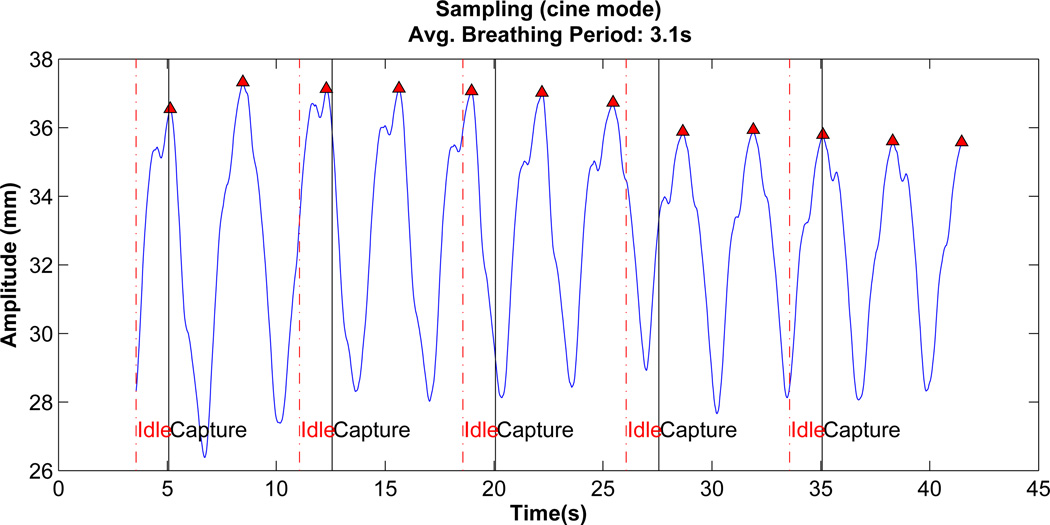
Average breathing period of data: First the local maxima of AP tumor motion data as shown in figure 3 for a given patient is determined. The average time period for breathing cycle is calculated by taking mean time for the first 10 local maxima
Synchronized discrete time motion: After calculating the breathing period, the given tumor motion, diaphragm and chest wall motion is adapted and synchronized as described in section 2.3.
Data acquisition: The modified XCAT is used to mimic 4D CT dataset generation in cine mode. Similar to cine mode, data is acquired at one couch position followed by an idle period of few seconds before data is acquired for the next couch position. For each couch position a total of 11 to 20 samples (phases) over approximately two breathing cycles are generated. To simulate the time needed for moving the couch to the next location, imaging data is generated after a wait of 1.5 secs. This process is illustrated in figure 3.
Figure 3.
Vertical lines represent clinical 4D CT (cine mode) data generation using the modified XCAT. The time period between solid line and broken line represent active data acquisition duration. Broken line to solid line represents time taken to move to next couch position before data is acquired again.
2.5. Sorting simulated 4D CT data
We use a phase sorting technique proposed in (Li et al. 2009), which is based on features characterizing internal anatomy. These features have the advantage that they don’t need an external surrogate signal for sorting.
A brief description of the internal anatomical features (Li et al. 2009) used in the 4D CT phase sorting technique (Lu et al. 2006) is as follows. Four features for characterizing internal respiratory motion based on axial slices are body area, lung area, air content and lung density. Lung area is based on the number of pixels above a given threshold in the lung region, body area is the number of pixels present in body contour. Air content is the summation of pixel values in the lung, lung density is the average value of the pixels in the lung area. To delineate lung and body contour morphological operators are used.
To select among these four features a spatial coherence-based consistency measure of a given feature for all slices at the same couch position is used. Spatial coherence here is the average pairwise correlation coefficient among all the respiratory signals derived for a given feature at a particular couch position.
2.6. Patient Data
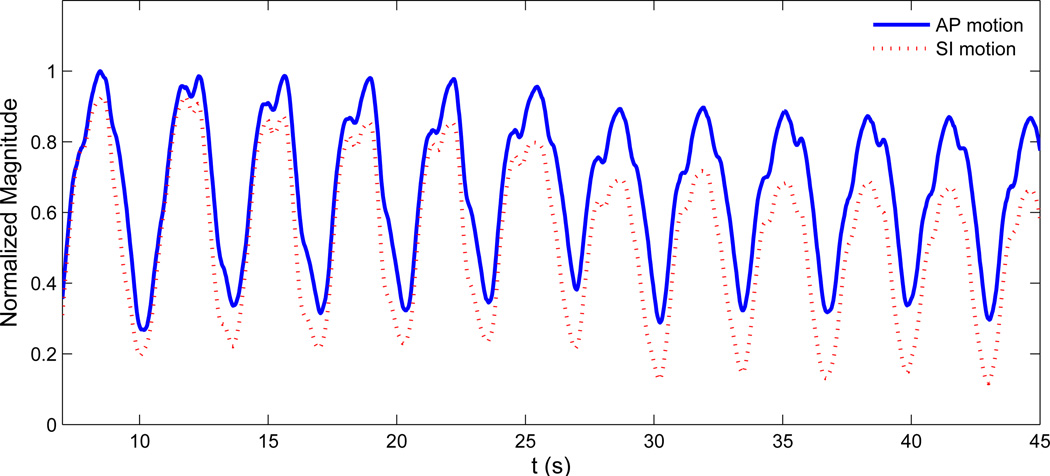
To modify the current digital phantom, patient tumor motion data in AP and SI directions is used. This tumor motion dataset was acquired at the Radiation Oncology clinic at the Nippon Telegraph and Telephone Corporation (NTT) Hospital in Sapporo, Japan which is equipped with Mitsubishi Real-time Radiation (RTRT) system (Berbeco et al. 2005). No breath coaching was used for these patients. Each patient had two to four radiopaque markers implanted in or near the tumor which were tracked with stereoscopic x-ray fluoroscopy. The external surface motion is obtained via monitoring the movement of the patient’s abdominal surface by a laser displacement sensor. The data is obtained by synchronizing the signal from the surface monitor with the signal from the fluoroscopic unit. The data acquisition rate is 30 frames per second. A typical tumor motion curve in AP and SI direction is shown in figure 4. For a detailed discussion interested readers are referred to (Berbeco et al. 2005).
Figure 4.
A typical patient data for SI and AP lung tumor motion. Here normalized magnitude for both SI and AP motion are shown.
3. Results
3.1. Accuracy of tumor motion
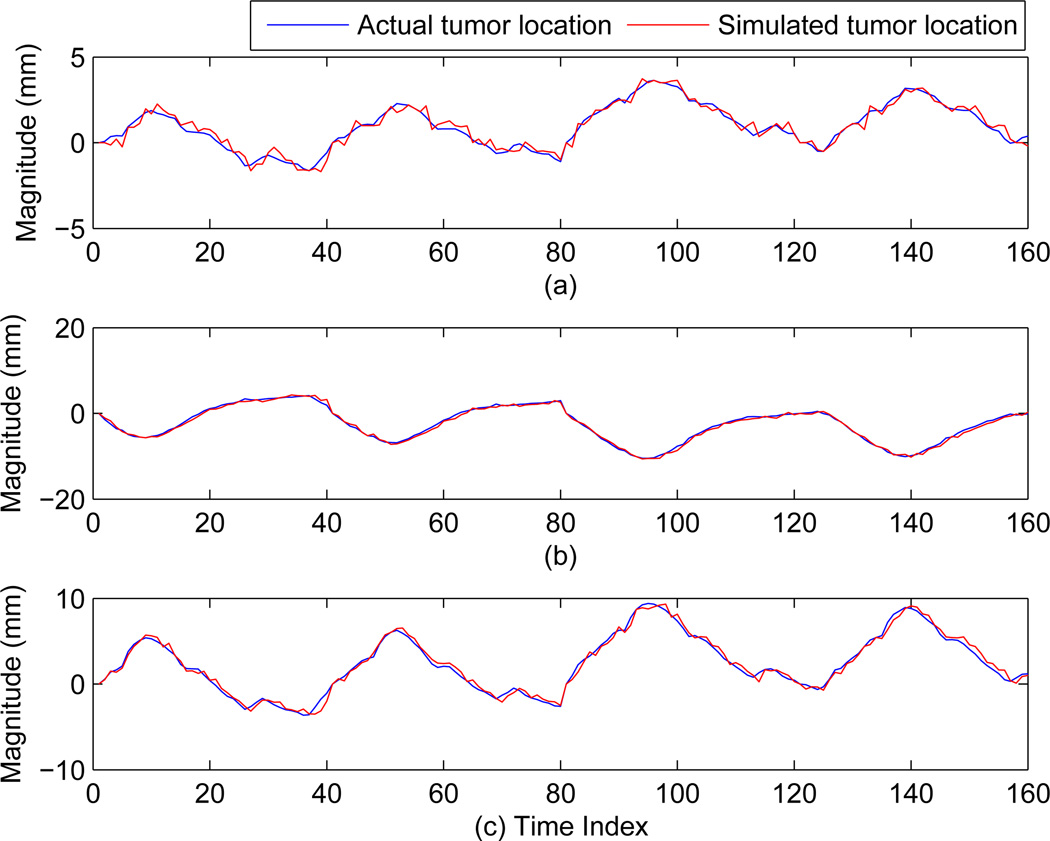
To determine the accuracy between expected tumor location based on independent patient data and the tumor location obtained from the modified XCAT phantom, data from 10 patients were used for evaluation. The tumor location in the data obtained from the modified XCAT phantom is estimated via an automatic centroid calculation based on the tumor contour. The average root-mean-squared-error (rmse) values and their standard deviation over 10 patients in x, y, and z directions (in mm) are: (0.29 ± 0.04, 0.54 ± 0.17, and 0.39 ± 0.06). Here x, y, and z correspond to anterior-posteriror, left-right and superior-inferior directions respectively. These values establish high degree of correspondence between the two. The small difference can be possibly attributed to the automatic detection of tumor location. In figure 5 the actual tumor motion vs. the tumor motion calculated from the modified XCAT tumor for one given patient is shown. The three plots 5(a), 5(b), and 5(c) correspond to the x, y, and z direction of tumor motions. It can be concluded from these plots that the tumor motion from the modified XCAT phantom closely follows the independent tumor motion of the patient.
Figure 5.
Comparison of actual tumor motion for patient 1 in x, y, and z with the motion calculated from the modified XCAT phantom. Here (a), (b) and (c) corresponds to x, y, and z directions respectively.
3.2. Synchronized modified XCAT phantom
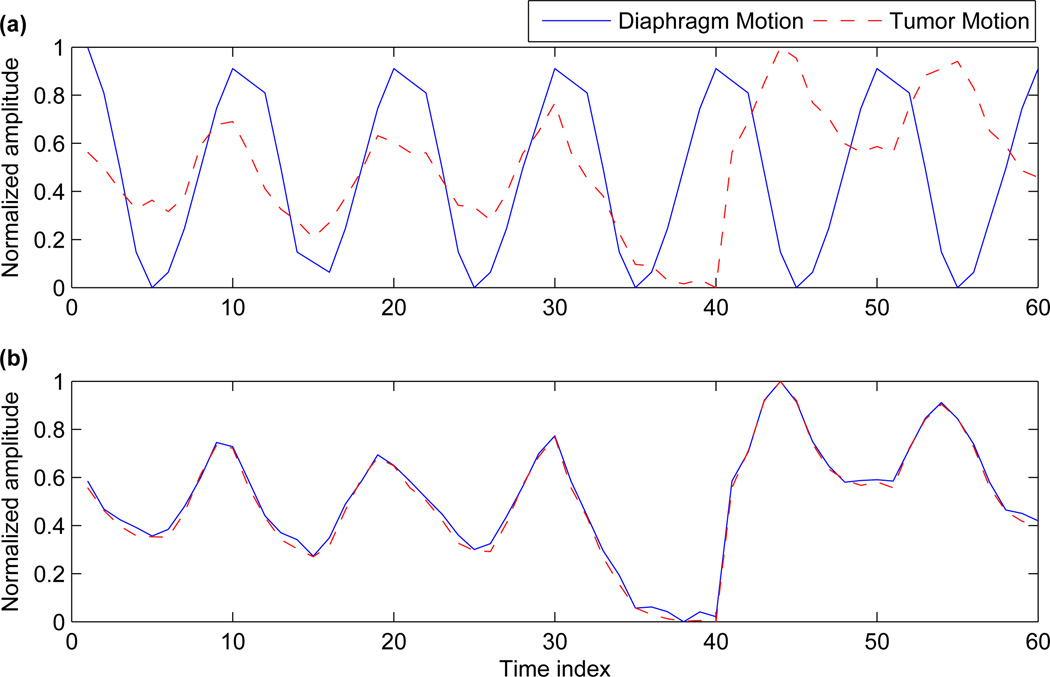
To further highlight the effect of synchronizing the tumor motion with the diaphragm and the chest wall motion, we trace these movements over a few respiratory cycles. Figure 6(a) shows the movement of tumor and diaphragm, based on independent tumor motion and the default diaphragm motion. Figure 6(b) shows the tumor motion and synchronized diaphragm motion (calculated adaptively as outlined in section 2.3). For both these cases, the voxel at the apex of the diaphragm is used as a representative of diaphragm motion. For tumor motion, the center voxel coordinate is chosen. For comparison purposes the amplitude has been normalized for a range of [0 1].
Figure 6.
(a) Shows the tumor motion and diaphragm motion before correction and (b) Shows the tumor motion and diaphragm motion after correction.
3.3. Sorting 4D CT data
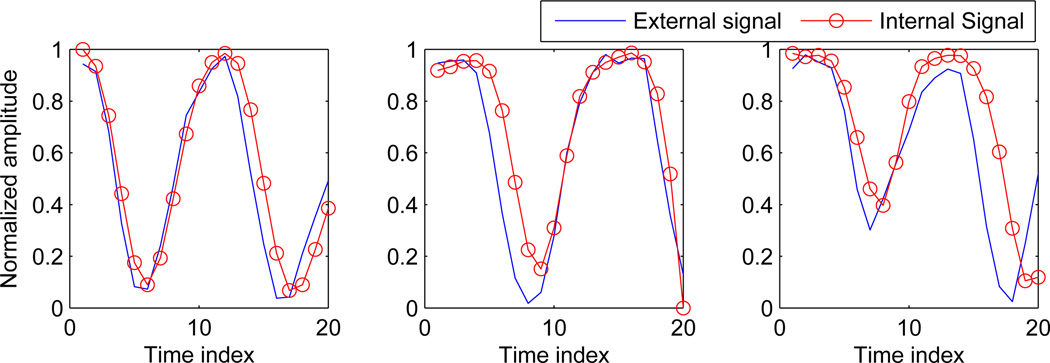
Respiratory signals obtained for three separate couch positions based on internal anatomical features are shown in figure 7. The blue line in this figure shows the external signal measured from the RTRT system, while the circled line shows the signal obtained based on internal anatomical features.
Figure 7.
Signal obtained using internal anatomy based features vs. external chest wall signal measured from the RTRT system for three different couch positions.
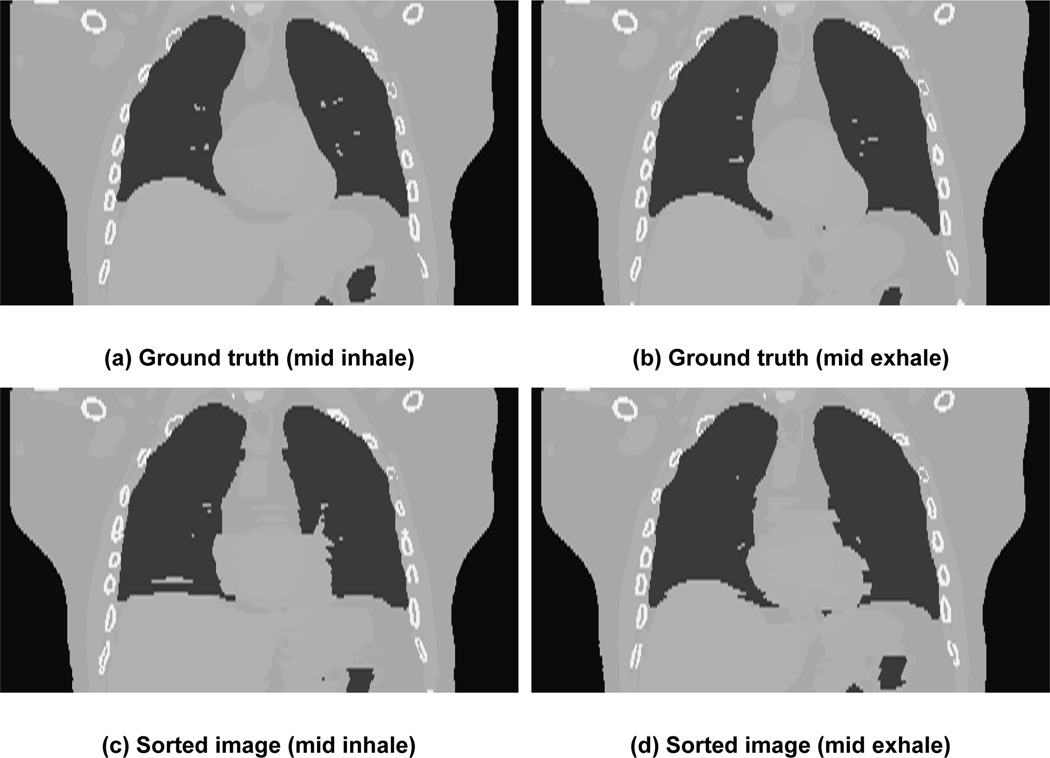
Sample results of sorted images corresponding to mid inhale (first column) and mid exhale (second column) is shown in figure 8. The sorted images are in the second row while the original images or “ground-truth” images are in first row. Ground-truth images are generated from the modified XCAT phantom using tumor motion data for one breathing cycle. The sorted 4D CT algorithm produces comparable volume to ground-truth volume. The image artifacts seen in the simulated 4D CT are similar to those that are seen clinically.
Figure 8.
Images in coronal view for two sorted phases. The first row shows the “ground truth” images from the modified XCAT while the bottom row shows the images generated after sorting. The first column shows phase corresponding to mid-inhale while the second column shows phase corresponding to mid exhale.
4. Discussion
The modified XCAT phantom provides an opportunity to generate realistic data based on tumor motion trajectories. Results based on the data from 10 patients show that the phantom can accurately reproduce patient tumor trajectories. A key issue in adapting the XCAT phantom to realistic breathing data is to correctly modify motions of all the organs involved in respiratory motion. The results in the previous section demonstrate that the current XCAT phantom can be extended to achieve this goal. Furthermore, specific applications involving 4D CT data generation and a phase sorting algorithm highlight the potential to mimic clinical situations. This is especially important for applications like 4DCT, where many independent acquisition variables are present.
There are a few directions in which the current work can be extended. In all the simulations we have used spherical shaped tumors. It would be more realistic to base our analysis on arbitrary tumor shape. The modified XCAT phantom can be made realistic by adapting it to the image generation based on reconstruction of slices. The XCAT model can be extended to take into account patient specific hysteresis of respiratory motion. The XCAT phantom uses a motion vector field to translate the anatomical variations and movements among different organs. A more realistic model e.g., finite-element model, to calculate the interaction among different organs would provide more anthropomorphic data. Based on the imaging softwares like GATE (Jan et al. 2004), the modified XCAT phantom can be used to generate multimodality imaging data for PET, SPECT, PET/CT and SPECT/CT.
5. Conclusion
In this work we propose an algorithm to adapt the current XCAT phantom to realistically account for independent tumor motion trajectories. This goal is achieved in two steps: First, we input a tumor motion to incorporate independent tumor motion in the current XCAT phantom. Second, arbitrary tumor motion is mapped to the existing respiratory model. To illustrate the utility of our algorithm we describe a methodology to generate a clinical 4D CT image dataset and use it to reconstruct phase-sorted 4D CT volumes.
Table 1.
RMSE values (in mm) in x, y, and z directions between the independent tumor location from actual patient data and the tumor location obtained from the modified XCAT phantom. A total of 10 different patients were evaluated.
| X | Y | Z | |
|---|---|---|---|
| Patient 1 | 0.30 | 0.41 | 0.45 |
| Patient 2 | 0.39 | 0.72 | 0.41 |
| Patient 3 | 0.33 | 0.69 | 0.35 |
| Patient 4 | 0.31 | 0.34 | 0.45 |
| Patient 5 | 0.29 | 0.39 | 0.37 |
| Patient 6 | 0.26 | 0.46 | 0.32 |
| Patient 7 | 0.27 | 0.71 | 0.32 |
| Patient 8 | 0.24 | 0.40 | 0.31 |
| Patient 9 | 0.28 | 0.82 | 0.45 |
| Patient 10 | 0.25 | 0.52 | 0.48 |
| Mean ± std | 0.29 ± 0.04 | 0.54 ± 0.17 | 0.39 ± 0.06 |
Acknowledgements
The authors would like to express their gratitude to Drs. Seiko Nishioka of the Department of Radiology, NTT Hospital, Sapporo, Japan and Hiroki Shirato of the Department of Radiation Medicine, Hokkaido University School of Medicine, Sapporo, Japan for sharing the Hokkaido dataset with us. We would also like to thank Dr. Ruijiang Li for helpful discussion on internal anatomical features based 4D CT sorting algorithm.
The project described was supported, in part, by Award Number R21CA156068 from the National Cancer Institute. The content is solely the responsibility of the authors and does not necessarily represent the official views of the National Cancer Institute or the National Institutes of Health.
Footnotes
Intrested readers can acquire MATLAB(C) code by emailing one of the contacts
The correlation coefficients for lower edge are 0.98, 0.99 and 0.99 and for the upper edge the values are 0.89, 0.92 and 0.94.
Contributor Information
Pankaj Mishra, Email: pmishra@lroc.harvard.edu.
John H Lewis, Email: jhlewis@lroc.harvard.edu.
References
- Berbeco RI, Mostafavi H, Sharp GC, Jiang SB. Towards fluoroscopic respiratory gating for lung tumours without radiopaque markers. Phys Med Biol. 2005;50(19):4481–4490. doi: 10.1088/0031-9155/50/19/004. [DOI] [PubMed] [Google Scholar]
- Canny J. A computational approach to edge detection. IEEE Trans. Pattern Anal. Mach. Intell. 1986;8:679–698. [PubMed] [Google Scholar]
- Caon M. Voxel-based computational models of real human anatomy: a review. Radiat Environ Biophys. 2004;42:229–235. doi: 10.1007/s00411-003-0221-8. [DOI] [PubMed] [Google Scholar]
- Chen GT, Kung JH, Beaudette KP. Artifacts in computed tomography scanning of moving objects. Semin Radiat Oncol. 2004;14:19–26. doi: 10.1053/j.semradonc.2003.10.004. [DOI] [PubMed] [Google Scholar]
- FORBILD. 2003 http://www.imp.uni-erlangen.de/forbild/english/forbild/index.htm. [Google Scholar]
- Ford EC, Mageras GS, Yorke E, Ling CC. Respiration-correlated spiral CT: a method of measuring respiratory-induced anatomic motion for radiation treatment planning. Med Phys. 2003;30:88–97. doi: 10.1118/1.1531177. [DOI] [PubMed] [Google Scholar]
- Hu Y, Zhu J. Computed tomography simulation using supertoroids. J Xray Sci Technol. 2010;18:1–13. doi: 10.3233/XST-2010-0229. [DOI] [PubMed] [Google Scholar]
- Jan S, Santin G, Strul D, Staelens S, Assie K, Autret D, Avner S, Barbier R, Bardies M, Bloomfield PM, Brasse D, Breton V, Bruyndonckx P, Buvat I, Chatziioannou AF, Choi Y, Chung YH, Comtat C, Donnarieix D, Ferrer L, Glick SJ, Groiselle CJ, Guez D, Honore PF, Kerhoas-Cavata S, Kirov AS, Kohli V, Koole M, Krieguer M, van der Laan DJ, Lamare F, Largeron G, Lartizien C, Lazaro D, Maas MC, Maigne L, Mayet F, Melot F, Merheb C, Pennacchio E, Perez J, Pietrzyk U, Rannou FR, Rey M, Schaart DR, Schmidtlein CR, Simon L, Song TY, Vieira JM, Visvikis D, Van de Walle R, Wieers E, Morel C. GATE: a simulation toolkit for PET and SPECT. Phys Med Biol. 2004;49:4543–4561. doi: 10.1088/0031-9155/49/19/007. [DOI] [PMC free article] [PubMed] [Google Scholar]
- Jiang SB. Radiotherapy of mobile tumors. Semin Radiat Oncol. 2006;16:239–248. doi: 10.1016/j.semradonc.2006.04.007. [DOI] [PubMed] [Google Scholar]
- Keall PJ, Mageras GS, Balter JM, Emery RS, Forster KM, Jiang SB, Kapatoes JM, Low DA, Murphy MJ, Murray BR, Ramsey CR, Van Herk MB, Vedam SS, Wong JW, Yorke E. The management of respiratory motion in radiation oncology report of AAPM Task Group 76. Med Phys. 2006;33:3874–3900. doi: 10.1118/1.2349696. [DOI] [PubMed] [Google Scholar]
- Kramer R, Khoury HJ, Vieira JW, Lima VJ. MAX06 and FAX06: update of two adult human phantoms for radiation protection dosimetry. Phys Med Biol. 2006;51:3331–3346. doi: 10.1088/0031-9155/51/14/003. [DOI] [PubMed] [Google Scholar]
- Li R, Lewis JH, Cervino LI, Jiang SB. 4D CT sorting based on patient internal anatomy. Phys Med Biol. 2009;54:4821–4833. doi: 10.1088/0031-9155/54/15/012. [DOI] [PubMed] [Google Scholar]
- Lu W, Parikh PJ, Hubenschmidt JP, Bradley JD, Low DA. A comparison between amplitude sorting and phase-angle sorting using external respiratory measurement for 4D CT. Med Phys. 2006;33:2964–2974. doi: 10.1118/1.2219772. [DOI] [PubMed] [Google Scholar]
- Mendenhall W, Sincich T. Statistics for Engineering and the Sciences. Upper Saddle River, NJ, USA: Prentice-Hall, Inc; 2006. [Google Scholar]
- Piegl L, Tiller W. The NURBS book (2nd ed.) New York, NY, USA: Springer-Verlag New York, Inc; 1997. [Google Scholar]
- Pretorius PH, King MA, Tsui BM, LaCroix KJ, Xia W. A mathematical model of motion of the heart for use in generating source and attenuation maps for simulating emission imaging. Med Phys. 1999;26:2323–2332. doi: 10.1118/1.598746. [DOI] [PubMed] [Google Scholar]
- Segars WP. PhD thesis. The University of South Carolina; 2001. Development of a new dynamic NURBS-based cardiac-torso NCAT phantom. [Google Scholar]
- Segars WP, Lalush DS, Tsui BMW. Modeling respiratory mechanics in the MCAT and spline-based MCAT phantoms. Proc. Conf Nuclear Science Symp. Record. 1999 IEEE. 1999;2:985–989. [Google Scholar]
- Segars WP, Lalush DS, Tsui BMW. Modeling respiratory mechanics in the mcat and spline-based mcat phantoms. IEEE Trans. Nucl. Sci. 2001;48(1):89–97. [Google Scholar]
- Segars WP, Mahesh M, Beck TJ, Frey EC, Tsui BM. Realistic CT simulation using the 4D XCAT phantom. Med Phys. 2008;35:3800–3808. doi: 10.1118/1.2955743. [DOI] [PMC free article] [PubMed] [Google Scholar]
- Segars WP, Sturgeon G, Mendonca S, Grimes J, Tsui BM. 4D XCAT phantom for multimodality imaging research. Med Phys. 2010;37:4902–4915. doi: 10.1118/1.3480985. [DOI] [PMC free article] [PubMed] [Google Scholar]
- The Visible Human Project. 1986 http://www.nlm.nih.gov/research/visible/visible_human.html.
- Vedam SS, Keall PJ, Kini VR, Mostafavi H, Shukla HP, Mohan R. Acquiring a four-dimensional computed tomography dataset using an external respiratory signal. Phys Med Biol. 2003;48:45–62. doi: 10.1088/0031-9155/48/1/304. [DOI] [PubMed] [Google Scholar]
- Zhu J, Zhao S, Ye Y, Wang G. Computed tomography simulation with superquadrics. Med Phys. 2005;32:3136–3143. doi: 10.1118/1.2040727. [DOI] [PubMed] [Google Scholar]
- Zubal IG, Harrell CR, Smith EO, Rattner Z, Gindi G, Hoffer PB. Computerized three-dimensional segmented human anatomy. Med Phys. 1994;21:299–302. doi: 10.1118/1.597290. [DOI] [PubMed] [Google Scholar]


