

Abstract
China and India are home to two of the world’s largest populations, and both populations are aging rapidly. Our data compare health status, risk factors, and chronic diseases among people age forty-five and older in China and India. By 2030, 65.6 percent of the Chinese and 45.4 percent of the Indian health burden are projected to be borne by older adults, a population with high levels of noncommunicable diseases. Smoking (26 percent in both China and India) and inadequate physical activity (10 percent and 17.7 percent, respectively) are highly prevalent. Health policy and interventions informed by appropriate data will be needed to avert this burden. By 2030, older adults will bear two-thirds of the total disease burden in China and nearly half in India.
China and India are home to more than a third of the world’s population. The population of India will continue to grow through 2050, whereas China’s population is expected to plateau by 2035. However, because of increases in life expectancy, the age composition of these two populations will change dramatically. While the proportion of the Chinese sixty-plus age group will grow more than threefold (from 10.9 percent to 35.8 percent) over fifty years, its population of those age eighty and older will expand nearly fourfold (from 1.8 percent to 6.8 percent) (Exhibit 1). For India, these age groups will grow by nearly the same factors (from 8.4 percent to 22.6 percent and from 0.8 percent to 3 percent, respectively). By 2019 in China and 2042 in India, the proportion of people age sixty and older will exceed that of people ages 0–14.1 Combined, more than 0.75 billion people age sixty and older will live in China and India in 2050, constituting 38.5 percent of the world’s sixty-plus population.
EXHIBIT 1. Trends In Various Adult Population Groups As A Proportion Of The Total Population, China And India. 2000–2050.
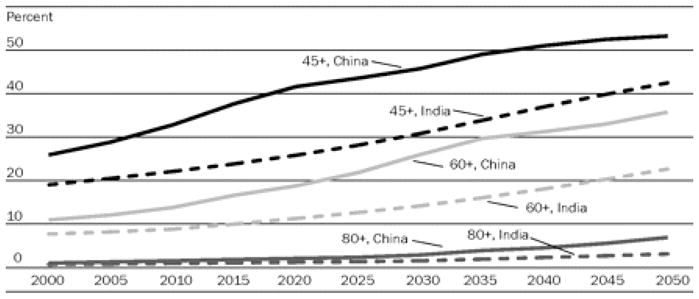
SOURCE: Population Division, Department for Economic and Social Information, United Nations. “World Population Prospects: The 2006 Revision Population Database,” December 2006, http://esa.un.org/unpp/index.asp?panel=2 (accessed 4 February 2008).
The aging of the population in China and India will bring with it an increase in the burden of chronic disease. It has been estimated that population aging will result in a 200 percent increase in deaths from cardiovascular disease in China during 2000–2040.2 In addition, the rapid economic growth in these countries, accompanied by rapid urbanization, may also contribute to the increase in non-communicable diseases. Urbanization is associated with unhealthy nutrition and physical inactivity, leading to obesity and increases in the prevalence of chronic diseases such as diabetes.3 The number of people with diabetes in China is projected to increase 103.4 percent, from 20.8 million to 42.3 million, between 2000 and 2030. In comparison, the rate of diabetes in India is expected to increase 150.5 percent, from 31.7 million to 79.4 million, over the same period.4
The Global Burden of Disease (GBD) study estimated that in 2001 almost half of the adult disease burden in low- and middle-income countries was attributable to noncommunicable diseases. Ischemic heart disease and stroke were the two leading causes of mortality and disease burden in people age sixty and older.5
In light of these findings, we summarize results from the World Health Organization’s (WHO’s) World Health Survey (WHS) for China and India, which also formed the baseline data and cohorts for the WHO’s Study on Global Ageing and Adult Health (SAGE). The SAGE work, as part of the WHS, focused on levels of health, chronic diseases, and risk factors in older adults, to further understand age and socioeconomic gradients in health outcomes. We also present data on the latest GBD update, with a specific focus on the older populations in India and China, to highlight the burden of noncommunicable diseases in these countries. We present the projections of disease burden for the year 2030 for these older adult populations and demonstrate the impact of population aging.
Study Data And Methods
The WHS/SAGE
The WHS/SAGE was implemented as a face-to-face household survey in China in 2002 and in India in 2003.6 The samples were drawn from a current frame using a stratified, multistage cluster design so as to allow each household and respondent to be assigned a known nonzero probability of selection. In China, the survey was carried out in Gansu, Guangdong (including Shengzhen city), Hebei, Hubei, Jiangsu, Shaanxi, Sichuan, and Zhejiang provinces, while in India the survey was carried out in the states of Assam, Karnataka, Maharashtra, Rajasthan, Uttar Pradesh, and West Bengal. This formed the baseline sample for SAGE and is the basis for the current analyses. To make valid comparisons across the two countries, age standardization was carried out based on the WHO’s World Standard Population.7
The survey instrument asked about difficulties in functioning in eight domains of health (mobility, self-care, pain and discomfort, cognition, interpersonal activities, vision, sleep and energy, and affect), tobacco use, alcohol use, physical activity, and exposure to indoor air pollution and chronic conditions (asthma, angina, arthritis, depression, and diabetes). In addition to self-reported diagnosis of a condition, a set of symptomatic questions based on each condition were also asked. The pattern of responses to the symptom questions were combined with results from a separate diagnostic item probability study to create an algorithm for the presence or absence of the disease.8
Economic status was derived indirectly from a set of known predictors of income (such as age and education of the household head) and indicators of economic status (primarily consumer goods such as ownership of a television set, automobile, and radio, as well as household amenities such as type of drinking water or toilet available).9
The GBD study
The original GBD study developed a comprehensive framework to incorporate data on nonfatal health outcomes into summary measures of population health. An important innovation of the GBD study was the use of a common metric (the disability-adjusted life-year, or DALY) to summarize the disease burden for specific diseases and injuries as well as the burden attributable to the major risk factors that cause those conditions. The DALY is a health gap measure calculated from GBD data that extends the concept of potential years of life lost because of premature death to include equivalent years of “healthy” life lost by virtue of being in states of poor health or disability.10
The GBD 2004 update incorporated a range of new data sources to develop internally consistent estimates of incidence; health state prevalence, severity, and duration; and mortality for 135 major causes, by sex and eight age groups.
The data inputs for the projection models take into account the greater number of countries reporting death registration data to the WHO, particularly from developing regions, other recently developed projection models for HIV/AIDS, and projected trends in tobacco smoking, overweight, and obesity.
Analytical methods
Health status
Item response theory (IRT) was used to score the responses to the sixteen self-reported health questions, using a partial credit model that served to generate a composite health status score.11 An item calibration was obtained for each item. To determine how well each item contributed to common global health measurement, chi-square fit statistics were calculated. The calibration for each of the sixteen health items was taken into account, and the raw scores were transformed through Rasch modeling into a continuous cardinal scale (0, worst health; 100, best health).
Economic status
To estimate economic status, a random-effects probit model was used to identify indicator-specific thresholds or “cutpoints” that represent the point on the economic status (latent) scale above which a household is more likely to own a particular asset than not. This enabled an estimation of an asset ladder (since thresholds would be higher for those assets whose ownership represented higher economic status). These estimates of thresholds, combined with actual assets observed to be owned for any given household, were used to produce an estimate of household-level economic status. This was then used to create income quintiles.12
Impact of socioeconomic variables
A linear regression was carried out to assess the impact of socioeconomic variables, chronic diseases, and risk factors across India and China on health. The health score was used as the dependent variable and included chronic conditions and risk factors as explanatory variables along with age, sex, education, residence, and income. All analyses were carried out using the probability weights and variance estimations, taking into account the complex design with the Taylor series method implemented in Stata 9.2.
Projections of health burden
To project the health burden to 2030, a set of models were used to project future health trends for baseline, optimistic, and pessimistic scenarios, based largely on projections of economic and social development, and using the historically observed relationships of these with cause-specific mortality rates.13 For the projections reported here, historical death registration data for 107 countries between 1950 and 2002 were used to model the relationship between death rates for all major causes excluding HIV/AIDS and four variables: (1) average income per capita, measured as gross domestic product (GDP) per capita in purchasing parity power (PPP)–adjusted dollars; (2) average number of years of schooling among adults; (3) time, a proxy measure for the improvement in health with time that has occurred over the past century independently of improvements associated with increasing levels of GDP and education; and (4) smoking intensity, measured by the component of lung cancer mortality that is attributable to tobacco smoking. Death rates were then projected using World Bank projections of GDP per capita, WHO projections of human capital, and smoking intensity projections based on historical patterns of tobacco use and further adjusted for recent regional trends in tobacco consumption where appropriate.
Separate projections
Separate projections for HIV/AIDS mortality and TB mortality were prepared by UNAIDS and the WHO. Since a sizable proportion of diabetes mortality is attributable to overweight and obesity, a separate projection model for diabetes mortality was also developed using WHO projections of trends in body mass index (BMI) distributions from 2000 to 2010. Projections of mortality for chronic respiratory diseases were also adjusted for projected changes in smoking impact.14
Study Results
The WHS baseline sample sizes were 10,750 and 4,300, with response rates of 92.8 percent in China and 95.6 percent in India. Data on health status, as measured by scoring how a respondent reported functioning in multiple domains, reveal that the Chinese were in much better health than the Indians (Exhibit 2). However, in both countries, males, respondents from higher-income quintiles, those living in urban areas, and younger “old adults” were in much better health.
EXHIBIT 2.
Mean Health Scores By Selected Sociodemographic Characteristics And Country, China (2002) And India (2003)
| China (N = 1,874)
|
India (N = 3,301)
|
|||
|---|---|---|---|---|
| Mean health score | SE | Mean health score | SE | |
| Sex | ||||
| Female | 67.2 | 1.0 | 57.9 | 0.7 |
| Male | 71.2 | 1.2 | 64.3 | 0.7 |
|
| ||||
| Age (years) | ||||
| 45–59 | 78.9 | 0.9 | 68.3 | 0.8 |
| 60–69 | 72.9 | 1.0 | 62.0 | 0.5 |
| 70–70 | 65.8 | 1.3 | 56.8 | 1.0 |
| 80+ | 61.0 | 1.8 | 55.6 | 1.3 |
|
| ||||
| Residence | ||||
| Urban | 70.5 | 1.1 | 63.6 | 1.0 |
| Rural | 68.1 | 1.3 | 60.5 | 0.6 |
|
| ||||
| Income quintile | ||||
| Q1 (poorest) | 64.5 | 1.1 | 57.1 | 0.6 |
| Q2 | 69.4 | 1.1 | 57.0 | 1.1 |
| Q3 | 68.1 | 0.8 | 60.7 | 0.6 |
| Q4 | 69.7 | 1.5 | 62.2 | 1.1 |
| Q5 (richest) | 71.2 | 1.2 | 61.4 | 0.8 |
|
| ||||
| Total | 69.0 | 0.9 | 60.8 | 0.5 |
SOURCES: World Health Organization, World Health Survey China (2002) and World Health Survey India (2003).
NOTES: SE is standard error. The health score on a scale of 0 to 100 refers to a composite functioning in day-to-day activities where a score of 0 means complete difficulty in functioning and 100 means no difficulties.
Reported diseases and conditions
The differences in the proportions of reported diseases between the two countries could contribute to the large difference in overall health status. Sixteen percent of respondents in China, compared with 46.9 percent of those in India, reported having at least one chronic disease. A higher proportion of older and poorer respondents than younger and richer respondents reported having one or more chronic conditions. The sex differences in disease prevalence were negligible in both countries, with the exception of more women than men in China and more men than women in India reporting one chronic condition.15
Risk behavior
Smoking was found to be highly prevalent among older adults in India and China, especially among the poorer populations, with 47.6 percent of men in China and 39.4 percent of men in India being daily smokers.16 Ten percent of Chinese respondents and 17.7 percent of Indian respondents had inadequate physical activity, with many more respondents in urban China than in rural China being physically inactive (15.6 percent versus 7.1 percent). Solid-fuel use leading to indoor air pollution was highly prevalent in rural areas in both India and China (83.5 percent and 50.9 percent of households, respectively) and especially so in poorer households in both countries.17
Health of the elderly
The regression results reveal that the health status of the older adult population was significantly worse in India than in China. In both countries, health significantly declined with age and was worse in the poorer populations, controlling for other explanatory variables. The presence of chronic disease significantly worsened health, and even more so if people had more than one chronic disease. Although smoking, heavy drinking, and inadequate physical activity all had negative effects on health, only inadequate physical activity was significant when other covariates were controlled for.18
Impact of aging on health burden
Moving from the survey results to the GBD study further illustrates the impact of aging on population health burden. More than half of the burden of noncommunicable disease occurs in the forty-five-plus age groups in both countries (Exhibit 3). According to the 2004 GBD results, approximately 44 percent of the total burden of disease in China and 25 percent of that in India occurs in the population age forty-five and older. The patterns of burden for men and women shown in Exhibit 3 are strikingly similar, with higher burdens at older ages in women attributable to longer life expectancies.
EXHIBIT 3.
Burden Of Disease In China And India: Percentage Of Disability-Adjusted Life-Years (DALYs) As A Proportion Of Total Population Burden By Sex, Age, Cause, And Country, 2004 And 2030
| 2004
|
||||||||
|---|---|---|---|---|---|---|---|---|
| China
|
India
|
|||||||
| Sex/age | Group I | Group II | Group III | All causes | Group I | Group II | Group III | All causes |
| Males | ||||||||
| 45–59 | 0.88 | 10.10 | 1.12 | 12.11 | 1.24 | 5.44 | 0.76 | 7.44 |
| 60–69 | 0.40 | 5.90 | 0.33 | 6.63 | 0.53 | 3.15 | 0.17 | 3.85 |
| 70–79 | 0.22 | 3.97 | 0.13 | 4.32 | 0.29 | 1.48 | 0.08 | 1.84 |
| 80+ | 0.07 | 1.11 | 0.03 | 1.21 | 0.07 | 0.34 | 0.02 | 0.43 |
|
| ||||||||
| Females | ||||||||
| 45–59 | 0.48 | 7.51 | 0.74 | 8.74 | 0.80 | 4.47 | 0.49 | 5.75 |
| 60–69 | 0.21 | 4.58 | 0.21 | 5.00 | 0.47 | 3.00 | 0.16 | 3.64 |
| 70–79 | 0.15 | 3.96 | 0.13 | 4.24 | 0.30 | 1.70 | 0.09 | 2.09 |
| 80+ | 0.09 | 1.64 | 0.04 | 1.77 | 0.08 | 0.39 | 0.02 | 0.48 |
|
| ||||||||
| Total | 2.52 | 38.76 | 2.73 | 44.01 | 3.77 | 19.96 | 1.79 | 25.52 |
|
| ||||||||
| 2030 | ||||||||
|
| ||||||||
| Males | ||||||||
| 45–59 | 0.37 | 12.04 | 1.18 | 13.59 | 0.78 | 11.04 | 1.37 | 13.19 |
| 60–69 | 0.20 | 10.82 | 0.63 | 11.65 | 0.36 | 5.96 | 0.31 | 6.63 |
| 70–79 | 0.10 | 5.81 | 0.23 | 6.14 | 0.24 | 2.61 | 0.16 | 3.02 |
| 80+ | 0.05 | 2.14 | 0.07 | 2.26 | 0.09 | 0.81 | 0.06 | 0.96 |
|
| ||||||||
| Females | ||||||||
| 45–59 | 0.22 | 8.51 | 0.94 | 9.67 | 0.41 | 8.01 | 0.87 | 9.30 |
| 60–69 | 0.15 | 9.49 | 0.57 | 10.21 | 0.29 | 6.16 | 0.42 | 6.87 |
| 70–79 | 0.13 | 7.97 | 0.31 | 8.41 | 0.28 | 3.97 | 0.24 | 4.49 |
| 80+ | 0.10 | 3.28 | 0.10 | 3.48 | 0.09 | 1.15 | 0.07 | 1.31 |
|
| ||||||||
| Total | 1.32 | 60.07 | 4.03 | 65.41 | 2.55 | 39.71 | 3.50 | 45.76 |
SOURCE: Authors’ calculations based on the Global Burden of Disease study, 2004 update (February 2008).
NOTES: Group I: communicable, maternal, perinatal, and nutritional conditions. Group II: noncommunicable diseases. Group III: injuries and violence.
A comparison of the 2004 results to projections to 2030 (Exhibit 3) demonstrates clearly the impact of aging on the epidemiological transition. Comparing the two years shows the rapid shift of disease burden to older age groups and at a higher rate than previously predicted. About 66 percent of the total disease burden in China and about 45 percent in India will be shared by these older adult populations. In China, about 60 percent of all disease burden across all age groups will be due to noncommunicable diseases in the forty-five-plus age group.
One of the major determinants of the change in disease burden over the next two decades in India and China is their rapidly aging populations (Exhibits 4 and 5). For most Group I causes (communicable, maternal, perinatal, and nutritional conditions), demographic and epidemiological changes are acting in the same direction to reduce total DALYs. Population growth and population aging act in opposite directions for the Group I DALY. For Group II (noncommunicable diseases), demographic changes tend to greatly increase DALYs, with aging being a much larger determinant than population growth in China compared to India. A more detailed examination of the projections reveal that although DALYs for all causes will decrease, from 267 to 220 DALYs per thousand people age forty-five and older in China, in India this will remain virtually unchanged (from 355 to 354 DALYs per thousand people from 2004 to 2030).19 Examination of this change by cause reveals that for all three groups of causes in China, DALYs per thousand people age forty-five and older will decline. This suggests that although the size of the older population will be larger, the older population will be healthier. In India, however, although DALYs attributable to Group I causes will decline in this population (from 52 to 20), DALYs attributable to Group II causes will in fact increase from 278 to 307 per thousand during the same period. This suggests that the older population in India will continue to experience declines in health.
EXHIBIT 4. Major Causes Of Disease Burden And Population-Based Influences, Expressed As Disability-Adjusted Life-Years (DALYs), China, 2030.

SOURCE: Authors’ calculations based on the Global Burden of Disease study, 2004 update (February 2008).
EXHIBIT 5. Major Causes Of Disease Burden And Population-Based Influences, Expressed As Disability-Adjusted Life-Years (DALYs), India, 2030.

SOURCE: Authors’ calculations based on the Global Burden of Disease study, 2004 update (February 2008).
Discussion
The results point to striking changes in patterns of the burden of disease and health status in these two countries, representing almost 40 percent of the world’s population. In 2004, a sizable proportion of the total disease burden was experienced by older adults in China and India. By 2030, older adults will bear two-thirds of the total disease burden in China and nearly half in India. Projections generally show a decline in total DALYs for China, because of a large drop in Group I–related deaths and a smaller increase in DALY contributions from Group II–related deaths because of aging populations. The overall contribution of DALYs from Group II nonetheless is projected to grow, because of the greater proportion of older people with constant age-specific rates of nonfatal conditions such as mental health and musculoskeletal conditions and a relative decline in the prevalence of Group I conditions as a result of the epidemiological transition.
Increased prevalence of risk factors
The persistent high risks of smoking in our study are comparable to those of other recent studies from India (across all age groups, 6 percent for women and 30 percent for men in WHS/SAGE, compared to 5 percent for women and 37 percent for men, according to Prabhat Jha and colleagues) and have similar trends rising with age.20 Furthermore, inadequate physical activity, combined with the demographic shift to larger older adult populations, will contribute to driving the epidemiological transition to higher noncommunicable disease prevalence rates. Already, older adults in these two countries are experiencing declines in health as they age, with the gradient being worse in India than in China. The reasons for these health differentials are not altogether apparent, but the increased prevalence of risk factors such as alcohol use and inadequate physical activity combined with chronic diseases might have contributed to them.
Lack of difference between men and women
The lack of difference between men and women in the number of reported chronic conditions despite differences in their exposure to risk factors could be confounded by differential patterns of symptom reporting. Although we used a symptom-based algorithmic approach to construct diagnosis instead of relying on self-reported diagnosis alone, the diagnosis of chronic diseases reported in our study is likely to be an underestimate, since most people in China and India are unlikely to be aware of their diagnostic status and may underreport their symptoms.
Implications for health policy
These findings have major implications for health policy in both countries. The projected increase in old-age dependency ratios and decline in health status of older adults suggest that health care services will need to shift resources and services to respond to an aging population soon. In addition, a review of social protection systems will be needed, including income security and living arrangements, given the expected trends in urbanization and shifts from larger extended families to smaller nuclear units.
Study limitations
Although our study results define current health status and suggest a future health scenario, some limitations must be recognized. The projections of burden are not intended as forecasts of what will happen in the future but as projections of current and past trends, based on certain explicit assumptions. The methods used base the disease burden projections on broad mortality projections driven largely by World Bank projections of future growth in income per capita and WHO projections of increases in human capital, together with a model relating these to cause-specific mortality trends based on historical observations in countries with death registration data over the past fifty years. The results depend greatly on the assumption that future mortality trends in poor countries will have a relationship to economic and social development similar to that having occurred in higher-income countries. If this assumption is not correct, then the projections for low-income countries may well be overly optimistic in the rate of decline of communicable diseases and the speed of the epidemiological transition.
Adjusting for rates of change
The predictions of the projections model were compared with historical trends in child mortality from 1990 to 2004; as a result, certain regression coefficients were modified for India and China. Thus, the revised projections assume that projected rates of change for cause-specific mortality rates over time, given levels of constant income and human capital, will be slower than those observed in mainly high-and middle-income countries using death registration data over the past fifty years. This has reduced the projected rates of decline in Group I conditions for India and China compared to the original GBD projections, and this adjustment may be too conservative. On the other hand, the many problems facing India and China in improving and sustaining access to effective health interventions, and in scaling up health systems to cost-effectively address these challenges, may mean that they do not experience the temporal pace of health improvement at constant levels of income and human capital that have been seen in the high-income countries over the past fifty years.
Broad trends in risk factors
The projections have also not taken explicit account of trends in major risk factors apart from tobacco smoking and, to a limited extent, overweight and obesity that we assumed would decline in economic development. If broad trends in risk factors are toward worsening of risk exposures with development, rather than toward the improvements observed in recent decades in many high-income countries, then again the projections for China and India presented here will be too optimistic. There is a need to develop much more comprehensive projection models that take explicit account of available information on trends in a wide range of risk factors.
Projecting years of life lost
Finally, as did Christopher Murray and Alan Lopez, we recognize that the approach taken to projecting the years lost to disability (YLD) component of DALYs is extremely crude and that the projections of DALYs are likely to be even more uncertain than the projections of deaths.21 Case-fatality rates for many diseases could decline over the next thirty years, so that YLD becomes an increasing proportion of the total DALYs for these causes. On the other hand, improvements in risk factors or health interventions, or both, may lead to decreases in burden for some nonfatal conditions. Much research is needed to develop robust and unbiased methods for measuring trends in case-fatality rates, survival times, and disability due to specific causes, besides collecting such data for China and India.
Reporting biases
The WHS/SAGE survey methods relied on self-reported health data for health status, risk factors, and chronic disease. Although we used identical instruments in both countries, some systematic reporting biases might have exaggerated the differences between the two countries. Also, the WHS/SAGE samples in China and India were not drawn from a national frame but were intended to be representative on an aggregate. Our estimates of the burden of disease for 2004 were based on the best available current evidence. However, nationally representative data on chronic diseases and risk factors, such as obesity and physical activity, are scarce in both China and India, especially with regard to time trends. Furthermore, data on health examinations and biomarkers (not presented) will serve to increase the validity of the data and facilitate international comparisons.
Longitudinal studies under way
The results and body of work presented point to a strong need for longitudinal studies with explicit strategies to allow for ex ante and ex post international comparability for better empirical inputs into the burden-of-disease estimates for time trends and projections of future burden. This is especially required for the older adult population. It is with this intent that several efforts are under way. The WHO’s SAGE is a six-country study that is following up cohorts of people age fifty and older to study health and health-related outcomes, well-being, and their determinants biennially.22 The Longitudinal Aging Study in India (LASI) and the China Health and Retirement Longitudinal Study (CHARLS) are studies of the population older than age forty-five that parallel the Health and Retirement Study (HRS) in the United States, the English Longitudinal Survey of Ageing (ELSA), the Survey of Health and Retirement Economics in fifteen European countries (SHARE), and sister surveys in Japan and South Korea.23 LASI and CHARLS will examine the relationship between economic activity and health outcomes. This group of studies, along with other longitudinal studies of aging using common instruments and methods, will provide a rich database to use in understanding the phenomenon of aging and its implications globally.
Supplementary Material
Endnotes
- 1.United Nations Population Division, Department for Economic and Social Information. [accessed 4 February 2008];World Population Prospects: The 2006 Revision Population Database. 2006 Dec; http://esa.un.org/unpp/index.asp?panel=2.
- 2.Leeder S, et al. A Race against Time: The Challenge of Cardiovascular Disease in Developing Economies. New York: Columbia University Press; 2005. [Google Scholar]
- 3.Wang L, et al. Preventing Chronic Diseases in China. Lancet. 2005;366(9499):1821–1824. doi: 10.1016/S0140-6736(05)67344-8. [DOI] [PubMed] [Google Scholar]; Wang H, et al. Trends in the Distribution of Body Mass Index among Chinese Adults, Aged 20–45 Years (1989–2000) International Journal of Obesity. 2007;31(2):272–278. doi: 10.1038/sj.ijo.0803416. [DOI] [PubMed] [Google Scholar]
- 4.International Diabetes Federation. [accessed 4 February 2008];Diabetes Atlas. (2). http://www.eatlas.idf.org/Prevalence.
- 5.Mathers CD, et al. The Burden of Disease and Mortality by Condition: Data, Methods, and Results for 2001. In: Lopez AD, et al., editors. Global Burden of Disease and Risk Factors. New York: World Bank and Oxford University Press; 2006. pp. 45–240. [PubMed] [Google Scholar]
- 6.Ustun TB, et al. The World Health Surveys. In: Murray CJL, Evans DB, editors. Health Systems Performance Assessment: Debates, Methods, and Empiricism. Geneva: World Health Organization; 2003. pp. 797–808. [Google Scholar]
- 7.Ahmad OB, et al. Age Standardization of Rates: A New WHO Standard, Global Programme on Evidence for Policy Discussion Paper Series. Geneva: WHO; 2001. [Google Scholar]
- 8.Moussavi S, et al. Depression, Chronic Diseases, and Decrements in Health: Results from the World Health Surveys. Lancet. 2007;370(9590):851–858. doi: 10.1016/S0140-6736(07)61415-9. [DOI] [PubMed] [Google Scholar]
- 9.For further details about diagnosis of chronic diseases and derivation of household income, see the online Technical Appendix at http://content.healthaffairs.org/cgi/content/full/27/4/1052/DC1
- 10.Lopez AD, et al. Measuring the Global Burden of Disease and Risk Factors, 1990–2001. In: Lopez, et al., editors. Global Burden of Disease and Risk Factors. pp. 1–13. [Google Scholar]
- 11.Wilson M, Allen DD, Li JC. Improving Measurement in Health Education and Health Behavior Research Using Item Response Modeling: Introducing Item Response Modeling. Health Education Research. 2006;21(1 Supp):i4–i18. doi: 10.1093/her/cyl108. [DOI] [PubMed] [Google Scholar]
- 12.Ferguson BD, et al. Estimating Permanent Income Using Indicator Variables. In: Murray, Evans, editors. Health Systems Performance Assessment. pp. 747–760. For further details about the calculation methods, see the online Technical Appendix, as in Note 9. [Google Scholar]
- 13.Mathers CD, Loncar D. Projections of Global Mortality and Burden of Disease from 2002 to 2030. PLoS Medicine. 2006;3(11):e442. doi: 10.1371/journal.pmed.0030442. [DOI] [PMC free article] [PubMed] [Google Scholar]
- 14.See the online Technical Appendix for further explanations and details about DALYs and GBD study methods, as in Note 9.
- 15.Ibid.
- 16.See Appendix Table 2; ibid.
- 17.See the online Technical Appendix; ibid.
- 18.See Appendix Table 3; ibid.
- 19.See Appendix Table 4; ibid.
- 20.Jha P, et al. A Nationally Representative Case-Control Study of Smoking and Death in India. New England Journal of Medicine. 2008;358(11):1137–1147. doi: 10.1056/NEJMsa0707719. [DOI] [PubMed] [Google Scholar]
- 21.Murray CJL, Lopez AD. The Global Burden of Disease: A Comprehensive Assessment of Mortality and Disability from Diseases, Injuries, and Risk Factors in 1990 and Projected to 2020. Cambridge, Mass: Harvard University Press; 1996. [Google Scholar]
- 22.WHO. [accessed 14 April 2008];WHO Study on Global Ageing and Adult Health (SAGE) 2005 http://www.who.int/healthinfo/systems/sage/en/index.html.
- 23.Juster FT, Suzman R. An Overview of the Health and Retirement Study. Journal of Human Resources. 1995;30(5 Supp):S7–S56. [Google Scholar]
Associated Data
This section collects any data citations, data availability statements, or supplementary materials included in this article.