Abstract
Febrifugine and its derivatives are effective against Plasmodium falciparum. Using PHASE algorithm, a five-point pharmacophore model with two hydrogen bond acceptor (A), one positively ionizable (P) and two aromatic rings (R), was developed to derive a predictive ligand-based statistically significant 3D-quantitative structure-activity relationship (QSAR) model (r2 = 0.972, SD = 0.3, F = 173.4, Q2 = 0.712, RMSE = 0.3, Person-R = 0.94, and r2pred = 0.8) to explicate the structural attributes crucial for antimalarial activity. The developed pharmacophore model and 3D QSAR model can be a substantial tool for virtual screening and related antimalarial drug discovery research.
Keywords: Antimalarial, febrifugine, pharmacophore, PHASE, 3D QSAR
INTRODUCTION
More often than not, the focus of various studies has been to demonstrate antimalarial efficacy in vitro for new structural classes or modification of the natural product architecture. Two Chinese medicinal plant Dicora febrifugia and Hydrangea umbellate[1,2] are the sources of Febrifugine [Figure 1] and Isofebrifugine [Figure 2],[3] which have proved inhibitory action against Plasmodium falciparum malaria with novel mechanism of action.[4] Febrifugine contain a 4-quinazolinone ring linked to a 3” hydroxyl piperidine ring with a propyl-2-one chain[5] and compounds with modified side chain attached to the N-3 site of 4-quinazolinone ring posed to be ineffective. The structure-activity relationship (SAR) study revealed that 4-quinazolinone ring, 1” nitrogen atom and 3” hydroxyl group of febrifugine, is imperative for its remarkable antimalarial property,[6,7] which exhorted ample interest toward febrifugine-based antimalarial drug development. Contrarily, the compounds fabricate unavoidable human toxicity and arduous synthesis. The challenging synthesis inspired scientists to synthesize a large number of febrifugine derivatives, among them Oshima et al. (2003) developed a new class of febrifugine analogues with high selectivity and minimal toxicity,[8] antimalarial activity against chloroquine-resistant P. falciparum (FCR) strain. A rational approach for the discovery of a pharmaceutically acceptable, economically viable, antimalarial awaits development of a global mechanism of action model for febrifugine and its analogues and/or a predictive quantitative structure-activity relationship (QSAR)-based pharmacophore model. One method of coordinating these strategies is to make use of QSAR models for the rapid prediction and virtual prescreening of antimalarial activity. Our efforts to furnish new iterations of QSAR (Scheme 1) in this area have been chronicled, leading to highly bioactive derivatives of febrifugine. The developed theoretical assumptions revealed a lucid idea for enhanced understanding about SAR of febrifugine and its congeners.
Figure 1.
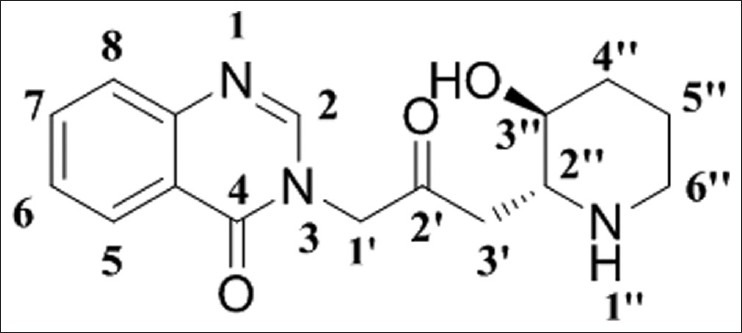
Febrifugine
Figure 2.
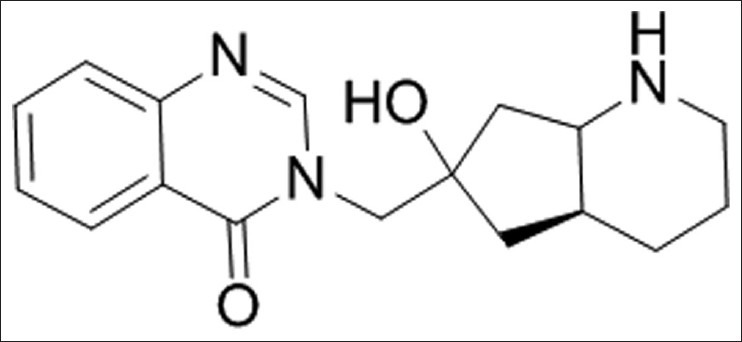
Isofebrifugine
Scheme 1.
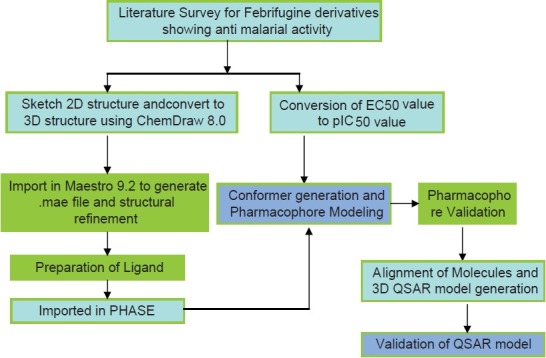
Graphical representation of Pharmacophore model generation and QSAR analysis
MATERIALS AND METHODS
Datasets and Biological Activity
A total of thirty three (33) febrifugine derivatives[8–10] were collected from literature showing in vitro activity in terms of EC50 value in moles [Table 1] against P. falciparum FCR-3 strain.[11] The biological activities considered for the study were converted to pIC50 (-log EC50 +9), using Gaussian statistics to secure more significant Figure for visualizing bioactivity. All the 2D molecular structures were sketched and transformed into 3D structures using ChemDraw Ultra 8.0.
Table 1.
Structures of febrifugine derivatives

Ligand Preparation
Energy minimization was done using OPLS 2005 force field of Ligprep module of Schrodinger Molecular modelling Suite 2011. The pH of ionization of the molecules was taken to be neutral.[12–14] For the development of the pharmacophore model, these ligands were imported in PHASE. Conformation generation is an important step in PHASE algorithm; conformations were generated using ConFigureen taking GB/ SA solvent model. About 1 000 conformers were generated per structure ensuring 50 step minimization.[15] The minimized conformers were filtered using a relative energy parameter limitation of 10 kcal/mol and a minimum atom deviation of 1.00 Å. If there was any conformer higher than this limit, or redundant, its incessant disposition was ensured. Thus, the lowest energy non-redundant conformers of a ligand were used for pharmacophore model development.[16] A couple of conformer was defined as identical if the relative distance between them is below 1.00 Å.[17]
Creating Pharmacophore Sites and Common Pharmacophore Hypothesis Generation
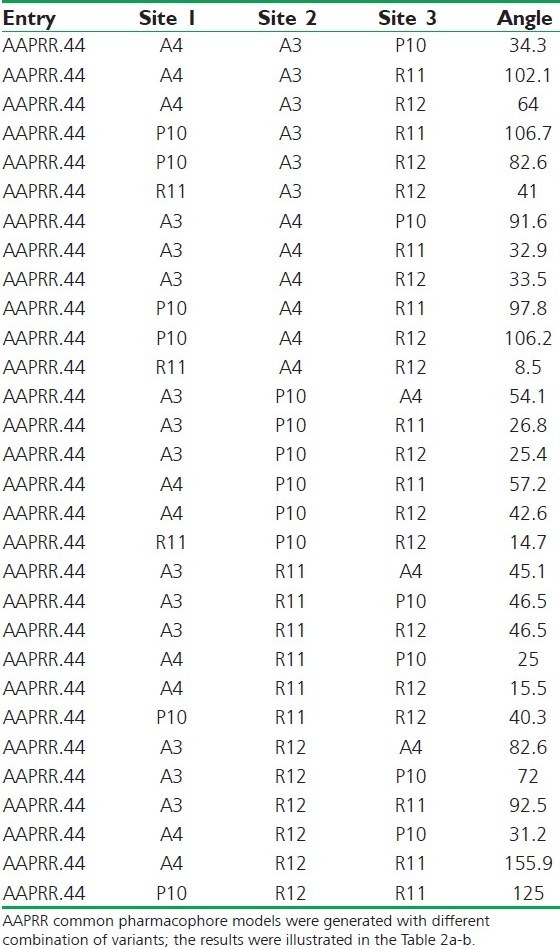
According to the bioactivity, the molecules were divided into actives and inactives, setting the maximum and minimum values in the activity threshold window of PHASE. Pharmacophore sites of a ligand are represented in the 3D space by a set of points. These points coincide with various chemical characteristics with type, location, and directionality, which facilitate non-covalent bonding with the receptor sites. The pharmacophore features like hydrogen bond acceptor (A), hydrogen bond donor (D), hydrophobic/Non-polar group (H), negatively ionizable (N), positively ionizable (P), and aromatic ring (R) were used to create the pharmacophore sites for the energy-calculated ligands. The following features were assigned using SMART queries [Tables 2a,b].[18–20] Tree-based partition algorithm is used by PHASE for detection of common pharmacophore from a set of variants taking maximum tree depth 3. To find common pharmacophore, PHASE algorithm use an exhaustive analysis of k-point pharmacophore match picked from the conformations of a set of active ligands on the basis of inter site distances,[21] and then find all spatial arrangements of pharmacophore features those are common to at least 8 of 10 active ligands. The generated pharmacophores match different set of actives eliminating the chance of its exclusiveness toward a small subset of ligands. The different pharmacophore hypotheses were further examined by using a scoring function, so that it produced the best alignment of the ligands.
Table 2a.
Distance (in Å) between the sites
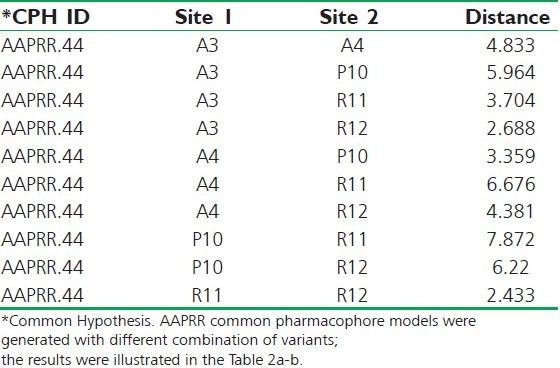
Table 2b.
Angle between the sites
Scoring Pharmacophore Hypotheses
The scoring of the pharmacophore hypotheses was done in relation to the information from the active ligands considering various geometric and heuristic factors. The alignment to a reference pharmacophore is considered according to RMSD of the site points and the average cosine of the vectors keeping their tolerance 1.2 Å and 0.5, respectively. To get the reference ligand from the most active set, upper 10% was considered for score calculation. For further refinement, volume scoring was performed in order to measure quantitatively of how each non-reference ligand is superimposing with the reference ligand. Here, the cutoff for volume scoring was kept at 1.00 for the non-reference pharmacophores.
3D-Quantitative Structure-Activity Relationship Model Generation
To produce a statistically significant 3D-QSAR model, the first and the foremost requirement is the alignment of ligands; therefore, to execute the QSAR study, a pharmacophore-based alignment was considered. The PHASE algorithm uses a very flexible approach for the development of 3D QSAR model. It considers a rectangular grid of 1 Å grid distance in a 3D space. Thus, it creates cubes of said dimension in the 3D space. The atoms of the molecules which are considered as overlapping Vander Waal spheres fall inside these cubes depending on the volume of the atomic spheres. These occupied cube spaces are termed as volume bits.[18,22] A volume bit is allocated for each different class of atom that occupies a cube. There are six atom classes, viz. two hydrogen bond acceptor (A), one positively ionizable (P), and two aromatic ring (R) used for classifying the atom characteristics. The total number of volume bits consigned to a specified cube is based on how many training set molecules occupy that cube. A single cube may represent the occupation by one or various atoms or sites, and even those from the same molecule or may be from unlike molecules of the training set. Thus, a molecule may be represented by a binary string concurrent to the occupied cubes, and also the various types of atomic sites that exist in those cubes.
To create an atom-based QSAR model, these volume bits which encode the geometrics and chemical characteristics of the molecule are regarded as independent variables in PLS (Partial Least square) regression analysis.[23] For generating a predictive QSAR model, we have to select six number of PLS factor. The maximum PLS factor that can be taken is N/5, where N is the number of ligands present in the training set.
RESULTS
Pharmacophore Modeling
Several five-point common pharmacophore hypotheses with various combination of site were generated using active molecules. The pharmacophore models were ranked on the basis of alignment to the active compounds; a scoring function and ten pharmacophore hypotheses survived. The “survival” scoring (S) function identifies the best candidate from the generated models and assigns an overall ranking of all the hypotheses. The scoring algorithm includes contributions from the alignment of site points and vectors, volume overlap, selectivity, number of ligands matched, relative conformational energy, and activity. However, the models should also discriminate between active and inactive molecules. If inactive molecule scores well, the hypothesis could be invalid as it does not discriminate between actives and inactives. For the following reason, adjusted survival score S_I (Survival score – Inactive molecule scoring) was calculated by subtracting the inactive score from survival score [Table 3]. On the basis of high S_I score and using a rescoring function (Post-hoc), AAPRR.28, AAPRR.44, AAPRR.67, hypotheses were chosen. By using the test set compounds, the predictive ability of each hypothesis was analyzed. A summary of all pharmacophore-based QSAR model (Model 1-3) with statistical parameters is summarized in Table 4.
Table 3.
Phase hypothesis

Table 4.
Summary of the 3D-QSAR model

A statistically significant valid QSAR model[24] can bring trustworthy results. Considering various statistical parameters such as R2 (Correlation coefficient), Q2 (q2 for the predicted activity), SD (Standard deviation), RMSE (Root mean square error), P (Significance level of variance ratio), F-Statistics, Pearson-R (correlation between the predicted and observed activity), a statistically significant QSAR model was generated. To avoid over-fitting of the results, four PLS factor was used.
3D Quantitative Structure-Activity Relationship
From the Table 4, R2 is greater than 0.900, SD value is lower than 0.35, and F-statistics value is high, which clearly indicate that all these models can describe the SAR properties of all training set molecules. But it is important to select a QSAR model based on its predictive ability. Therefore, we consider a model having high Q2, and r2pred value determined by using the formula r2pred = 1-PRESS/ SSD for further analysis. The Q2 = 0.712 and r2pred, = 0.84 value of Model-2 is higher than all other models. But the lowest RMSE value and highest Pearson-R value was found in Model-1. Due to impressive and consistent predictive ability of Model-1, it can be termed as best 3D QSAR model of febrifugine derivatives.
DISCUSSION
The special arrangement of features along with their distance present in five featured pharmacophore (AAPRR-44, [Figure 3]) depicted two rings aromatic features, mapped in the 4-quinazolinone ring of highest active as well as reference ligand, 29. The hydrogen bond acceptor feature is mapped to the C=O group at 4th position of 4-quinazolinone ring and on 2’ position of linker chain and positive ionic feature is mapped 1” NH atom of piperidine ring. This hypothesis was used to align [Figure 4] the dataset and analyze by developing PHASE 3D QSAR model utilizing four PLS factor.
Figure 3.
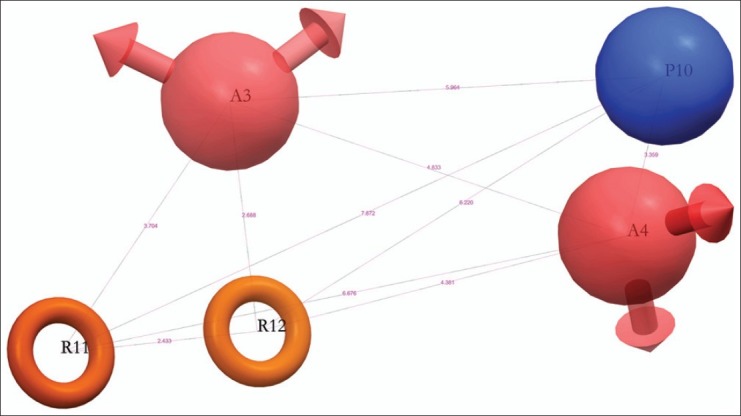
Pharmacophore
Figure 4.
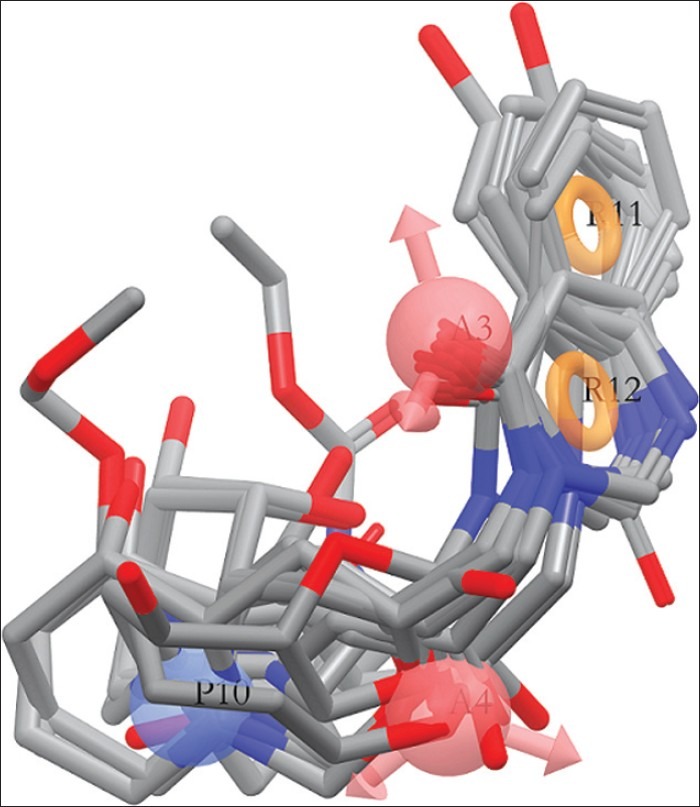
Alignment of molecules_1
The color maps around the ligands obtained by PHASE QSAR indicate that ligand-based 3D QSAR analysis can define the important features and effects of various substitutions upon febrifugine derivatives for their antimalarial action. It is helpful to recognize important sites which require a certain physicochemical property for developing potent antimalarials. The blue color region indicates the positive effect and red color region indicates negative effects of particular physicochemical properties. To recognize the PHASE QSAR maps, it is necessary to analyze the pharmacophore-based alignment [Figure 4].
H-Bond Donor
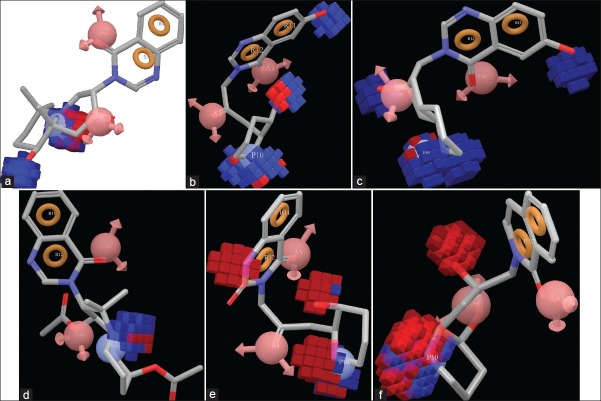
The features of hydrogen bond donor that has been obtained from the QSAR model applied to the most active ligands 1, 29, 32; less active ligands 27, 30; and moderately active ligand 13 are shown in Figure 5a–f (supplementary data 5b-f). The blue color indicates the favorable and red color indicate unfavorable region of H-Bond donor group for antimalarial activity.
Figure 5(a-f).
H-Bond donor effect upon Ligand 1
As illustrated in Figure 5a–f, the blue region or H-bond donor favorable region is found around the N-1” atom of piperidine of all molecules, which indicates that this secondary amino (2° NH2) group is very crucial for biological activity. In the compound 1, 13, and 30, the appearance of red color region along with blue color region where N-1” atom is in trans conformation indicates the importance of this particular stereo-isomer on biological activity. There is no red color region that appears around N-1” atom in 29 which is the reference ligand and in 32 where this secondary amino (2° NH2) group is in cis confirmation. Earlier, this fact was specifically established by synthetic chemists.[11] Moreover, this phenomenon indicates the superior predictive ability of our model.
The blue color region around 3” hydroxyl group of piperidine ring of all ligands indicates the importance of this group for showing biological activity. Appearance of red color region at N-1 position of 4-quinazolinone ring indicates reduction of C=N group of 4-quinazolinone ring which is unfavorable for activity. The 6-hydroxyl group of 4-quinazolinone ring is essential for antimalarial activity and an important feature because it reduce the toxicity which was indicated by blue color region in the active ligands 29, 32, formerly depicted by in vivo assay of Plasmodium berghei model.
Effect of Hydrophobic/Non-polar Substitution
When the QSAR model is applied upon the highest active molecule 1, reference ligand 29, and lowest active ligand 27, the red color region indicate the unfavorable and green color region indicates the favorable hydrophobic/non-polar interaction sites [Figure 6a–c] (supplementary data 6b,c). The green color region around the di-methyl substitution adjacent to N-1” atom indicates favorable position for antimalarial activity. But substitutions at N-1” atom will be unfavorable for activity; this was indicated by the red color region emerging around the aforesaid positions. Bulky substitution at 6-hydroxy group will reduce the biological activity. The bulkier substitution is unfavorable for biological activity. Substitution with ether groups may reduce antimalarial property.
Figure 6(a-c).
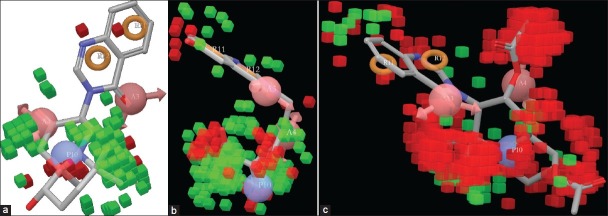
Effect of hydrophobicity upon ligand 1
Positive Ionic Effect
Figure 7a–c (supplementary data 7b-c) discloses the favorable and unfavorable region for positive ionic effects. The yellowish region indicates the positive effect and red color indicate negative effect upon biological activity. In every ligand, yellow color region appears around the N-1” atom of piperidine ring which indicates that this atom is crucial for biological activity.
Figure 7(a-c).

Effect of positive ionic effect upon ligand 1
Effect of Electron-Withdrawing Group
The cyan color around the ligand indicates the addition of electron-withdrawing group that will favor the antimalarial activity and the red color region indicates unfavorable position for substitution with electron-withdrawing groups [Figure 8a–e] (supplementary data 8b-e). The cyan color around the N-1 atom of 4-quinazolinone ring indicates that electron-withdrawing effect is essential for producing antimalarial action. The N-1 atom basically attach with carbon atom by a double bond in the -C=N-C- orientation. Analyzing this feature in ligand 11 which contain substituted pyrimidin ring instead of 4-quinazolinone moiety, it is clear that N-methylene-methane-amine residue is very important for antimalarial action. Moreover, in lowest active ligand 27, the cyan color around the -C=N-C- region indicates its inevitability for biological activity. In the less active ligand 27, red colors around the acetylated hydroxyl group indicates that these positions are unfavorable for substitution with electron-withdrawing group. This may reduce the antimalarial property. In the reference ligand 29, substitutions with weak electron-withdrawing group at C-2 atom of quinazolinone ring may increase the biological activity. Substitution at C-2’ position with weak electron-withdrawing group is favorable for showing antimalarial effect. If the N-1” atom is substituted with electron-withdrawing group, it will reduce the biological activity which is found in ligand 4 which contain ethyl piperidine-1-carboxylate moiety.
Figure 8(a-c).
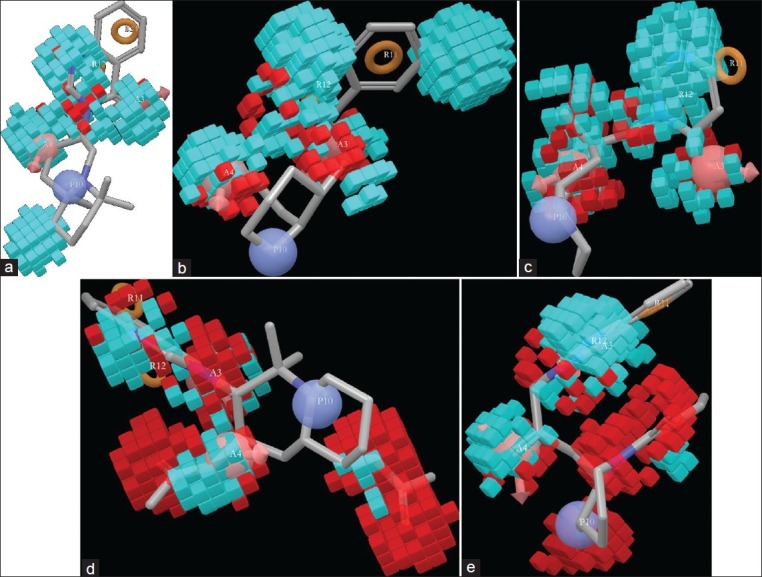
Effect of electron-withdrawing group
CONCLUSION
The study represents the pharmacophoric features of febrifugine analogues as a potential antimalarial agent. It depicts a five-point pharmacophore with two hydrogen bond acceptors (A), one positive ionic effect producing group (P), and two aromatic rings (R). A 3D-QSAR model with good statistical significance and predictive ability was developed on the basis of pharmacophore hypothesis with R2 = 0.97, Q2 = 0.71, Pearson-R = 0.94, and r2pred = 0.84. Besides, visualization of the 3D-QSAR model in the context of the molecules under study affords details of the connection between structure and activity, which clearly indicates the features for designing better analogues. The effects of H-bond acceptor at positions C-6, N-1”, and C-3”, positively ionizable group at N-1’ position, addition of electron-withdrawing group at C-6 and N-3’ was identified as an important criteria and vital regions for substitution of febrifugine-based antimalarial compounds. This ligand-based 3D-QSAR model could be very useful for virtual screening and lead optimization for the identification and development of better molecule against chloroquine-resistant strains of P. falciparum.
ACKNOWLEDGMENT
We acknowledge Schrödinger LLC, Bangalore, India, for their immense support and assistance.
Footnotes
Source of Support: Nil
Conflict of Interest: Nil.
REFERENCES
- 1.Kuehl FA, Jr, Spencer CF, Folkers K. Alkaloids of Dichroa Febrifuga Lour. J Am Chem Soc. 1948;70:2091–3. doi: 10.1021/ja01186a031. [DOI] [PubMed] [Google Scholar]
- 2.Koepfli JB, Mead JF, Brockman JA., Jr Alkaloids of Dichroa febrifuga.Isolation and Degradative Studies. J Am Chem Soc. 1949;71:1048–54. doi: 10.1021/ja01171a080. [DOI] [PubMed] [Google Scholar]
- 3.Murata K, Takano F, Fushiya S, Oshima Y. Enhancement of NO Production in Activated Macrophages in Vivo by an Antimalarial Crude Drug, Dichroa febrifuga. J Nat Prod. 1998;61:729–33. doi: 10.1021/np970433o. [DOI] [PubMed] [Google Scholar]
- 4.Harayama T, Takeuchi Synthesis of febrifugine derivatives and a solution to the puzzle of the structural determination of febrifugine. Tetrahedron. 2003;59:1639–46. [Google Scholar]
- 5.Redginal I, Hewitt IR, Wallace WS, Gill ER, Williams JH. An Antimalarial alkaloid from hydrangea: XIII.The effects of various synthetic quinazolones against plasmodium lophurae in ducks. Am J Trop Med Hyg. 1952;1:768–77. [PubMed] [Google Scholar]
- 6.Fishman M, Cruickshank PA. Febrifugine antimalarial agents.Pyridine analogs of febrifugine. J Med Chem. 1970;13:155–6. doi: 10.1021/jm00295a050. [DOI] [PubMed] [Google Scholar]
- 7.Chien PL, Cheng CC. Structural modification of febrifugine. Some methylenedioxy analogs. J Med Chem. 1970;13:867–70. doi: 10.1021/jm00299a018. [DOI] [PubMed] [Google Scholar]
- 8.Kikuchi H, Tasaka H, Hirai S, Takaya Y, Iwabuchi Y, Ooi H, et al. Potent febrifugine analogues against the Plasmodium malaria Parasite. J Med Chem. 2002;45:2563–70. doi: 10.1021/jm010448q. [DOI] [PubMed] [Google Scholar]
- 9.Takaya Y, Tasaka H, Chiba T, Uwai K, Tanitsu M, Kim HS, et al. New type of Febrifugine Analogus, Bearing a Quinolizidine Moiety, Show Potent Antimalarial Activity against palasmodium malaria parasite. J Med Chem. 1999;42:3163–6. doi: 10.1021/jm990131e. [DOI] [PubMed] [Google Scholar]
- 10.Hirai S, Kikuchi H, Tasaka HS, Begum K, Wataya Y, Tasaka H, et al. Metabolite of febrifugine and its synthetic analogue by mouse liver S9 and their antimalarial activity against plasmodium malaria parasite. J Med Chem. 2003;46:4351–9. doi: 10.1021/jm0302086. [DOI] [PubMed] [Google Scholar]
- 11.Dei-Cas E, Slomianny C, Charet P, Prensier G, Ajana F, Ramage C, et al. In vitro growth and chloroquine sensitivity of Plasmodium falciparum (FCR-3 strain) in red blood cells containing HbC. Parasitol Res. 1987;73:306–12. doi: 10.1007/BF00531083. [DOI] [PubMed] [Google Scholar]
- 12.Chen IJ, Foloppe N. Drug-like Bioactive structures and conformational coverage with the LigPrep/ConfGen Suite: Comparison to programs MOE and catalyst. J Chem Inf Model. 2010;50:822–39. doi: 10.1021/ci100026x. [DOI] [PubMed] [Google Scholar]
- 13.Yazal JE, Prendergast FG, Shaw DE, Pang YP. Protonation states of the chromophore of denatured green fluorescent proteins predicted by ab initio calculations. J Am Chem Soc. 2000;122:11411–5. [Google Scholar]
- 14.Schneebeli ST, Hall ML, Breslow R, Friesner R. Quantitative DFT modeling of the enantiomeric excess for dioxirane-catalyzed epoxidations. J Am Chem Soc. 2009;131:3965–73. doi: 10.1021/ja806951r. [DOI] [PMC free article] [PubMed] [Google Scholar]
- 15.Mehdipour AR, Safarpour MA, Taghavi F, Jamali M. Density functional theory-based Quantitative Structure Activity Relationship (QSAR) study of alkanol and alkanthiol derivatives. QSAR Combi Sci. 2009;28:568–75. [Google Scholar]
- 16.Deeb O, Clare BW. Comparison of AM1 and B3LYP-DFT for Inhibition of MAO-A by Phenylisopropylamines: A QSAR Study. Chem Biol Drug Des. 2008;71:352–62. doi: 10.1111/j.1747-0285.2008.00643.x. [DOI] [PubMed] [Google Scholar]
- 17.Dixon SL, Smondyrev AM, Rao SN. PHASE: A novel approach to pharmacophore modeling and 3D database searching. Chem Biol Drug Des. 2006;67:370–2. doi: 10.1111/j.1747-0285.2006.00384.x. [DOI] [PubMed] [Google Scholar]
- 18.Evans AA, Doman TN, Thorner DA, Bodkin MJ. 3D QSAR methods: Phase and catalyst compared. J Chem Inf Model. 2007;47:1248–57. doi: 10.1021/ci7000082. [DOI] [PubMed] [Google Scholar]
- 19.Narkhede SS, Degani MS. Pharmacophore Refinement and 3D-QSAR Studies of Histamine H3 Antagonists. QSAR Comb Sci. 2007;26:744–53. [Google Scholar]
- 20.Watts KS, Dalal P, Murphy RB, Sherman W, Friesner RA, Shelley JC. Conf gen: A conformational search method for efficient generation of bioactive conformers. J Chem Inf Model. 2010;50:534–46. doi: 10.1021/ci100015j. [DOI] [PubMed] [Google Scholar]
- 21.Tawari NR, Bag S, Degani MS. Pharmacophore mapping of a series of pyrrolopyrimidines, indolopyrimidines and their congeners as multidrug resistance-associated protein (MRP1) modulators. J Mol Model. 2008;14:911–21. doi: 10.1007/s00894-008-0330-z. [DOI] [PubMed] [Google Scholar]
- 22.Gmiz-Hernndez AP, Artur S, Galstyan, Knapp EW. Understanding Rubredoxin redox potentials: Role of H-bonds on model complexes. J Chem Theory Comput. 2009;5:2898–908. doi: 10.1021/ct900328c. [DOI] [PubMed] [Google Scholar]
- 23.Wold S, Geladi P, Esbensen K, Öhman J. Multi-way principal components-and PLS-analysis. J Chemom. 1987;1:41–56. [Google Scholar]
- 24.Li Y, Wang Y, Zhang F. Pharmacophore modeling and 3D-QSAR analysis of phosphoinositide 3-kinase p110α inhibitors. J Mol Model. 2010;16:1449–60. doi: 10.1007/s00894-010-0659-y. [DOI] [PubMed] [Google Scholar]


