Abstract
We conducted numerical experiments to study the influence of non-propagating longitudinal and circular contractions, i.e. pendular activity and segmentation, respectively, on flow and mixing in the proximal duodenum. A lattice-Boltzmann numerical method was developed to simulate the fluid mechanical consequences for each of 22 randomly selected sequences of high-definition video of real longitudinal and radial contractile activity in the isolated proximal duodenum of the rat and guinea pig. During pendular activity in the rat duodenum, the flow was characterized by regions of high shear rate. Mixing was so governed by shearing deformation of the fluid that increased the interface between adjacent domains and accelerated their inter-diffusion (for diffusion coefficients approx. less than 10−8 m² s−1). When pendular activity was associated with a slow gastric outflow characteristic of post-prandial period, the dispersion was also improved, especially near the walls. Mixing was not promoted by isolated segmentative contractions in the guinea pig duodenum and not notably influenced by pylorus outflow. We concluded that pendular activity generates mixing of viscous fluids ‘in situ’ and accelerates the diffusive mass transfer, whereas segmentation may be more important in mixing particulate suspensions with high solid volume ratios.
Keywords: small intestine, mixing, viscosity, gastrointestinal flow, lattice Boltzmann, diffusion
1. Introduction
The proximal small intestine is an important site for the physical and chemical processing of digesta. A number of workers have suggested [1,2] that the gastrointestinal tract can be represented as a series of chemical reactors. Their conclusions showed that for tubular reactors, such as the small intestine to function efficiently, conditions within the lumen must resemble those in a longitudinal array of perfectly mixed stirred tank reactors with ongoing slow axial transfer of reactants between them [3,4]. Such findings underscore the need for zones within the lumen of the small intestine [3,4] in which there is efficient mixing with little propulsion and for quantitative evaluation of the behaviour of digesta during such non-propagating contractile activity [5].
Most studies of intestinal mixing have investigated the influence of propagating coordinated circular and longitudinal contractions, i.e. peristaltic activity that propels the luminal content along the small intestine [6–9], while mixing generated by non-propagating circular contractions, i.e. segmentation [10–12] and non-propagating longitudinal contractions, i.e. pendular contractions [13], has not been rigorously evaluated, chiefly as the relative magnitudes of the component contractile processes have not been quantified until recently [10,14]. We hypothesized that non-propagating contractions should allow an efficient mixing of the lumen contents in the absence of propulsion. Early workers concluded that longitudinal contractions alone could induce flow between the core and the periphery of the luminal content [13] and generate laminar mixing [15]. However, these conclusions were not supported by detailed physiological data. In vitro and analytical models of segmentation [16] have served to demonstrate the influence of the symmetry and mobility of the contraction on absorption but again lack the necessary physiological detail to obtain quantitatively reliable results.
The recent development of high-resolution spatio-temporal mapping techniques to quantify the circular and longitudinal components of contractile activity in isolated segments of the gastrointestinal tract [17] in conjunction with the development of numerical methods that are capable of modelling gastrointestinal flows with complex geometries [7,18–20] offer a more precise means of evaluating the effects of various contractile processes on flow and mixing in the small intestine. Furthermore, the recent description of the component zones of longitudinal contractions in discrete stationary domains that together engender pendular movements [14] in the proximal duodenum (the region between the pylorus of the stomach and the pancreatic duct) enables the effects on mixing to be modelled (figure 1). Furthermore, the direct incorporation of these recorded datasets into suitable fluid mechanical models may allow a more detailed evaluation of the mechanics of the mixing that they engender.
Figure 1.

Spatio-temporal organization of pendular activity in the proximal duodenum of the rat (adapted from [14]). (a) Preparation, (b) strain rate map (% s–1), (c) amplitude diagram and (d) phase diagram. (a) Rat proximal duodenum with the pylorus on the left and the pancreatic duct on the right. The strain rate map (b) presents four spatial domains (asterisks, *). In each of them, the strain rate oscillates between a minimal and a maximal value. (c) The strain rate amplitude at the dominant frequency as a function of the duodenum length. Local maxima in strain rate amplitude (*) vary in position within each domain. The phase diagram at the dominant frequency (d) presents steps between each domain of about 180°.
The aim of this study was to investigate the fluid mechanical consequences of pendular activity, segmentation and pyloric outflow in the isolated proximal duodenum of the rat and guinea pig and to explore the effect of (Newtonian) viscosity of the luminal content on mixing. After defining the conditions that govern bulk flow in the duodenal lumen, we developed three sets of boundary conditions (BC) by which the radial and longitudinal velocity of the walls set the luminal content in motion. The first (BC1) was based on parameters derived by analysis of longitudinal strain rate maps of pendular activity in the rat duodenum and was used to describe the general characteristics of pendular flow. The second (BC2) and third (BC3) BCs incorporated real-time data from 22 randomly selected high-definition video sequences of pendular activity in the isolated proximal duodenum of the rat (BC2) and of segmentation in the guinea pig (BC3) and were used to examine flow and mixing generated by real motility.
2. Material and methods
2.1. Assumptions regarding bulk flow in the duodenal lumen
The proximal duodenum was modelled as a tube of diameter D (m) and length L (m) between the pylorus and the pancreatic duct. The flow generated by non-propagating contractions was modelled using the incompressible Navier–Stokes equations. The rheological properties of the chyme depend on the digestive phase and are so temporally inconsistent. We restricted our analysis to homogeneous Newtonian chyme with a constant viscosity μ (Pa.s). The role of non-Newtonian behaviour will be discussed later. Three levels of viscosity were examined 1 (i.e. water), 10 and 100 mPa.s. We assumed that the characteristics of the contractile activity were independent of the viscosity of the lumen contents. This hypothesis was based on the observations that the spatio-temporal characteristics of circular and longitudinal contraction during propagating peristalsis in the terminal ileum of the possum did not vary with the apparent viscosity of the perfusate [21].
2.1.1. Dimensionless numbers governing the flow
To facilitate the analysis of flow, we reformulated the Navier–Stokes equations in a dimensionless form to enable the parameters to be regrouped as dimensionless variables. Hence, variables with dimensions such as velocity were scaled by their appropriate characteristic values to give the dimensionless form. The characteristic values included the characteristic velocity of the flow Vc (m s–1) that corresponded to the maximal longitudinal or radial velocity of the wall, the diameter of the duodenum D and the fluid density ρ (=103 kg m−3 in the whole paper). The dimensionless values are identified by the symbol. Thus, we have
where u is the velocity field (m s−1), x the longitudinal abscissa (m), y the radial abscissa (m), t the time (s), p the pressure (Pa) and  the shear rate (s−1).
The flow is governed by the Reynolds number Re which represents the ratio of the inertial forces to the viscous forces and is defined by
| 2.1 |
Classically, the flow in a tubular conduit is turbulent when Re is high. Such turbulence leads to the formation of unstable eddies of differing scales that promote efficient and rapid mixing of fluids. However, intestinal flows are generally characterized by Reynolds numbers below 200 [7,8], so that flow is laminar and mixing by advection is correspondingly more limited. An extreme case of laminar flow, termed Stokes flow, occurs when the Reynolds number approaches zero, i.e. when the viscosity of the lumen content is very high. Under such conditions, flow is reversible [22], i.e. a fluid element that is displaced by a deformation of the wall will return to its original position as the deformation relents.
As pendular contractions vary cyclically with time at a frequency f (Hz), flow is pulsatile and can be described by the Strouhal number Sr which represents the ratio of the timescale of the longitudinal activity 1/f to the timescale of the flow D/Vc and is defined by
| 2.2 |
Pulsatile flow can also be characterized by the Womersley number Wo, a procedure that is more popular in physiology and biofluidics than the use of the Strouhal number Sr [23,24]. In effect Wo is a combination of Re and Sr
 |
2.3 |
The Womersley number can be viewed as the ratio of the diameter of the intestine D to the depth of the layer of fluid  that oscillates against the wall. When both Sr and Wo are low, flow occurs in a ‘quasi-steady’ manner [24], i.e. the instantaneous flow rate is given by the instantaneous pressure gradient any movements at the boundary with the contracting wall are readily transmitted through the adjacent fluid and the thickness of the oscillating fluid layer is maximized. Flow characteristics depart progressively from this behaviour. As conditions change to increase the values of the two dimensionless parameters [24], BCs are less readily transmitted through the adjacent fluid and the oscillating boundary layer of fluid becomes thinner.
2.1.2. Oral and aboral conditions
In a first step, we defined oral and aboral conditions so as to avoid inducing extraneous flow phenomena. Null radial velocity components and pressures were imposed at the oral and aboral ends of the duodenum, and the flow field was defined as null at the commencement of the simulation.
In a second step, we modelled the simultaneous effects of the pyloric outflow of chyme from the stomach and pendular activity on mixing during post-prandial period (the phase following the ingestion of a rich nutrient meal). The velocity profile at the level of the pylorus was assumed to be parabolic (i.e. Poiseuille flow) with a maximal velocity of 0.2 mm s−1. This order of magnitude was determined by considering that the residence time of the chyme in proximal duodenum of the rat during the post-prandial period is around 3 min [25], and the length of the duodenum was around 40 mm [14]. Two situations were explored in the second step, firstly assuming that gastric emptying resulted simply from a sustained increase in fundal and corporal tone [18,26] inducing a constant inflow of chyme, and secondly assuming sinusoidal modulation of inflow by antral contraction waves [18,26] with a frequency of five cycles by minute for the rat [27] and a mean maximal velocity of 0.2 mm s−1.
2.2. Boundary conditions during contraction
Three sets of BCs were developed that determined the position and the longitudinal or radial velocity of the walls of the duodenum during contractile activity.
2.2.1. BC1: simplified pendular activity
Pendular activity was modelled by dividing the proximal duodenum into four domains of contractile activity (figures 1 and 2) each of length 2l with half domains each of length l at the two ends. The longitudinal strain ɛ was defined by ΔL/L, where L is the length of a segment of muscle and ΔL its change of length owing to muscle contraction. The cyclic variation of the longitudinal strain rate  (= ∂ɛ/∂t, s−1), i.e. the rate of local lengthening (if
  ) or shortening (if
  ), along the mesenteric and anti-mesenteric axis that occurred in each specific domain was represented by a sinusoidal function
| 2.4 |
where t is the time, x the longitudinal abscissa, ϕ the phase and A(x) the strain rate amplitude. For each domain, A(x) was parametrized by a parabola of centre x0
| 2.5 |
The longitudinal velocities V(x,t) of the walls were determined by integration of equation (2.4).
Figure 2.
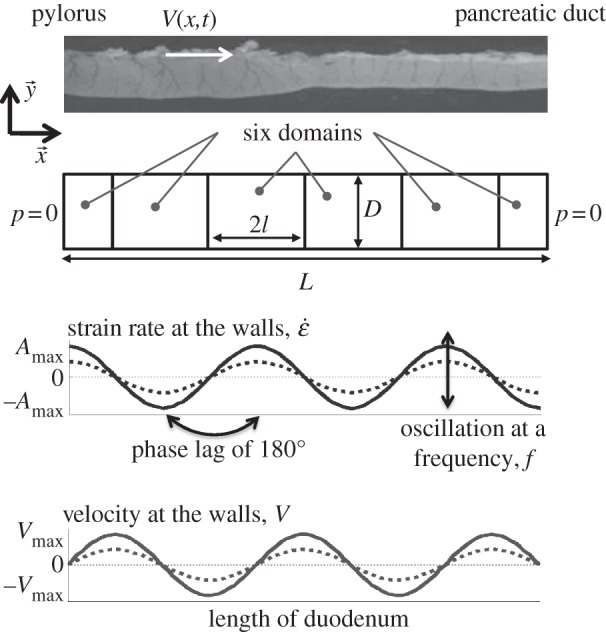
Simplification of pendular activity in the duodenum of the rat and notations used in the first BCs BC1. The proximal duodenum comprises four domains of equal length 2l and two half domains of length l at each end of the duodenum. At the mesenteric and anti-mesenteric surfaces, the strain rate  , with which the walls shorten, oscillates at a frequency f and with a phase lag of 180° between adjacent domains. The velocities V (used as BCs in the model) were directly determined by integration of the strain rate
  along the length of the duodenum. The pressures p at the pylorus and the pancreatic duct are designated as equal.
A ratio L/D of five and a phase lag of 180° were used as a base case, in the numerical simulations (table 1). This resulted in the maximal longitudinal velocity Vmax for each domain being given by
| 2.6 |
Table 1.
Parameters of pendular activity and of segmentative activity in the proximal duodenum of the rat and the guinea pig, respectively.
| symbol | typical value | references | |
|---|---|---|---|
| pendular activity—proximal duodenum of the rat | |||
| maximal amplitude of strain rate | Amax | 0.09–0.21 s−1 | [14] |
| diameter of the duodenum | D | 4–6 mm | [14] |
| frequency | f | 0.56–0.64 Hz | [14] |
| length of a domain | 2l | 7.5–11.2 mm | [14] |
| duodenum length | L | 40–45 mm | [14] |
| number of domains | N | 4–6 | [14] |
| maximal longitudinal velocity | Vmax | 0.4–1.6 mm s−1 | equation (2.6) |
| phase lag between adjacent territories | ϕ | 135°–225° | [14] |
| viscosity of the chyme | μ | more than 1 mPa.s | |
| Reynolds number | Re | 0–10 | equation (2.1) |
| Strouhal number | Sr | 1–10 | equation (2.2) |
| Womersley number | Wo | 0–10 | equation (2.3) |
| segmentation—proximal duodenum of the guinea pig | |||
| relaxation time | a1 | 0.6–0.9 s | calculated from [14] |
| diameter of the duodenum | D | 4.5–8.1 mm | calculated from [14] |
| length of a domain | 2l | 3.0–8.8 mm | [14] |
| maximal radial velocity | Umax | 2.4–5.4 mm s−1 | calculated from [14] |
| viscosity of the chyme | μ | more than 1 mPa.s | |
| Reynolds number | Re | 0–43 | equation (2.1) |
The values for the parameters in these equations (table 1) were obtained from one-dimensional fast Fourier analysis of maps of longitudinal strain rate reported in the proximal duodenum of the rat (figure 1) [14].
The results are given for a pseudo-steady state, i.e. the flow parameters depend only on the time relative to one cycle of activity, and the variables, as the pressure p, are averaged over one-half cycle
| 2.7 |
2.2.2. BC2: real pendular activity
Pairs of longitudinal strain rate maps were acquired from five separate ex vivo preparations of the proximal duodenum of the rat (figure 1) [14]. Each pair described the spatio-temporal evolution of longitudinal contractions along the mesenteric and anti-mesenteric surfaces, respectively. This allowed for any effects of the asymmetry of the contractile activity on the flow features to be incorporated into the analysis. Ten representative video sections, each of 20 s duration (five rats × two sequences) were sampled from sequences that showed arrays of non-propagating longitudinal contractions organized into domains (figure 1). After interpolation of the strain rate maps to correspond to the mesh of the numerical model, the longitudinal velocity of the mesenteric and anti-mesenteric surfaces were determined by integration in the space dimension.
Circular activity and consequent alterations in wall thickness was neglected in this situation as no noteable passive bulging of the wall was observed during longitudinal shortening and non-propagating circular contractions were of low amplitude in the duodenum of the rat (less than 15% of the diameter at rest) [14].
After simulation, the absolute value of the data of interest, as the pressure p, was averaged over 20 s for each spatial-coordinate
| 2.8 |
2.2.3. BC3: real segmentative activity
Segmentative contractions occur singly in the isolated guinea pig proximal duodenum and are not temporally and spatially synchronized [10,14] in the manner described by Cannon [11]. We therefore modelled the flow during each of 12 randomly chosen isolated contractions (four guinea pigs × three examples). Each contraction was individually parametrized. The evolution of the diameter was fitted with the function
| 2.9 |
where D0 is the diameter at rest, a1 a time constant characteristic of the relaxation and a0(x) corresponds to the dependence of the diameter on a spatial dimension that was close in form to that of a parabola (R2 ≈ 0.95)
| 2.10 |
where Umax is the maximal radial velocity in the centre of the contraction, x0 the centre of the contraction and 2l the length of the contraction. The length of the contractile domain was about 6 mm [14]. D0, a1 and Umax were determined by fitting equation (2.9) to the data using a least-square fitting procedure (table 1). The radial velocity of the boundary was determined by taking the derivative of equation (2.9)
| 2.11 |
2.3. Evaluation of intestinal mixing
The displacement of 150 small and massless particles spaced regularly within the lumen was calculated so as to assess the extent to which contained material could be advected by the flow field.
We examined the extent to which deformations in the flow of the contents increased the lengths of interfaces between different elements of fluid and hence improved the diffusion process between them. The parameter of interest in this case was the shear rate component of the strain rate field of the flow noted  (in s−1)
| 2.12 |
where u and v are the axial and radial velocity, respectively.
We determine the dispersion of a diffusive tracer from its starting position comprising three pairs of lines that were oriented radially across the lumen, each pair being located so as to be in the middle of a domain of contraction during pendular activity. The resulting concentration field was compared with that from a case where molecular dispersion was restricted to diffusion. Given that the residence time of the chyme in the rat proximal duodenum during post-prandial period is around 3 min [25], we modelled periods of video activity of 4 min duration that consisted mainly of pendular activity. The evolution of the concentration C of this tracer was modelled by the advection–diffusion equations
| 2.13 |
where α is the diffusion coefficient. The flux of the diffusive tracer was null at all the boundaries of the duodenum. The temporal evolution of the variance of the concentration field was calculated to quantify and compare the impact of the intestinal motility on mixing.
2.4. Numerical resolution by the lattice-Boltzmann method
The use of the lattice-Boltzmann method (LBM) for solving Navier–Stokes equations has only relatively recently been described. Contrary to other computational fluid dynamics methods, instead of solving the discretized Navier–Stokes equations, LBM simulates the streaming and collision processes that result from the longitudinal and radial movements of the walls, across a limited number of particles interacting on a network of nodes within the duodenal lumen. The velocity and pressure fields can then be calculated. The LBM is capable of modelling complex flow phenomena as flow with deformable boundaries on a Cartesian mesh [28,29] without the remeshing methods that are generally used with finite-element methods. Motility data obtained by spatio-temporal mapping can be easily incorporated in the model. The LBM has been successfully used to model gastric flow [18] and the coupling of micro- and macro-flow around small intestinal villi [19,20].
We used a lattice-Boltzmann BGK scheme (LBGK) developed by Guo et al. [30] as, unlike other LBGK schemes, the use of this method allows the incompressible Navier–Stokes equations to be exactly recovered [30].
The geometry of the duodenum was modelled only in two dimensions in order to reduce the computational time. Previous comparisons of flow patterns in two-dimensional models of the intestine with those in axisymmetric geometries have shown that two-dimensional models capture similar fluid motions and produce only modest quantitative differences in pressure and velocity [31,32]. More importantly, this simplification was necessary to incorporate real experimental data as these were derived from videos, i.e. were measured in two dimensions.
The oral and oboral pressure and velocity conditions were modelled using the non-equilibrium extrapolation method of Guo et al. [33].
For each location and each time step, the longitudinal and radial displacement of the walls calculated with each of the three types of BCs (§2.2) were incorporated in a numerical scheme that considered moving and curved BCs. The less computationally intensive and second-order methods were based on an interpolation method developed by Filippova & Hanel [34] and improved by Mei et al. [35], which is more accurate in regard to flux, forces at the wall and vorticity than are other methods of interpolation [36].
The advection–diffusion equations (equation (2.13)) were solved by the revised moment propagation method for scalar transport proposed by Yu et al. [37].
The set of equations was solved directly in Matlab R2010b (The Mathworks, Natick, MA). Preliminary numerical simulations indicated that to obtain a sufficiently high degree of computational accuracy the radius of the duodenum must be meshed with a minimum of 30 cells.
Two benchmarks were used to validate the implementation of the LBM.
The two-dimensional unsteady Womersley flow [23,24] was solved on a domain of 30 × 30 nodes under periodic BCs. The relative error with the analytical solution [24] was calculated with
 |
2.14 |
where u is the axial velocity calculated with the model and uexact the exact solution. E2 was 3.4 × 10⁻³ and 1.7 × 10⁻³ for Wo of 5 and 1, respectively. So, the model was able to simulate unsteady flow accurately.
To analyse the accuracy of the boundary treatment, the flow generated by a travelling wave with a sinusoidal shape in two different frames of reference was simulated under periodic BCs on a grid of 40 × 100. The wavelength was 100 and the amplitude was 14 cells. In the first case, the wave moved axially with a velocity of 0.05, whereas in the second case the wave was steady and the upper boundary moved axially with a velocity of −0.05. When reported in the same frame of reference, both flows are equivalent. The error E2 (equation (2.14)) for the axial, radial velocity and the pressure were 4.7 × 10⁻³, 6.3 × 10⁻² and 5.4 × 10⁻², respectively. These results were consistent with those obtained by Wang et al. [19] with a different lattice-Boltzmann model. Hence this procedure demonstrated that moving boundaries could be incorporated without causing numerical inconsistency.
2.5. Statistical analysis of the flow parameters
When necessary, flow parameters were transformed using the Johnson transformation algorithm in MINITAB (Sydney, Australia) to obtain a normal distribution. They were subsequently analysed in the SYSTAT software suite, v. 11 (Chicago, IL, USA) by two-way ANOVA with ‘Rat’ and ‘Viscosity’ as factors. When significant overall differences were obtained (p < 0.05), the effects of the various factors were compared by Bonferroni post hoc comparison. The values are given as the mean ± s.d.
3. Results
3.1. Influence of dimensionless parameters on pendular flow (BC1)
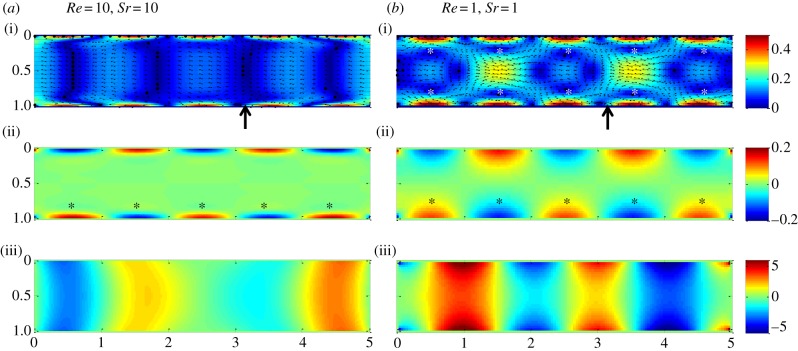
In the proximal duodenum of the rat, the Reynolds number varied between 0 and 10 during pendular contraction (table 1). Similarly, the Strouhal and Womersley numbers varied between 1 and 10, and between 0 and 10, respectively. The simulations conducted with the BCs of simplified pendular activity (BC1) showed that flow was pulsatile and the flow parameters oscillated between a negative and positive value. Maps of velocity and shear rate fields (figure 3) showed that the strongest fluid motions and greatest shear rates were localized at the walls and located at the junctions of successive contractile domains.
Figure 3.
(a,b) Showing (i) variation in flow, (ii) shear rate and (iii) pressure fields with the Reynolds, Re and Strouhal, Sr numbers obtained using the simplified model of pendular activity in the duodenum of the rat (BC1, figure 2). The velocity, the shear rate and the pressure were each averaged over half of the period of the cycle of muscular contraction. The vector field shows the mean direction of flow of chyme during this time. Two main types of flow regime were identified depending on the magnitude of Re and Sr (see text). Arrows indicate transects location used for figure 4.
Two flow regimes could be distinguished. The first was obtained when Re and Sr were large (i.e. with high Wo). In this case, the flow and regions of greatest shear rate were confined to a thin oscillating boundary layer (figures 3 and 4) that remained close to the walls. The second was obtained when Re and Sr were small (i.e. small Wo), the longitudinal velocity of the wall propagated further into the lumen, i.e. further along the radial dimension towards the central longitudinal axis, and symmetrical vortices developed between adjacent domains (figures 2 and 4). The direction of rotation of fluid particles inside a vortex varied from clockwise to anti-clockwise during a period of longitudinal muscle contraction. As Re and Sr tended to zero, the flow tended to an asymptotic solution that corresponded to the ‘quasi-steady’ flow, where the BCs were fully transmitted across the radial dimension.
Figure 4.
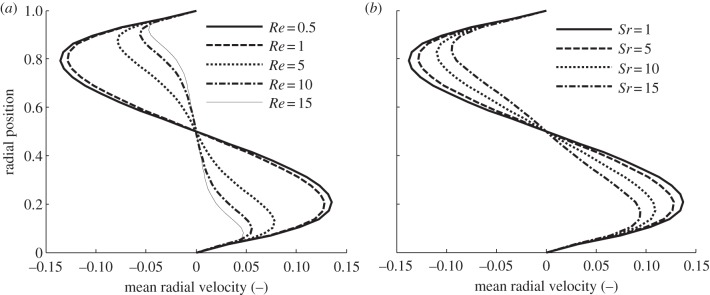
Influence of the Reynolds, Re (a) and the Strouhal, Sr (b) numbers on the dimensionless mean radial velocity at a transect through the gut obtained from the simplified model of pendular activity in the duodenum of the rat (BC1, figure 2) at (a) Sr = 5 and (b) Re = 1, respectively. The transect was located between adjacent vortices traversing the point where the radial component of velocity is the most developed (indicated by the arrows on figure 3). When either Re or Sr increase, the radial velocity profile becomes progressively less developed and more constrained to regions near the walls. Conversely at low Re or Sr the radial velocity profile tends to an asymptotic solution (bold solid line).
3.2. Effects of real pendular activity on mixing (BC2)
In line with the previous results, radial velocity values averaged over 20 s (i.e. about 14 cycles of activity; figure 5) showed a tendency for higher values to be grouped in regions of the lumen field that corresponded to longitudinal contractile domains. The amplitudes of radial velocities with fluids of lower viscosity (1 mPa.s) were lower than those with fluids of higher viscosity (10 mPa.s). The maximal radial velocity was around 80 µm s−1 with a viscosity of 1 mPa.s (N = 10) (table 2), the velocity of the lumen contents being no further augmented by any additional increase of their viscosity above 10 mPa.s (table 2).
Figure 5.
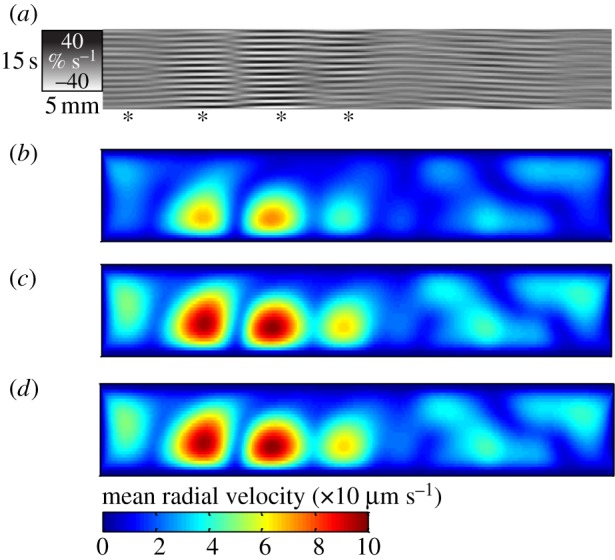
Results from modelling (BC2) of a 20 s period of spatio-temporally mapped pendular activity in the duodenum of the rat showing the effect of the viscosity of the luminal content on local radial velocity. The strain rates map (a) shows four active domains in the first 30 mm of the duodenum (*). The vertical direction corresponds to the time and the horizontal direction corresponds to the distance along the duodenum. The grey scale corresponds to the strain rate. Absolute values ((b) 1 mPa.s, (c) 10 mPa.s, (d) 100 mPa.s) of radial velocities at each location are averaged over 20 s and plotted as isovalue maps whose axes correspond to the axial and radial dimensions of the proximal duodenum (b–d). The domain of each longitudinal contraction corresponds to a zone of higher velocity. The zone is located nearer to the anti-mesenteric (lower) than the mesenteric wall as a result of radial asymmetry in the amplitude of longitudinal contractions. The flow is less developed at low viscosity (b) than at high viscosity (c,d).
Table 2.
Variation in descriptors of the mean radial flow (in ×10 µm s–1) and shear rate (in s−1) field with viscosity obtained with model incorporating data from real pendular activity (BC2) in the proximal duodenum of the rat (N = 10). Results are given as mean ± s.d. p < 0.05 is indicated by different letters (a) and (b).
| viscosity | 1 mPa.s | 10 mPa.s | 100 mPa.s |
|---|---|---|---|
| maximal axial velocity | 6.0 ± 2.0 (a) | 7.7 ± 2.8 (b) | 7.6 ± 2.4 (b) |
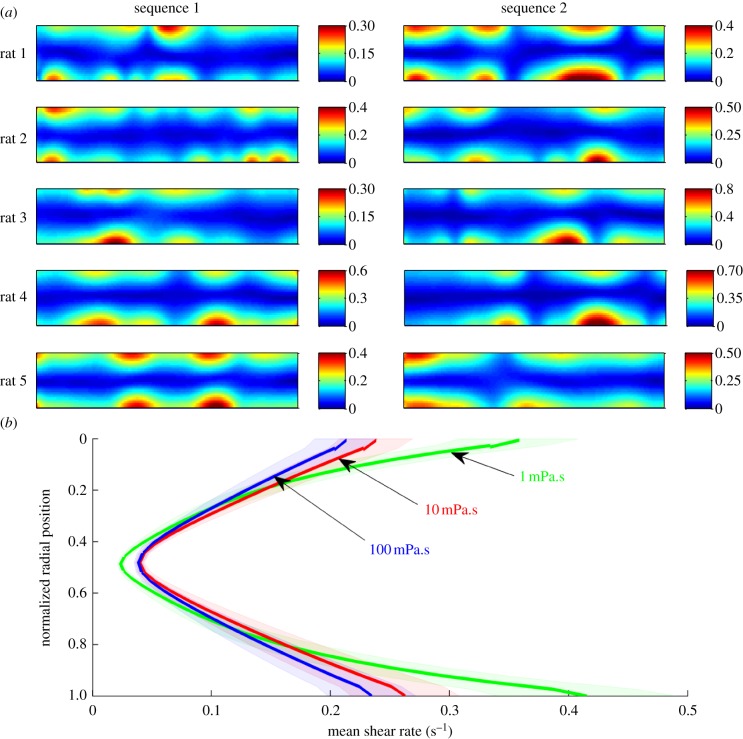
| mean shear rate at the mesenteric surface | 0.36 ± 0.10 (a) | 0.24 ± 0.06 (b) | 0.21 ± 0.06 (b) |
| mean shear rate in the middle of the lumen | 0.024 ± 0.006 (a) | 0.039 ± 0.006 (b) | 0.039 ± 0.008 (b) |
| mean shear rate at the anti-mesenteric surface | 0.41 ± 0.14 (a) | 0.26 ± 0.08 (b) | 0.23 ± 0.08 (b) |
| shear rate averaged on all the lumen | 0.15 ± 0.04 (a) | 0.13 ± 0.02 (a) | 0.11 ± 0.02 (a) |
| maximal shear rate | 0.85 ± 0.36 (a) | 0.51 ± 0.16 (b) | 0.47 ± 0.14 (b) |
The displacement of massless particles (figure 6) were influenced by fluid inertia of the contents such that the position around which they oscillated moved about 300 µm in the axial direction and 30 µm in the radial direction over a period of 20 s when the viscosity was low (1 mPa.s). Hence globally, the flow was not fully reversible, however, the net axial flow generated by pendular activity in one direction or the other was negligible compared with the amplitude of the oscillation.
Figure 6.
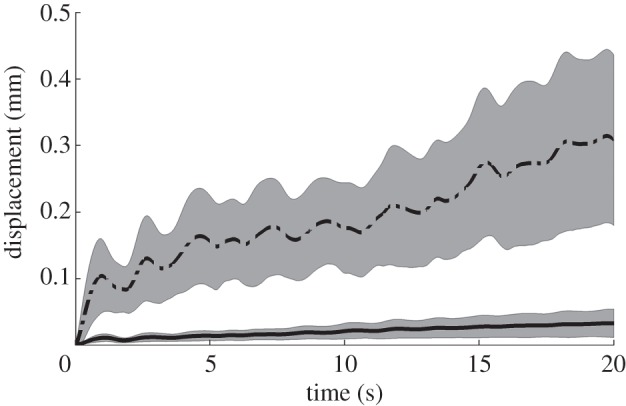
Results from modelling (BC2) of 20 s sequences of spatio-temporally mapped pendular activity in the duodenum of the rat showing their effect on advection. Cumulative mean radial (dashed line) and axial (solid line) displacements of small particles (five rats × two sequences × 150 particles) over time resulting from flow advection with chyme viscosity at 1 mPa.s. The limits of the shaded areas correspond to ±s.d./2.
Comparisons of the spatial patterns of variation in shear rate across the field of the lumen (figure 7) when the viscosity of the lumen content was 10 mPa.s showed asymmetrical regions of high shear rate that were interspersed between adjacent contractile domains owing to the asymmetry of the contractions. The pattern of local variation in shear rate varied within between preparations (figure 7). The various parameters that described the shear rate field (table 2) differed significantly only when the viscosity of the lumen content was increased from 1 to 10 mPa.s, but not when it was further increased, i.e. from 10 to 100 mPa.s. Between 1 and 100 mPa.s, the maximal shear rate was significantly reduced from a factor 1.8 (from 0.85 to 0.47 s−1).
Figure 7.
Results from modelling (BC2) of two 20 s sequences of spatio-temporally mapped pendular activity in the ex vivo duodenum of five rats showing variation in the spatial patterns of shear rate with the viscosity. (a) Isovalues of shear rate for a viscosity of 10 mPa.s. The absolute value of the shear rate was averaged at each location over each 20 s time sequence to produce a map of isovalues whose axis represent the axial and radial dimensions of the proximal duodenum. The regions of highest shear rate are spaced between adjacent contractile domains and are localized near the walls (figure 2). The shear rate is radially asymmetric as a result of radial asymmetry of the longitudinal contractions. (b) Variation in distribution of shear rate across the radial dimension of the lumen with viscosity. For each rat and each sequence, the absolute value of the shear rate was first averaged in the axial direction of the duodenum and subsequently these means were averaged for all the rats and all the sequences (solid lines). The limits of the envelope curves correspond to ±s.d./2.
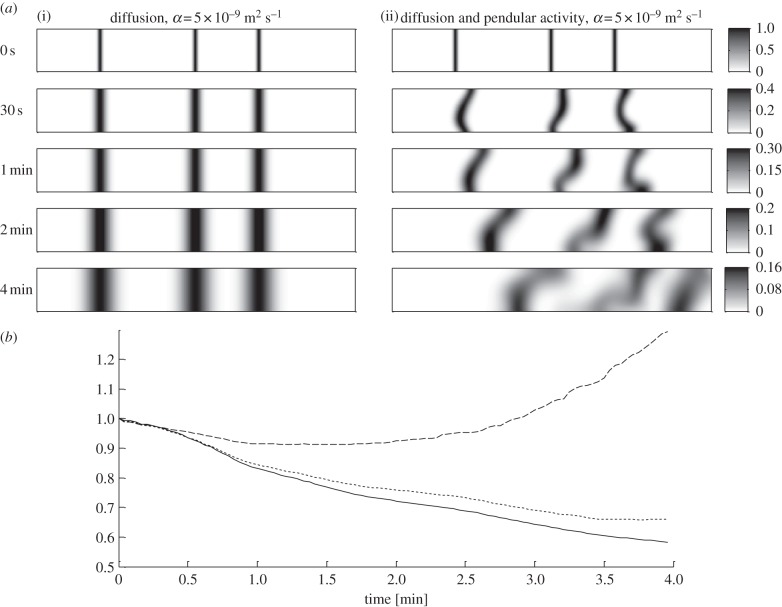
The shear generated by pendular activity increased the interface between adjacent domains and hence improved mixing by diffusion. Observation of the degree of deformation and change in breadth of local regions in the initially radially orientated lines of the diffusive tracer over time confirmed this behaviour (figure 8a). The deformation of the lines of tracer oscillated at the frequency of the longitudinal contractions augmenting overall diffusion by expanding the length of the lines (and hence the area of interface) and displacing the developing diffusion gradient to give a smudging effect. When the diffusion coefficient of the marker was below approximately 10−8 m² s−1 the influence of pendular activity on axial dispersion was greater than that in the purely diffusive case (see figure 8b and electronic supplementary material, figure S1). These relative effects increased as the diffusion coefficient decreased. Conversely, when the diffusion coefficient of the marker was greater than approximately 5×10⁻⁸ m² s−1, the shearing deformations generated by pendular activity were too small to improve diffusive mass transfer.
Figure 8.
Results from modelling (BC2) of 4 min sequences of spatio-temporally mapped pendular activity in the ex vivo duodenum of a rat showing the influence of different diffusion coefficients α on mixing. Three radially orientated lines of a diffusive tracer (α = 5×10⁻⁹ m2 s−1) were placed between adjacent longitudinal contractile domains (see §2). (a) The evolution of the tracer during 4 min of pendular activity plus diffusion (ii) is compared with the case where the process is purely diffusive (i). The shear generated during pendular activity deforms the chyme, increases the size of the interface between adjacent domains and accelerates diffusive mass transfer across the longitudinal dimension. (b) Shows the temporal evolution of the ratio of the variances of concentration obtained with pendular activity plus diffusion to those obtained with diffusion alone using tracers with different diffusion coefficients α (dashed line, α = 5 × 10⁻⁸ m2 s–1; dotted line, α = 1 × 10⁻⁸ m2 s–1; solid line, α = 5 × 10⁻⁹ m2 s–1; see also the electronic supplementary material, figure S1).
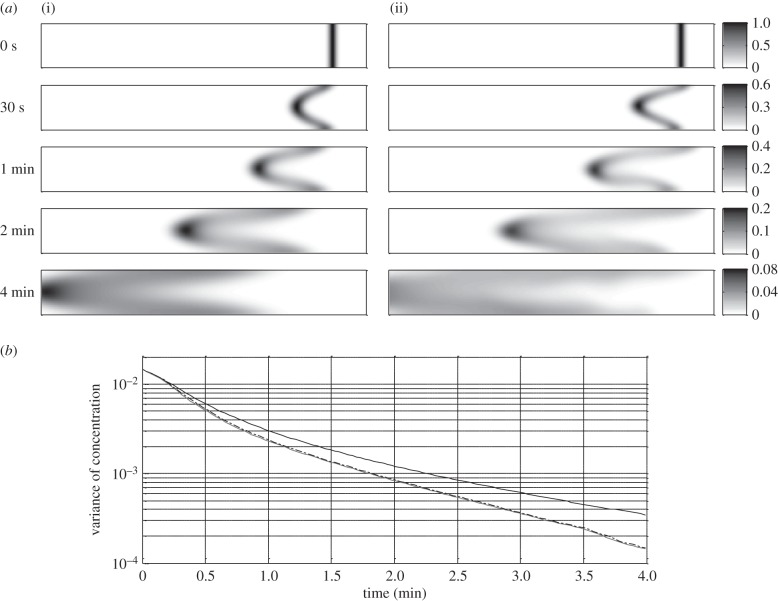
When pendular activity was associated with pyloric outflow, the dispersion was improved, mainly near the walls of the duodenum, compared with the case where mass transfers were only driven by pyloric outflow and diffusion (figure 9a). The variance of concentration decreased more quickly in the first than in the second case (figure 9b), but the pattern of pyloric outflow (i.e. steady or oscillating) did not appear to influence the outcome.
Figure 9.
Results from modelling (BC2) of 4 min sequences of spatio-temporally mapped pendular activity in the ex vivo duodenum of a rat associated with pyloric outflow and diffusion (see §2) showing the influence on longitudinal dispersion. A radially orientated line of a diffusive tracer (α = 5×10⁻⁹ m2 s−1) was placed at the site of the pylorus. (a) The evolution of the tracer during 4 min of pendular activity along with steady pyloric outflow and diffusion (ii) is compared with the case where the dispersion is governed by steady pyloric outflow and diffusion with no pendular activity (i). (b) Compares the temporal evolution of the variance of the concentration when a steady (grey line) or oscillating gastric outflow (dashed-dotted line) is associated with pendular activity and diffusion with the case where there is no pendular activity (black line).
3.3. Effects of real segmentative activity on mixing (BC3)
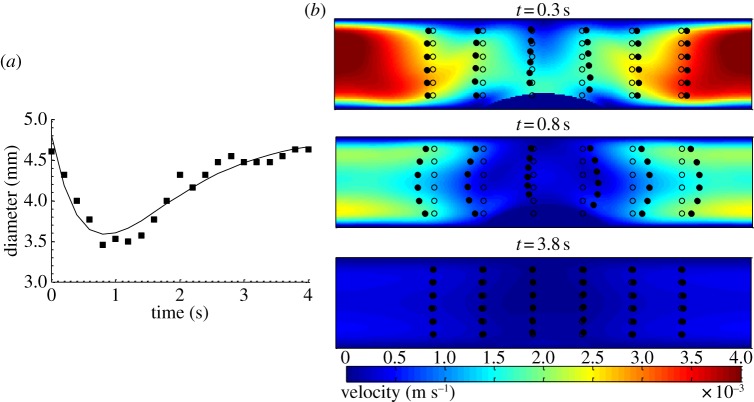
Observations of the displacement of small particles (figure 10) showed that they were advected by the flow generated during segmentative contractions, but that they returned to a position that was very close to their starting position after relaxation was complete. This behaviour was observed in 12 video sequences that were examined and was independent of viscosity. When segmentation was associated with pyloric outflow, the difference was insubstantial. Modelling the dispersion of a diffusive scalar over 4 min of segmentative activity was not possible as sustained activity over four to five cycles of contractions had not been observed in our previous study [14].
Figure 10.
Showing the influence of segmentation on the displacement of small particles in a model incorporating spatio-temporally mapped sequences of segmental motility in the duodenum of the guinea pig (BC3). (a) Temporal profile of change in the diameter at the centre of a region of segmental contraction (filled squares, experimental data from [14], plain line, equation (2.9)). (b) Plots of isovalues of velocity and displacement of small particles advected by the flow (open circles, initial position, filled circles, instantaneous position) at three different time points with a viscosity of lumen contents of 1 mPa.s. At the peak of the contraction (t = 0.8 s), the particles undergo significant advection by the flow field, but return to their initial position when relaxation is complete (t = 3.8 s). (Umax = 3.9 mm s−1; a1 = 0.85 s; D0 = 4.8 mm; 2l = 8.6 mm; μ = 1 mPa.s.)
4. Discussion
4.1. Methodological advances in modelling of flow within the gut
While a number of previous workers [7,8,18] have directly incorporated image data that described the evolution of propagating radial constriction in fluid mechanical models, the present study is the first to explore the physical processes of digestion during pendular and segmentative activity in the absence and the presence of pyloric outflow using models that integrate the physics of fluids with real physiological and morphological data that incorporate inter- and intra-individual variability. This method is also a simpler alternative than the construction of stochastic models of intestinal motility [16]. This study provides insights into the relative contribution of the various types of static contractile activity in securing mixing and digestion and permits some statistical assessment of the variation in flow with viscosity and between subjects. Again models that incorporate such sophisticated data may help in the design of food and pharmaceutical products to optimize absorption.
While the use of these methods have allowed us to generate data with a level of detail that is currently not possible to obtain directly, either in vivo or ex vivo, some form of direct validation of the model is desirable though technically difficult. In this respect, we are currently developing a method based on residence time distribution of dye tracers [6].
4.2. Mixing at low Reynolds number in the proximal duodenum
During cyclic pendular or segmentative contractions, flow within the duodenum would be reversible as a result of reciprocal cycling of the boundaries provided that the system had low Reynolds numbers (table 1). In the absence of diffusion, this would result in perpetual cycles of mixing and unmixing (figures 6 and 10). In the presence of diffusion, these cycles of deformations would increase the interface between fluid elements and then promote their inter-diffusion (figure 8). This mixing may be augmented at low Reynolds number by the occurrence of wall motions that would generate a geometric phase (concept of ‘geometric mixing’, [38]). While such a mechanism has been hypothesized to improve mixing in the lumen of the stomach [38], in the proximal duodenum of the rat and guinea pig such wall motions could not occur as non-propagating longitudinal or circular activity are mutually exclusive [14], hence a geometric phase cannot occur.
4.3. Pendular activity and ‘mixing in situ’
The results show that non-propagating longitudinal contractions in arrays of contractile domains within the proximal duodenum of the rat generate corresponding arrays of non-steady vortices with a relative increase in lumen pressure in areas between adjacent vortices (figure 3). This result matches qualitatively with manometric data from the isolated small intestine of the rabbit [39] and confirm hypotheses based on simple mechanical models that longitudinal small intestinal contractions can generate vortices [13]. However, our quantified results showed that conclusions of previous workers [13,15] on the effects of longitudinal contractions on vortices and laminar mixing were oversimplified. Indeed, the generation of vortices does not appear to govern the mixing process as the amplitude of the radial velocity is low (figure 5) and so the content of the lumen cannot flow between the core and the periphery of the duodenum during one cycle of contraction (figure 6). Rather, our results indicate that pendular activity induces a cyclic deformation of boundaries between adjacent elements of fluid lumen content that locally increase the area of interface between them and accelerates inter-diffusion (figure 8). Hence, contrary to the actions of peristaltic contractions that engender mixing during axial propulsion [7,8], pendular activity can mix content ‘in situ’. Indeed, the disposition and mode of action of pendular activity appears to reflect chemical process engineering design insofar as it minimizes propulsion while maximizing dispersion [3,4].
Moreover, the fact that the effects of pendular activity on dispersion increased as the diffusion coefficient of the marker material decreased (figure 8) highlights the importance of longitudinal motility in the proximal duodenum in the digestion of larger and more slowly diffusive molecules, such as glucose (α ≈ 8×10⁻¹⁰ m² s−1 [40]) or aggregates of molecules such as biliary micelles (α ≈ 1×10⁻¹⁰ m² s−1 [41]). The principal factor limiting the efficient mixing of lumen contents with a low Reynolds number is the symmetric reciprocating motion of the walls. The association of pendular activity with pyloric outflow has been hypothesized to improve mixing by precluding the consequent reciprocal motion of the adjacent fluid. Our results support this conclusion indicating that mixing in the duodenum is facilitated by the concerted action of the gastric and duodenal musculature. However, it is noteworthy that while the dispersion of nutrient molecules would be improved by pyloric outflow (figure 9), the concerted action of the antrum and the pylorus in generating pulsatile flow [18,26] did not augment such dispersal. In this regard, it is noteworthy that our two-dimensional analysis could not incorporate any effect of the pyloric torus. This structure, an asymmetrically positioned pad projecting into the pyloric lumen, along with its associated muscular loops [42], may serve to vary the position of the outflow within the duodenal bulb and further increase dispersion [43].
4.4. Effects of the rheological properties of the chyme on mixing
The flow generated by pendular activity is weakly dependant on viscosity when chyme behaves as a simple Newtonian fluid (table 2). Such a situation is likely to occur during the post-prandial period when significant quantities of drink are ingested. A second model that incorporated shear thinning behaviour of the chyme [44] was developed and will be presented in a further paper. It shows that similar phenomena are likely to occur during the later part of the post-prandial period and during the inter-meal interval with moderate qualitative differences.
4.5. Segmentative activity
During a single segmentative contraction in the guinea pig duodenum, the flow was reversible even when the viscosity of chyme was low (figure 9). It is possible that sustained segmentative activity in the manner described by Cannon [11] may mix the luminal content by a similar mechanism to that during pendular activity (figure 8). However, such activity has not been reported in isolated preparations [10,14]. Moreover, segmentative activity appears to be more evident in the isolated duodenum of the herbivorous guinea pig [45] than the omnivorous rat [46]. Typically, the chyme of herbivores has a high volume of insoluble particles and behaves as a weak gel exhibiting a degree of elasticity and plasticity [44]. Such rheological behaviour will promote irreversibility in the flow as duodenal contractions induce structural changes in the chyme from extrusion of the liquid phase and from incomplete re-expansion and recovery of this fluid during the relaxation [47]. Furthermore, the extrusion of the liquid phase during compression may augment any slip at the wall [5,48]. Conversely, such behaviour would render mixing by pendular activity inefficient, as the presence of expressed fluid at the wall would promote slip and prevent longitudinal contractions from transmitting shear to the lumen content. Hence, segmentation may be more developed when dietary habit results in chyme with high solid volume ratios and pendular activity may be more developed when solid volume content of chyme is low. These differences in the predominant type of stationary contractile activity appear to be reflected in the relative proportions of longitudinal and circular muscles in the duodenal tunica muscularis in the rat and the guinea pig [14].
References
- 1.Penry DL, Jumars PA. 1986. Chemical reactor analysis and optimal digestion. Bioscience 36, 310–313 10.2307/1310235 (doi:10.2307/1310235) [DOI] [Google Scholar]
- 2.Penry DL, Jumars PA. 1987. Modeling animal guts as chemical reactors. Am. Nat. 129, 69–96 10.1086/284623 (doi:10.1086/284623) [DOI] [Google Scholar]
- 3.Jumars PA. 2000. Animal guts as ideal chemical reactors: maximizing absorption rates. Am. Nat. 155, 527–543 10.1086/303333 (doi:10.1086/303333) [DOI] [PubMed] [Google Scholar]
- 4.Jumars PA. 2000. Animal guts as nonideal chemical reactors: partial mixing and axial variation in absorption kinetics. Am. Nat. 155, 544–555 10.1086/303334 (doi:10.1086/303334) [DOI] [PubMed] [Google Scholar]
- 5.Lentle RG, Janssen PWM. 2011. The physical processes of digestion. New York, NY: Springer [Google Scholar]
- 6.Janssen PWM, Lentle RG, Asvarujanon P, Chambers P, Stafford KJ, Hemar Y. 2007. Characterization of flow and mixing regimes within the ileum of the brushtail possum using residence time distribution analysis with simultaneous spatio-temporal mapping. J. Physiol. Lond. 582, 1239–1248 10.1113/jphysiol.2007.134403 (doi:10.1113/jphysiol.2007.134403) [DOI] [PMC free article] [PubMed] [Google Scholar]
- 7.Jeffrey B, Udaykumar HS, Schulze KS. 2003. Flow fields generated by peristaltic reflex in isolated guinea pig ileum: impact of contraction depth and shoulders. Am. J. Physiol. Gastrointest. Liver Physiol. 285, G907–G918 [DOI] [PubMed] [Google Scholar]
- 8.Love R, Lentle R, Asvarujanon P, Hemar Y, Stafford K. 2012. An expanded finite element model of the intestinal mixing of digesta. Food Dig. (doi:10.1007/s13228-012-0017-x) [Google Scholar]
- 9.Schulze KS, Clark E. 2008. Ink dispersion by sequential contractions in isolated segments of guinea pig ileum and duodenum. Neurogastroenterol. Motil. 20, 1317–1327 10.1111/j.1365-2982.2008.01200.x (doi:10.1111/j.1365-2982.2008.01200.x) [DOI] [PubMed] [Google Scholar]
- 10.Gwynne RM, Thomas EA, Goh SM, Sjovall H, Bornstein JC. 2004. Segmentation induced by intraluminal fatty acid in isolated guinea-pig duodenum and jejunum. J. Physiol. Lond. 556, 557–569 10.1113/jphysiol.2003.057182 (doi:10.1113/jphysiol.2003.057182) [DOI] [PMC free article] [PubMed] [Google Scholar]
- 11.Cannon WB. 1902. The movements of the intestines studied by means of the Rontgen rays. Am. J. Physiol. 6, 251–277 [PMC free article] [PubMed] [Google Scholar]
- 12.Grivel ML, Ruckebusch Y. 1972. The propagation of segmental contractions along the small intestine. J. Physiol. Lond. 227, 611–625 [DOI] [PMC free article] [PubMed] [Google Scholar]
- 13.Melville J, Macagno E, Christensen J. 1975. Longitudinal contractions in duodenum: their fluid–mechanical function. Am. J. Physiol. 228, 1887–1892 [DOI] [PubMed] [Google Scholar]
- 14.Lentle RG, de Loubens C, Hulls C, Janssen PWM, Golding MD, Chambers JP. 2012. A comparison of the organization of longitudinal and circular contractions during pendular and segmental activity in the duodenum of the rat and guinea pig. Neurogastroenterol. Motil. 24 686–695, e298 10.1111/j.1365-2982.2012.01923.x (doi:10.1111/j.1365-2982.2012.01923.x) [DOI] [PubMed] [Google Scholar]
- 15.Macagno EO, Christensen J. 1980. Fluid-mechanics of the duodenum. Annu. Rev. Fluid Mech. 12, 139–158 10.1146/annurev.fl.12.010180.001035 (doi:10.1146/annurev.fl.12.010180.001035) [DOI] [Google Scholar]
- 16.Macagno EO, Christensen J, Lee CL. 1982. Modeling the effect of wall movement on absorption in the intestine. Am. J. Physiol. 243, G541–G550 [DOI] [PubMed] [Google Scholar]
- 17.Lentle RG, Janssen PWM. 2013. Principles and technologies for spatiotemporal motility mapping. In New advances in gastrointestinal motility research, (eds Cheng LK, Pullan AJ.). Berlin, Germany: Springer [Google Scholar]
- 18.Pal A, Indireshkumar K, Schwizer W, Abrahamson B, Fried M, Brasseur JG. 2004. Gastric flow and mixing studied using computer simulation. Proc. R. Soc. Lond. B 271, 2587–2594 10.1098/rspb.2004.2886 (doi:10.1098/rspb.2004.2886) [DOI] [PMC free article] [PubMed] [Google Scholar]
- 19.Wang Y, Brasseur JG, Banco GG, Webb AG, Ailiani AC, Neuberger T. 2010. Development of a lattice-Boltzmann method for multiscale transport and absorption with application to intestinal function. In Computational modeling in biomechanics (eds De S, Guilak G, Mofrad MRK.), pp. 69–98 New York, NY: Springer [Google Scholar]
- 20.Wang YX, Brasseur JG, Banco GG, Webb AG, Ailiani AC, Neuberger T. 2010. A multiscale lattice Boltzmann model of macro- to micro-scale transport, with applications to gut function. Phil. Trans. R. Soc. A 368, 2863–2880 10.1098/rsta.2010.0090 (doi:10.1098/rsta.2010.0090) [DOI] [PMC free article] [PubMed] [Google Scholar]
- 21.Lentle RG, Janssen PWM, Asvarujanon P, Chambers P, Stafford KJ, Hemar Y. 2007. High definition mapping of circular and longitudinal motility in the terminal ileum of the brushtail possum Trichosurus vulpecula with watery and viscous perfusates. J. Comp. Physiol. B Biochem. Syst. Environ. Physiol. 177, 543–556 10.1007/s00360-007-0153-8 (doi:10.1007/s00360-007-0153-8) [DOI] [PubMed] [Google Scholar]
- 22.Happel J, Brenner H. 1983. Low Reynolds number hydrodynamics: with special applications to particulate media. The Hague, The Netherlands: Martinus Nijhoff Publishers [Google Scholar]
- 23.Womersley JR. 1955. Method for the calculation of velocity, rate of flow and viscous drag in arteries when the pressure gradient is known. J. Physiol. Lond. 127, 553–563 [DOI] [PMC free article] [PubMed] [Google Scholar]
- 24.Loudon C, Tordesillas A. 1998. The use of the dimensionless Womersley number to characterize the unsteady nature of internal flow. J. Theor. Biol. 191, 63–78 10.1006/jtbi.1997.0564 (doi:10.1006/jtbi.1997.0564) [DOI] [PubMed] [Google Scholar]
- 25.Duflos C, Bellaton C, Pansu D, Bronner F. 1995. Calcium solubility, intestinal sojourn time and paracellular permeability codetermine passive calcium absorption in rats. J. Nutr. 125, 2348–2355 [DOI] [PubMed] [Google Scholar]
- 26.Indireshkumar K, et al. 2000. Relative contributions of ‘pressure pump’ and ‘peristaltic pump’ to gastric emptying. Am. J. Physiol. Gastrointest. Liver Physiol. 278, G604–G616 [DOI] [PubMed] [Google Scholar]
- 27.Lentle RG, Janssen PWM, Goh K, Chambers P, Hulls C. 2010. Quantification of the effects of the volume and viscosity of gastric contents on antral and fundic activity in the rat stomach maintained ex vivo. Dig. Dis. Sci. 55, 3349–3360 10.1007/s10620-010-1164-y (doi:10.1007/s10620-010-1164-y) [DOI] [PubMed] [Google Scholar]
- 28.Chen S, Doolen GD. 1998. Lattice Boltzmann method for fluid flows. Annu. Rev. Fluid Mech. 30, 329–364 10.1146/annurev.fluid.30.1.329 (doi:10.1146/annurev.fluid.30.1.329) [DOI] [Google Scholar]
- 29.Aidun CK, Clausen JR. 2010. Lattice-Boltzmann method for complex flows. Annu. Rev. Fluid Mech. 42, 439–472 [Google Scholar]
- 30.Guo ZL, Shi BC, Wang NC. 2000. Lattice BGK model for incompressible Navier–Stokes equation. J. Comp. Phys. 165, 288–306 10.1006/jcph.2000.6616 (doi:10.1006/jcph.2000.6616) [DOI] [Google Scholar]
- 31.Brasseur JG, Corrsin S, Lu NQ. 1987. The influence of a peripheral layer of different viscosity on peristaltic pumping with Newtonian fluids. J. Fluid Mech. 174, 495–519 10.1017/S0022112087000211 (doi:10.1017/S0022112087000211) [DOI] [Google Scholar]
- 32.Li MJ, Brasseur JG, Dodds WJ. 1994. Analyses of normal and abnormal esophageal transport using computer-simulations. Am. J. Physiol. 266, G525–G543 [DOI] [PubMed] [Google Scholar]
- 33.Guo ZL, Zheng CG, Shi BC. 2002. Non-equilibrium extrapolation method for velocity and pressure boundary conditions in the lattice Boltzmann method. Chin. Phys. 11, 366–374 10.1088/1009-1963/11/4/310 (doi:10.1088/1009-1963/11/4/310) [DOI] [Google Scholar]
- 34.Filippova O, Hanel D. 1998. Grid refinement for lattice-BGK models. J. Comp. Phys. 147, 219–228 10.1006/jcph.1998.6089 (doi:10.1006/jcph.1998.6089) [DOI] [Google Scholar]
- 35.Mei R, Shyy W, Yu D, Luo LS. 2000. Lattice Boltzmann method for 3-D flows with curved boundary. J. Comp. Phys. 161, 680–699 10.1006/jcph.2000.6522 (doi:10.1006/jcph.2000.6522) [DOI] [Google Scholar]
- 36.Kao PH, Yang RJ. 2008. An investigation into curved and moving boundary treatments in the lattice Boltzmann method. J. Comp. Phys. 227, 5671–5690 10.1016/j.jcp.2008.02.002 (doi:10.1016/j.jcp.2008.02.002) [DOI] [Google Scholar]
- 37.Yu D, Girimaji SS, Ladd AJC. 2008. Revised moment propagation method for scalar transport. Phys. Rev. E 78, 056706. 10.1103/PhysRevE.78.056706 (doi:10.1103/PhysRevE.78.056706) [DOI] [PubMed] [Google Scholar]
- 38.Cartwright JHE, Gouillart E, Piro N, Piro O, Tuval I. 2012. Geometric mixing. See http://arxiv.org/abs/12066894 [DOI] [PMC free article] [PubMed]
- 39.Dinning PG, Arkwright JW, Costa M, Wiklendt L, Hennig G, Brookes SJH, Spencer NJ. 2011. Temporal relationships between wall motion, intraluminal pressure, and flow in the isolated rabbit small intestine. Am. J. Physiol. Gastrointest. Liver Physiol. 300, G577–G585 10.1152/ajpgi.00532.2010 (doi:10.1152/ajpgi.00532.2010) [DOI] [PubMed] [Google Scholar]
- 40.Daniels F, Alberty RA. 1961. Physical chemistry. New York, NY: Wiley [Google Scholar]
- 41.Oh SY, McDonnell ME, Holzbach RT, Jamieson AM. 1977. Diffusion coefficients of single bile salt and bile salt-mixed lipid micelles in aqueous solution measured by quasielastic laser light scattering. Biochim. Biophys. Acta Lipids Lipid Metab. 488, 25–35 10.1016/0005-2760(77)90119-9 (doi:10.1016/0005-2760(77)90119-9) [DOI] [PubMed] [Google Scholar]
- 42.Ramkumar D, Schulze KS. 2005. The pylorus. Neurogastroenterol. Motil. 17, 22–30 10.1111/j.1365-2982.2005.00664.x (doi:10.1111/j.1365-2982.2005.00664.x) [DOI] [PubMed] [Google Scholar]
- 43.Dillard S, Krishnan S, Udaykumar HS. 2007. Mechanics of flow and mixing at antroduodenal junction. World J. Gastroenterol. 13, 1365–1371 [DOI] [PMC free article] [PubMed] [Google Scholar]
- 44.Lentle RG, Hemar Y, Hall CE, Stafford KJ. 2005. Periodic fluid extrusion and models of digesta mixing in the intestine of a herbivore, the common brushtail possum (Trichosurus vulpecula). J. Comp. Physiol. B Biochem. Syst. Environ. Physiol. 175, 337–347 10.1007/s00360-005-0490-4 (doi:10.1007/s00360-005-0490-4) [DOI] [PubMed] [Google Scholar]
- 45.Hirsch E. 1973. Some determinants of intake and patterns of feeding in the guinea pig. Physiol. Behav. 11, 687–704 10.1016/0031-9384(73)90255-2 (doi:10.1016/0031-9384(73)90255-2) [DOI] [PubMed] [Google Scholar]
- 46.Corbet GB, Southern HN. 1977. The handbook of British mammals. Oxford, UK: Blackwell Scientific [Google Scholar]
- 47.Lentle RG, Hemar Y, Hall CE. 2006. Viscoelastic behaviour aids extrusion from and reabsorption of the liquid phase into the digesta plug: creep rheometry of hindgut digesta in the common brushtail possum Trichosurus vulpecula. J. Comp. Physiol. B Biochem. Syst. Environ. Physiol. 176, 469–475 10.1007/s00360-006-0068-9 (doi:10.1007/s00360-006-0068-9) [DOI] [PubMed] [Google Scholar]
- 48.Barnes HA, Hutton JF, Walters K. 1989. An introduction to rheology. Amsterdam, The Netherlands: Elsevier [Google Scholar]


