

Abstract
The binding of T cell antigen receptors (TCRs) to specific complexes of peptide and major histocompatibility complex (pMHC) is typically of very low affinity, which necessitates the use of multimeric pMHC complexes to label T lymphocytes stably. We report here the development of pMHC complexes able to be crosslinked by ultraviolet irradiation; even as monomers, these efficiently and specifically stained cognate T cells. We also used this reagent to probe T cell activation and found that a covalently bound pMHC was more stimulatory than an agonist pMHC on lipid bilayers. This finding suggested that serial engagement of TCRs is dispensable for activation when a substantial fraction of TCRs are stably engaged. Finally, pMHC-bound TCRs were ‘preferentially’ transported into the central supramolecular activation cluster after activation, which suggested that ligand engagement enabled linkage of the TCR and its associated CD3 signaling molecules to the cytoskeleton.
T cells express T cell antigen receptors (TCRs) that recognize antigenic peptides bound to major histocompatibility complex (MHC) molecules on the surface of antigen-presenting cells1. As the interaction between a TCR and a complex of peptide and MHC (pMHC) is generally very weak and has a dissociation constant (Kd) of 1–100 µM and a half-life (t1/2) of 0.5–10 s, a soluble pMHC monomer cannot in most cases stably adhere to the surface of the T cell. This has led to the development of pMHC tetramers2 and other multimeric forms for the detection and isolation of specific T cells in mixed populations3. Such methods have been widely used in both basic and clinical T cell immunology; however, they also have many considerable limitations. For example, pMHC multimers aggregate TCRs, causing internalization and activation of TCRs that is unwanted in some studies. Further, even multivalent interactions are still reversible; thus, T cells with very low affinities for a particular pMHC may not stain efficiently. Finally, functional pMHC tetramers cannot be produced from mixtures of peptides, which limits the ability to generate a combinatorial library of tetramers for assessing many T cell specificities simultaneously. Here we have developed an alternative method that uses a pMHC ligand that can be crosslinked by ultraviolet irradiation (a ‘photocrosslinkable’ ligand). We found that we could use these reagents, even as monomers, to detect antigen-specific T cells with excellent specificity and efficiency.
The ability to specifically crosslink a pMHC to its cognate TCR has also provided a new tool with which to examine important aspects of the T cell–activation process. Specifically, we first sought to determine whether a permanently bound pMHC ligand is stimulatory, because whether a pMHC-TCR interaction with a too-long t1/2 has a negative effect on T cell signaling has been controversial. For example, ‘kinetic proofreading’ models propose that the t1/2 must be long enough for T cells to complete a series of signaling events4, whereas the serial-triggering model postulates that the t1/2 must be short enough so that each agonist pMHC can sequentially engage many TCRs to amplify the signals required for T cell activation5. It has also been proposed that there is an optimal ‘dwell time’ that balances those two requirements6. However, the observation that some pMHC complexes with a long t1/2 are stimulatory has cast doubt on those models7. Here we used a photocrosslinking approach to turn a normally transient pMHC-TCR interaction into one with an infinitely low dissociation rate, preventing serial engagement from occurring. Using planar lipid bilayers as a surrogate for an antigen-presenting cell, we found that a permanently engaged pMHC ligand was even more potent than a standard one. This result showed that serial engagement is not a prerequisite for T cell activation, although it will still occur because of the rapid dissociation of the TCR from its ligand8,9 and may be critical when the peptide is limiting5,10–12.
We next sought to determine whether an engaged TCR and an unengaged TCR have different dynamics on the surface of an activating T cell. Many published studies have shown that TCRs quickly accumulate in the central supramolecular activation cluster (cSMAC) of the immunological synapse after T cell activation13–15. There are also many reports of the association of TCRs with the cytoskeleton16–20 and that movement into the cSMAC is governed by the motor proteins myosin IIA21 or dynein22. However, it is not clear whether engaged TCRs and unengaged TCRs move concurrently into the cSMAC. Here we were able to use different labels to distinguish ligand-bound TCRs from non-ligand-bound ones and found that all or most engaged TCRs moved rapidly to the cSMAC after T cell activation. In contrast, most unengaged TCRs remained evenly distributed on the T cell surface.
RESULTS
Design and synthesis of photocrosslinkable pMHC
As a source of physiological CD4+ T cell blasts, we first obtained T cells from 5C.C7 mice, which have transgenic expression of a TCR that specifically recognizes a peptide of moth cytochrome c (MCC) amino acids 88–103 bound to the mouse MHC class II molecule I-Ek (MCC–I-Ek), then cultured the cells for 6–8 d with antigen. We used the following three peptides for this test: MCC (an agonist peptide), 102S (a weak agonist) and ER60 (an endogenous peptide). They all bind strongly to I-Ek, but as pMHC complexes, they interact with the 5C.C7 TCR with the following varying affinities9: MCC–I-Ek, Kd = 22.9 µM and t1/2 = 5.77 s; 102S–I-Ek, Kd = 206 µM and t1/2 = 0.83 s; and ER60–I-Ek, Kd and t1/2 below the detection limit of surface plasmon resonance. Next we generated photocrosslinkable derivatives of these peptides via solid-phase peptide synthesis and chemical modification (Supplementary Fig. 1a). We used 4-azidosalicyclic acid (ASA) as the photocrosslinker. To avoid interference with TCR recognition, we introduced the ASA group just outside the core TCR-recognition region in the peptides. We did this by synthesizing a peptide derivative containing a cysteine residue at position P-3 (biotin-Ahx-SGGGSGGGSCGGIAYLKQATK, where ‘Ahx’ indicates the 6-aminohexanoic acid linker, and underlining indicates the P-3 cysteine residue and the MHC-binding region), then conjugated ASA to that cysteine. For ease of detection, each peptide had a biotin moiety at its amino terminus; thus, we called the resultant derivatives BioMCC(ASA), Bio102S(ASA) and BioER60(ASA), respectively.
As ASA is labile when exposed to light and reducing agents, we could not use the standard in vitro refolding protocol to generate photocrosslinkable peptide–I-Ek complexes23. Inspired by a published method for peptide exchange in MHC class I mediated by ultraviolet irradiation24, we tried a similar strategy for I-Ek. We synthesized a derivative of the MCC peptide (Lys99ANP; Supplementary Fig. 1b) in which the key TCR-recognition residue Lys99 was replaced by the photocleavable amino acid ANP (3-amino-3-(2-nitrophenyl)propionic acid). We then produced Lys99ANP–I-Ek via in vitro refolding with Lys99ANP and inclusion bodies of the α- and β-subunits of I-Ek. Next we assessed the efficiency of ultraviolet irradiation–induced peptide exchange with Lys99ANP–I-Ek and MCC peptide labeled with indocarbocyanine (Cy3). We determined the yield of exchange by purification with fast-performance liquid chromatography and colorimetric measurement (Supplementary Fig. 2). Unlike results obtained for MHC class I, after 30 min of exposure to ultraviolet light, only 30% of Lys99ANP–I-Ek was converted into Cy3-labeled MCC–I-Ek. Published work has shown that empty HLA-DR2 generated from photocleavage of bound peptide quickly turns into a conformer with substantially slower peptide-binding kinetics25. This may explain the poor exchange characteristics we observed for Lys99ANP–I-Ek with ultraviolet irradiation.
By screening a variety of conditions, we found that the peptide exchange of Lys99ANP to Cy3-labeled MCC was almost quantitative at low pH (5.2) without ultraviolet irradiation. We also found that another derivative of MCC peptide in which Lys99 was replaced with β-homoleucine (Supplementary Fig. 1c) acted the same way. With this method, we were able to produce all three photocrosslinkable pMHC ligands: BioMCC(ASA)–I-Ek, Bio102S(ASA)–I-Ek and BioER60(ASA)–I-Ek.
Staining of T cells with photocrosslinkable pMHC
We then determined whether the photocrosslinkable pMHC monomers described above were able to stain 5C.C7 T cell blasts. We incubated cells on ice for 30 min with those reagents at a concentration of 1 µM, then induced the photocrosslinking reaction by ultraviolet irradiation. We then washed the cells extensively to remove unbound pMHC molecules and added phycoerythrin-conjugated streptavidin (PE-SAv) to label cells via the biotin moiety of bound pMHC complexes. Subsequent flow cytometry showed that among these three pMHC complexes, BioMCC(ASA)–I-Ek was the most efficient at staining 5C.C7 T cells, Bio102S(ASA)–I-Ek was less efficient and BioER60(ASA)–I-Ek stained T cells very poorly (Fig. 1a). The varied staining efficiency was consistent with their different affinities for the 5C.C7 TCR. To verify that the photocrosslinking was specific to cognate TCRs, we used an antibody to block the TCR before ultraviolet irradiation. For this we used 2B4 T cells, which have transgenic expression of the 2B4 TCR, which also recognizes MCC–I-Ek, instead of 5C.C7 T cells, because a blocking antibody for the latter was not available. We found that under these conditions, staining with BioMCC(ASA)–I-Ek was completely abrogated (Fig. 1b). In another experiment, we used these three pMHC complexes to stain a Listeria monocytogenes–specific T cell clone that recognizes the binding of a listeriolysin O–derived peptide (amino acids 190–201) to I-Ab (ref. 26) and found that none stained these T cells to any meaningful extent (Fig. 1c). Together these results showed that the photocrosslinkable, monomeric pMHC stained cognate T cells with excellent specificity. We used a photoactivation time of 5 min because that was the time at which we found that staining reached a plateau (Supplementary Fig. 3).
Figure 1.
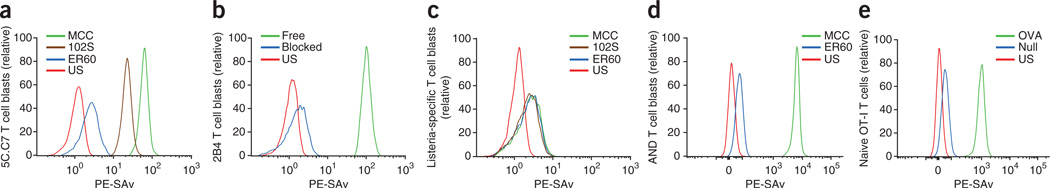
Staining of T cells with a photocrosslinkable pMHC monomer. (a) Flow cytometry of 5C.C7 T cell blasts photocrosslinked with BioMCC(ASA)–I-Ek (MCC), Bio102S(ASA)–I-Ek (102S) or BioER60(ASA)–I-Ek (ER60), then stained with PE-SAv. US, unstained. (b) Flow cytometry of 2B4 T cell blasts photocrosslinked with BioMCC(ASA)–I-Ek in the presence (blue) or absence (green) of antibody A2B4 to the TCR (100 µg/ml), followed by staining with PE-SAv. (c) Flow cytometry of an L. monocytogenes–specific T cell clone photocrosslinked and stained as in a. (d) Flow cytometry of AND T cell blasts photocrosslinked with BioMCC(ASA)–I-Ek or BioER60(ASA)–I-Ek, then stained with PE-SAv. (e) Flow cytometry of naive OT-I T cells photocrosslinked with OVA(ASA)–H-2Kb (OVA) or SIAAFASL(ASA)–H-2Kb (Null), then stained with PE-SAv. Data are representative of over five independent experiments (a) or two (b–d) or three (e) independent experiments.
To characterize the efficiency of photocrosslinking, we quantified the crosslinked pMHC molecules per T cell. We first photocrosslinked 5C.C7 T cell blasts with BioMCC(ASA)–I-Ek at a series of twofold dilutions (from 0.125 µM to 16 µM), then labeled the bound pMHC molecules with an excess of PE-SAv. Next we used flow cytometry to measure the average fluorescence intensity of T cells and of beads conjugated to known numbers of phycoerythrin molecules, from which we were able to calculate phycoerythrin molecules per cell (Table 1 and Supplementary Fig. 4). For example, we found that the use of 2 µM BioMCC(ASA)–I-Ek led to an average of 6,194 permanently bound pMHC molecules per cell. That was about 16% of the total TCRs on a T cell surface, estimated to be 38,000 per T cell on the basis of the binding characteristics of a phycoerythrin-conjugated TCR-specific antibody (Table 1).
Table 1.
Quantification of bound PE-SAv and PE-KJ25
| BioMCC(ASA)–I-Ek (µM) | PE-SAv | PE-KJ25 |
|---|---|---|
| 0 | 0 | 37,760 |
| 0.125 | 304 | 37,144 |
| 0.25 | 1,354 | 36,324 |
| 0.5 | 2,738 | 35,387 |
| 1 | 4,417 | 33,816 |
| 2 | 6,194 | 32,309 |
| 4 | 7,177 | 31,169 |
| 8 | 8,508 | 29,967 |
| 16 | 10,101 | 28,152 |
Quantification of bound PE-SAv and PE-KJ25 molecules per T cell in 5C.C7 T cell blasts photocrosslinked with BioMCC(ASA)–I-Ek on ice.
We also examined the accessibility of TCR variable regions after T cells were photocrosslinked with pMHC complexes. To do so, we used phycoerythrin-conjugated antibody KJ25 to β-chain variable region 3 (Vβ3) of the TCR (PE-KJ25) to stain 5C.C7 T cell blasts crosslinked with BioMCC(ASA)–I-Ek and quantified bound PE-KJ25 per cell by the method described above. We found that the number of bound PE-KJ25 molecules was inversely correlated with that of bound PE-SAv (Table 1 and Supplementary Fig. 4), which indicated that TCR-pMHC crosslinkage and the TCR-KJ25 association were mutually exclusive. This finding was expected, as part of the KJ25 epitope is in the complementarity-determining region 2 (CDR2) of Vβ3 (ref. 27). On the basis of this observation, we used fluorescence-labeled KJ25 to monitor the dynamics of unengaged TCRs on T cell surfaces, as discussed below.
Comparison of new approach to pMHC tetramer staining
We used both the PE-conjugated MCC–I-Ek tetramer and the photocrosslinkable BioMCC(ASA)–I-Ek monomer (together with PE-SAv) to stain 5C.C7 T cell blasts. They each efficiently stained these T cells. However, after incubation for 1 h at 25 °C after staining, the signal from the tetramer was approximately 50% lower, whereas that of the photocrosslinkable monomer was only about 5% lower (Supplementary Fig. 5). This difference was consistent with the fact that multivalent pMHC-TCR interactions are reversible, whereas those of crosslinked ligands are not. We also used the MCC—I-Ek tetramer and the BioMCC(ASA)—I-Ek monomer to analyze 5C.C7 β-chain T cell blasts that we had primed with MCC peptide, as an example of mixed T cell populations that recognize MCC–I-Ek with different affinities. Whereas each was able to detect cognate T cells in a mixture, we found that the photocrosslinkable BioMCC(ASA)—I-Ek monomer had slightly better resolution in discerning multiple T cell populations with varying affinities (Supplementary Fig. 6).
Staining of other T cells with photocrosslinkable pMHC
To test the generality of our method with other T cells specific for MCC, we also successfully labeled 2B4 T cells (Fig. 1b) and a mixture of T cell clones prepared from 5C.C7 β-chain mice (Supplementary Fig. 6). We then stained T cell blasts from mice of the AND strain, a third widely used mouse strain with transgenic expression of a TCR specific for MCC–I-Ek (refs. 28,29), and again found that the staining efficiency was excellent (Fig. 1d). The AND, 5C.C7 and 2B4 TCRs have distinct Vα CDR3 sequences, which lie over the amino terminus of the MCC peptide bound by I–Ek (ref. 30), yet all were effectively captured by the photocrosslinker.
We then tested whether this method could be used to detect MHC class I–restricted TCRs. For this we studied the OT-I TCR, which recognizes a peptide of ovalbumin amino acids 257–264 (OVA(257–264); SIINFEKL) bound to the mouse MHC class I molecule H-2Kb (OVA–H-2Kb)31. First, we synthesized a photocrosslinkable OVA(257–264) peptide. Unlike MHC class II molecules, whose peptide-binding grooves are open at both ends, both termini of OVA(257–264) are embedded in the peptide-binding groove of H-2Kb (ref. 32). However, published work has shown that the carboxyl terminus of OVA(257–264) is extendable33. Thus, we synthesized a derivative of OVA(257–264) with an extended carboxy-terminal sequence (SIINFEKLGGGGSGCS), then attached ASA to the cysteine residue to produce photocrosslinkable OVA(257–264) (OVA(ASA)). We then loaded OVA(ASA) into biotinylated H-2Kb by the published peptide-exchange method mediated by ultraviolet irradiation24. To do so, we first used in vitro refolding to produce an exchangeable pMHC complex consisting of H-2Kb and a photocleavable derivative of OVA(257–264) with replacement of Lys263 with ANP (OVA263ANP; SIINFE(ANP)L). We then irradiated the complex with ultraviolet light to generate empty H-2Kb molecules, then added OVA(ASA) in the dark to produce OVA(ASA)– H-2Kb. In parallel, we produced a photocrosslinkable derivative of a ‘null’ peptide (SIAAFASL)34 bound to H-2Kb as a negative control (SIAAFASL(ASA)–H-2Kb).
Next we isolated naive T cells from OT-I mice deficient in recombination- activating gene 1 (refs. 35,36) and stained the cells with OVA(ASA)–H-2Kb (1 µM) or SIAAFASL(ASA)–H-2Kb (1 µM) using the photocrosslinking protocol described above. Flow cytometry showed that the OVA(ASA)–H-2Kb monomer was more than 10 times more efficient at staining OT-I T cells than the null SIAAFASL(ASA)–H-2Kb monomer was (Fig. 1e). Thus, the photocrosslinkable pMHC monomer approach was also able to detect MHC class I–restricted T cells. There were clearly some exceptions, as a cytomegalovirus-derived peptide with a similar carboxy-terminal extension bound to HLA-A*0201 did not label under the same conditions. However, on further examination, we found that HLA-A*0201 tetramers loaded with that same peptide underwent little to no staining either (data not shown). That last observation suggested that this particular extended peptide interfered with the recognition ’footprint‘ of the dominant TCRs in this case.
Activation of T cells with photocrosslinkable pMHC
We then explored the utility of the reagents described above in investigating T cell activation. We first assessed, by calcium imaging, whether crosslinked pMHC monomers were able to stimulate T cells. We loaded 5C.C7 T cell blasts with the calcium-indicator dye Fura-2 before photocrosslinking them with BioMCC(ASA)–I-Ek (2 µM). After photocrosslinking, we washed cells to remove unbound pMHC ligands and monitored the intracellular calcium concentration of T cells at 37 °C by time-lapse, three-dimensional fluorescence microscopy. Although a large fraction of TCRs were occupied by photocrosslinked pMHC molecules (more than 6,000 TCRs per cell, or about 16% of total TCRs; Table 1), we did not observe any increase in cytoplasmic calcium over time (Fig. 2a). However, the T cells did flux calcium after we added streptavidin-coated nanocrystals (quantum dots) with emission at 705 nm to aggregate pMHC-TCR complexes. Continuous imaging of the quantum dots showed that multimeric pMHC-TCR complexes continued to move together and formed a large cluster (Fig. 2b). These results showed that monomeric pMHC complexes covalently linked to TCRs were not stimulatory, but that they were stimulatory after subsequent aggregation, consistent with published observations37–39.
Figure 2.

T cells do not flux calcium when covalently bound to pMHC monomers in medium and instead flux calcium only after aggregation. (a) Fura-2 excitation in 5C.C7 T cell blasts (n = 30 per condition) loaded with Fura-2, photocrosslinked with BioMCC(ASA)–I-Ek, then added to imaging medium at 37 °C, assessed over time with (+ SAv-QD705) or without (−) the addition of streptavidin-coated quantum dots. (b) Time-lapse montage of the calcium response (top) and quantum-dot imaging (bottom) of a T cell in pseudocolor. The first 1.5 min of the quantum-dot image are not presented because of the high background signal from free streptavidin-coated quantum dots diffusing in the medium. Original magnification, ×40. Data are representative of three independent experiments (error bars (a), s.d.).
We then examined the activation ability of the permanently engaged pMHC ligands through the use of a glass-supported planar lipid bilayer as a surrogate antigen-presenting cell surface. As the planar lipid bilayer was seeded with 10% nickel–nitrilotriacetic acid lipids, and the bound pMHC ligands on T cell surfaces contained a six-histidine-tagged carboxyl tail in both the α- and β-subunits, this would have the effect of causing T cells to adhere to the bilayer via conjugation of the six-histidine tag and nickel–nitrilotriacetic acid and possibly activate. We observed that T cells fluxed calcium shortly after contacting lipid bilayers. The induced calcium flux lasted only about 3 min in the absence of the adhesion molecule ICAM-1 and the costimulatory molecule B7-1 on the lipid bilayer but lasted more than 10 min in their presence (Fig. 3a). We also assessed whether these T cells were able to form immunological synapses. We used Alexa Fluor 647–conjugated single-chain variable fragment (scFv) of antibody H57 to the TCR β-chain (H57-scFv–A647) to label TCRs before loading T cells onto a planar lipid bilayer that presented B7-1 and Alexa Fluor 555–conjugated ICAM-1. Live-cell fluorescent imaging showed that TCRs on the T cell surface partially accumulated in an area surrounded by a ring of ICAM-1 molecules (Fig. 3b), which indicated the formation of immunological synapses. These results showed that covalently bound pMHC ligands on planar lipid bilayers were stimulatory. As the same ligand was not stimulatory in solution, the activation must have depended on aggregating TCRs and/or mechanical forces, as suggested before40–42.
Figure 3.

T cells flux calcium and form immunological synapses in response to covalently bound pMHC ligands on lipid bilayers. (a) Fura-2 excitation in 5C.C7 T cell blasts (n > 30 per condition) loaded with Fura-2, given no crosslinking (no XL) or photocrosslinked (XL) with BioMCC(ASA)–I-Ek, then added to a planar lipid bilayer at 37 °C in the presence (ICAM-1, B7-1) or absence (plain) of ICAM-1 and B7-1. (b) Fluorescence microscopy of synapse formation by 5C.C7 T cell blasts photocrosslinked with BioMCC(ASA)–I-Ek and labeled with H57-scFv–A647 conjugates, then added to a planar lipid bilayer presenting Alexa Fluor 555–conjugated ICAM-1 and B7-1. Positive control, 5C.C7 T cells without crosslinking, added to a lipid bilayer presenting Alexa Fluor 555–conjugated ICAM-1, B7-1 and MCC–I-Ek; negative control, 5C.C7 T cells without crosslinking, added to a lipid bilayer presenting Alexa Fluor 555–conjugated ICAM-1 and B7-1. Original magnification, ×100. Data are representative of three independent experiments (a; mean and s.d.) or two experiments (b).
A crosslinked pMHC is more potent than a standard pMHC
Next we compared the stimulatory potency of photocrosslinked pMHC ligands and standard agonist pMHC ligands without crosslinking. This analysis required quantification of each kind of pMHC used to stimulate T cells. As both pMHC ligands (crosslinked and not crosslinked) accumulated in the immunological synapse, we based the comparison on the number of synaptic pMHC complexes. We divided a culture of 5C.C7 T cells at day 7 into two aliquots, photocrosslinked one with BioMCC(ASA)–I-Ek ligands and exposed the other to the same amount of ultraviolet light but without pMHC ligands, then used the latter for subsequent activation with the standard MCC–I-Ek ligand. We then further divided both samples into two new aliquots. We used the first aliquot for the quantification of synaptic pMHC molecules and the second aliquot for functional assays, including analysis of calcium flux and cytokine secretion.
To quantify synaptic pMHC molecules, we used a fluorescence single-molecule counting assay. For T cells crosslinked with BioMCC(ASA)–I-Ek, we used Alexa Fluor 555 conjugates of monovalent streptavidin (monoSAv-A555)43 to label the associated pMHC molecules on T cell surfaces. As expected, most BioMCC(ASA)–I-Ek molecules (in conjugation with TCRs) accumulated in the cSMAC after the T cell had contacted the planar lipid bilayers presenting ICAM-1 and B7-1 (Fig. 4a). We measured the average fluorescence intensity of the cSMAC regions, as well as that of a single Alexa Fluor 555 molecule from a separate bilayer presenting an Alexa Fluor 555–labeled pMHC at low density. On the basis of these measurements, we were able to calculate the number of synaptic pMHC molecules. For T cells that were not photocrosslinked with pMHC complexes, we activated them with a lipid bilayer presenting ICAM-1, B7-1 and a standard pMHC molecule with the dye indodicarbocyanine (Cy5) conjugated to the carboxyl terminus of MCC peptide (MCC(Cy5)–I-Ek)9. Fluorescence imaging showed that MCC–I-Ek ligands also accumulated in the cSMAC after T cell activation (Fig. 4b). We quantified synaptic MCC–I-Ek molecules by the method described above. To make a fair comparison of the stimulatory potency of a photocrosslinked MCC–I-Ek and that of a standard ligand, we chose T cell samples with similar density of synaptic pMHC ligands for subsequent functional assays (Fig. 4c).
Figure 4.

A covalently bound pMHC ligand is more stimulatory than a standard agonist pMHC (without crosslinking) on planar lipid bilayers. (a) Fluorescence imaging of 5C.C7 T cells photocrosslinked with BioMCC(ASA)–I-Ek labeled with monoSAv-A647, then added to a planar lipid bilayer presenting ICAM-1 and B7-1. (b) Fluorescence imaging of unmanipulated (standard (Std)) 5C.C7 T cells added to a planar lipid bilayer presenting ICAM-1 and B7-1, as well as MCC(Cy5)–I-Ek. Original magnification, ×100 (a,b). (c) Quantification of synaptic pMHC molecules in a and b (n = 20 cells (average) per condition), calculated based on synaptic fluorescence intensity and average fluorescence intensity of a single molecule of fluorescent dye. Numbers under bars (1–5) identify samples. (d) Average calcium signals from each sample in a and b, plotted against time. (e) IL-2 in activated T cells as a function of the number of synaptic pMHC complexes. Data are representative of two independent experiments with similar results (mean and s.d. in c,e).
We first compared the increase in cytoplasmic calcium over time in T cells activated by standard agonist pMHC complexes (6,100 per cell) and T cells activated by similar amounts of photocrosslinked pMHC complexes (5,100 or 7,900 per cell). Time-lapse calcium imaging showed that both ligands were able to induce a sharp increase in Fura-2 excitation in T cells (assessed as the ratio of excitation at 340 nm to excitation at 380 nm), which reached its peak value (about 2.5-fold above the baseline) in less than 45 s (Fig. 4d). However, the higher calcium signal induced by the photocrosslinked pMHC complexes was maintained over a much longer time than was that induced by the standard agonist pMHC. Furthermore, we cultured the T cells overnight and measured their secretion of interleukin 2 (IL-2) by enzyme-linked immunosorbent assay. We found that T cells activated by the photocrosslinked pMHC complexes (2,600, 5,100 or 7,900 per cell) produced much more IL-2 than did those activated by standard pMHC ligands (4,100 or 6,100 per cell; Fig. 4e). Together these results showed that on a molar basis and at high densities, the permanently engaged pMHC ligand was more stimulatory than the standard agonist ligand was.
‘Preferential’ transport of engaged TCRs to the cSMAC
Next we used BioMCC(ASA)–I-Ek to probe synapse formation and TCR dynamics in T cell activation. We used both monoSAv-A555 and H57-scFv–A647 to label T cells photocrosslinked with BioMCC(ASA)–I-Ek, which allowed us to monitor the dynamics of pMHC and TCR molecules simultaneously by video fluorescence microscopy. We found that both pMHC complexes and TCRs migrated to the cSMAC within just a few minutes after T cells contacted the lipid bilayer (Fig. 5a). Meanwhile, there were still many TCRs visible in the peripheral area of the T cell surface, which were mostly unengaged (Figs. 3b and 5a). These data did not indicate, however, whether some of the unengaged TCRs had migrated to the cSMAC concurrently with the engaged TCRs. To address this, we quantified synaptic pMHC complexes and TCRs on a photocrosslinked T cell by the fluorescence single-molecule counting method described above. We found that TCRs (~7,900 per cSMAC) were in slight excess relative to pMHC complexes (~6,100 per cSMAC) in the synapse (Supplementary Fig. 7), which suggested that most synaptic TCRs were engaged with pMHC complexes.
Figure 5.

TCRs engaged by pMHC complexes rapidly migrate to the center of the immunological synapse after activation, but unengaged TCRs do not. (a) Fluorescence microscopy of the dynamics of bound pMHC ligands and all TCRs in 5C.C7 T cell blasts photocrosslinked with BioMCC(ASA)–I-Ek, labeled with monoSAv-A555 (for pMHC complexes) and H57-scFv–A647 (for all TCRs) and added to a planar lipid bilayer presenting ICAM-1 and B7-1. (b) Fluorescence microscopy of photocrosslinked T cells from the preparations in a, labeled with monoSAv-A555 (for pMHC complexes) and antigen-binding fragment of antibody KJ25 to Vβ3 conjugated to Alexa Fluor 647 (for unengaged TCRs), then added to a planar lipid bilayer as in a. Original magnification, ×100 (a,b). Data are representative of three independent experiments.
The results described above indicated that TCR-pMHC crosslinkage and the TCR-KJ25 association were mutually exclusive (Table 1 and Supplementary Fig. 4). To further verify that unengaged TCRs had not accumulated in the cSMAC, we used an antigen-binding fragment of antibody KJ25 to Vβ3 conjugated to Alexa Fluor 647 to label unengaged TCRs on 5C.C7 T cells that we photocrosslinked with BioMCC(ASA)–I-Ek. Subsequent video fluorescence imaging showed that unengaged TCRs did not move into the cSMAC to any noticeable extent but instead remained evenly distributed all over the T cell surface (Fig. 5b). Together these results showed that engaged TCRs were ‘preferentially’ transported to the cSMAC in the initial phases of T cell activation.
DISCUSSION
In this study, we developed photocrosslinkable pMHC monomers and showed that they could be used to detect antigen-specific T cells in some cases as well as or better than the equivalent tetramer, and also used them to study the ligand requirements and TCR dynamics of T cell activation and synapse formation. Such photocrosslinking techniques were first applied to T cell immunology in the context of MHC class I44–46, but in that work, the photocrosslinking group was intrinsic to the specificity. In contrast, we placed our photocrosslinking group at sites adjacent to residues important for TCR recognition, which thus allowed the detection of T cells with a complete range of specificities. Staining was very robust, because there was a fairly long time period (over 4 min) during which crosslinking can occur, and once it occurred, it was irreversible.
We found that pMHC complexes crosslinked to TCRs, even with an infinite t1/2 and with more than 6,000 molecules per cell, did not induce calcium flux in T cells. They were activated, however, when crosslinked pMHC-TCR pairs were brought into proximity through the use of streptavidin-coated quantum dots or a lipid bilayer. That finding was consistent with many published observations showing that pMHC monomers are not stimulatory37–39. The ability to label robustly without stimulation could be invaluable in situations in which activation and particularly TCR downregulation are not desired37.
We have also shown here that a photocrosslinkable pMHC on a lipid bilayer was more stimulatory than a standard agonist pMHC was. That conflicted with published observations showing that permanent pMHC-TCR engagement by photocrosslinking completely abolishes sustained intracellular calcium mobilization47. This discrepancy could have stemmed from the different types of T cells being tested, in that the previously published study used cloned cytotoxic T cell lines47, whereas we used helper T cells cultured for 1 week or less. It could have also been due to different sites at which the photochemistry occurs. In the previously published system, the photocrosslinker ABA was conjugated to Lys259 of the peptide PbCS (SYIPSAEKI) and was one of the key TCR-recognition elements47. When ABA is exposed to ultraviolet light, it loses a molecule of nitrogen to give rise to a reactive nitrene that can insert into adjacent C-H and N-H bonds on the engaged TCR or to undergo ring expansion to form a seven-member ring intermediate that reacts with proximal primary amines of the TCR48. Either reaction will change one of the key TCR-recognition moieties of a pMHC ligand, which may lead to loss of activation ability, even though the pMHC binds covalently to the TCR. In our system, the photocrosslinker was at a site on the pMHC not directly involved in TCR recognition; therefore, the photochemistry probably did not alter the pMHC antigenicity. Our results have also shown that a covalently bound TCR was able to signal for a sustained time, which indicated that when a substantial fraction of TCRs were engaged, serial TCR engagement was dispensable. Because of the rapid dissociation of the TCR from its ligand, serial TCR engagement would still occur8,9 and might be required for activation with a limited number of pMHC complexes5,10–12.
Finally, the photocrosslinkable pMHC reagent allowed us to distinguish ligand-engaged TCRs from unengaged TCRs. We found that only engaged TCRs, but few if any free TCRs, rapidly moved to the cSMAC shortly after activation. This suggested that ligand engagement enabled TCR-CD3 complexes to form a linkage to the cytoskeleton and to subsequently be transported into the cSMAC16–20. This process is probably driven by motor proteins, such as myosin IIA and dynein21,22. It has also been proposed that T cell activation is sustained by newly formed TCR clusters in the initial contact site and the periphery of synapses, and that once in the cSMAC, TCRs are internalized, presumably to terminate signaling49,50. In our system, most engaged TCRs moved to the cSMAC within 5 min, yet signaling was sustained for a considerable period beyond that, as indicated by calcium flux and IL-2 secretion. They were not internalized (data not shown), probably because the TCRs were tethered to the lipid bilayer through the tags on the MHC molecules. In any case, our results have indicated that the synapse is not a ‘dead zone’ for TCR signaling, consistent with published work51,52.
ONLINE METHODS
Mice and cell culture
The 5C.C7 mice (with transgenic expression of the TCR αβ-chain), 5C.C7 β-chain mice (with transgenic expression of the TCR β-chain) and 2B4 mice (with transgenic expression of the TCR αβ-chain), all on the B10.BR background, were bred and maintained in the Research Animal Facility at Stanford University Department of Comparative Medicine Animal Facility (protocol 3540) in accordance with guidelines of the US National Institutes of Health. Lymphocytes from these mice were stimulated with 10 µM MCC (ANERADLIAYLKQATK) in RPMI-1640 medium containing 10% FCS. Cells were split on the second day of culture in RPMI-1640 medium containing 50 units/ml of recombinant mouse IL-2 (R&D Systems) and thereafter were split as necessary for 5 d. T cell blasts were used for staining and/or activation assays 6–8 d after extraction. AND primary T cells were obtained from the laboratory of A. Shaw. Cells were primed with irradiated B10.BR splenocytes (1,250 rads) and MCC peptides (10 µM) in RPMI-1640 medium containing 10% FCS and were cultured and used for staining as described above. OT-I mice deficient in recombination-activating gene 1 (line 4175-F) were obtained from Taconic Farms through the National Institute of Allergy and Infectious Diseases Exchange Program of the US National Institutes of Health35,36. Naive T cells isolated from those mice were used directly for staining.
Peptide synthesis, modification and purification
The exchangeable peptides Lys99ANP (ANERADLIAYL(ANP)QATK) and OVA263ANP (SIINFE(ANP)L) were both synthesized at the PAN (Protein and Nucleic Acid) facility of Stanford University. Crude cysteine-containing peptides, including BioMCC(Cys) (biotin-Ahx-SGGGSGGGSCGGIAYLKQATK, underlining indicates the MHC- and TCR-recognition region), Bio102S(Cys) (biotin-Ahx-SGGGSGGGSCGGIAYLKQASK), BioER60(Cys) (biotin-Ahx-SGGGSGGGSCGGIYFSPANKKL), OVA(Cys) (SIINFEKLGGGGSGCS) and SIAAFASL(Cys) (SIAAFASLGGGGSGCS) were from AnaSpec or Elim Biopharm. Peptides were purified with a Rainin Dynamax HPLC system and a reverse-phase C18 column. Purified peptides were lyophilized, dissolved in dimethylformamide and reacted with AET (S-[2-(4-Azidosalicylamido)ethylthio]-2-thiopyridine; Toronto Research Chemicals) in 50 mM sodium phosphate buffer (pH, 7) for the introduction of ASA (4-azidosalicyclic acid) onto the side chain of cysteine residues. The modified peptides were purified by reverse-phase HPLC, lyophilized, dissolved in DMSO and stored in the dark at −20 °C.
Protein expression, labeling and purification
ICAM-1, B7-1, the single-chain variable fragment of H57 and MCC(Cy5)–I-Ek were produced as described9. KJ25 Fab′ was produced from the intact antibody (BD Biosciences) by digestion with papain (Pierce Biotechnology) and was labeled with Alexa Fluor 647 through the use of Alexa Fluor 647 succinimidyl esters (Invitrogen). The DNA construct for the production of monovalent streptavidin was a gift from A. Ting. A tobacco etch virus protease-recognition sequence was inserted between the gene encoding the streptavidin subunit and the gene encoding the six-histidine tag. MonoSAv with a six-histidine-tagged tail was produced by an in vitro refolding protocol as described43, and its six-histidine tag was cleaved with tobacco etch virus protease (Invitrogen). Purified monovalent streptavidin was labeled with Alexa Fluor 647 through the use of Alexa Fluor 647 succinimidyl esters and was purified by size-exclusion chromatography (Superdex 200; Pharmacia). The dye/protein ratio was determined to be 1.48 on the basis of colorimetric measurements.
Lys99ANP–I-Ek production and peptide exchange
Six-histidine-tagged 99ANP–I-Ek was obtained by in vitro refolding from the inclusion bodies of the α- and β-subunits of I-Ek and the peptide Lys99ANP according to a published protocol with slight modifications23. For exchange of Lys99ANP with BioMCC(ASA) or other photocrosslinkable peptides, Lys99ANP–I-Ek in PBS (10 µM) was mixed with the new peptide (100 µM) and the pH was adjusted to 5.2 with sodium citrate (50 mM). The exchange reaction was allowed to occur for 24 h at 25 °C and the new peptide–I-Ek was purified by size-exclusion chromatography (Superdex 200; Pharmacia). The whole process, including peptide exchange and protein purification, was carried out in minimal light.
Photocrosslinking of T cells and pMHC
First, 5C.C7 T cell blasts (1 × 10⁶) were incubated with the photocrosslinkable peptide–I-Ek in 20 µl flow cytometry buffer (PBS, 1% FCS, 2 mM EDTA, and 0.1% sodium azide) or imaging media (HBSS, 2% FCS, 0.5mM CaCl2, 0.1mM MgCl2) in a 96-well round-bottomed plate on ice. After 30 min of incubation, cells were exposed to ultraviolet light for 5 min at a distance of 20 cm (Stratalinker 2400; five 15-Watt bulbs; 365 nm). For flow cytometry, cells were washed three times with 200 µl flow cytometry buffer for the removal of unbound pMHC complexes and then were stained with PE-SAv as described below. For live-cell imaging, cells were washed extensively six times with 800 µl imaging medium for the removal of unbound pMHC complexes and then were subjected to fluorescent labeling (if necessary) and fluorescence imaging as described below.
Flow cytometry
T cells photocrosslinked with pMHC complexes were incubated for 30 min with PE-SAv (for labeling of biotinylated pMHC crosslinked to TCR) and fluorescein isothiocyanate–conjugated H57 antibody to the TCR β-chain (H57-597) in flow cytometry buffer. Cells were washed three times with 200 µl flow cytometry buffer, then were analyzed by flow cytometry on a Cytomics FC500 (Beckman Coulter) or a LSR II (BD Biosciences). Data were analyzed with FlowJo software. Live cells were identified by forward-scatter and side-scatter profiles.
Calcium imaging
T cells (1 × 10⁶) were loaded for 30 min at 25 °C with 5 µM Fura-2 (acetoxymethyl ester form; Invitrogen) in complete RPMI-1640 medium, then were washed twice with 10 ml imaging medium. Cells were then photocrosslinked with pMHC complexes according to the protocol described above and were resuspended in 50 µl cold imaging media and kept on ice until imaging. For imaging, a Zeiss Axiovert S100TV microscope equipped with a 40× Fluar objective (numerical aperture, 1.3) and a CoolSNAP HQ charge-coupled device camera (Roper Scientific) were used. Cells (5 µl) were loaded into imaging media (300 µl) in a Labtek eight-well chambered cover slip (Nunc) on a humidified stage at 37 °C and 5% CO2. Imaging acquisition was controlled by Metamorph (Universal Imaging). Signals from Fura-2 (excitation, 340 nm and 380 nm; emission, 510 nm) were collected at intervals of 6 s for up to 20 min. The intracellular calcium concentration was determined from the Fura-2 excitation ratio (excitation at 340 nm / excitation at 380 nm) with Metamorph. For the formation of multimers of pMHC-TCR pairs, streptavidin-coated quantum dots (Qdot705; 100 nM; 2 µl; Invitrogen) were added to cells in the chamber immediately before imaging. Lipid bilayers were prepared as described9.
IL-2 assay
The 5C.C7 T cell blasts (1 × 10⁵) were loaded onto a planar glass-supported bilayer with 300 µl imaging media. For T cells crosslinked to pMHC, lipid bilayers were embedded with ICAM-1 and B7-1; for other T cells, MCC(Cy5)–I-Ek was added as well. Cells were incubated for 16 h at 37 °C, and supernatants were removed. IL-2 in the supernatant was assessed by enzyme-linked immunosorbent assay with rat antibody to mouse IL-2 (JES6-1A12; BD Pharmingen), biotinylated rat antibody to mouse IL-2 (JES6-5H4; BD Pharmingen) and Europium-labeled streptavidin (Perkin Elmer).
Live-cell imaging of TCR mobility
First, 5C.C7 T cell blasts were photocrosslinked to BioMCC(ASA)–I-Ek as described above. Cells were mixed with monoSAv-A555 and H57-scFv–A647 (or antigen-binding fragment of antibody KJ25 to Vβ3 conjugated to Alexa Fluor 647) on ice. After 30 min of incubation, cells were washed three times with 800 µl cold imaging medium and then were resuspended in 50 µl of that medium. Before fluorescence imaging, 1 × 10⁵ cells were added to planar lipid bilayers embedded with ICAM-1 and B7-1 and covered with 300 µl imaging medium at 25 °C. Cells were then illuminated in total internal reflection fluorescence mode with a Zeiss Axiovert 200M microscope equipped with a 100× objective (numerical aperture, 1.46) and with both argon (Stabilite 2017-AR) and krypton (Stabilite-KR) ion-gas continuous-wave lasers (Spectra Physics). Fluorescence emissions from Alexa Fluor 555 and Alexa Fluor 647 were separated using a Dual-View beam splitter (Optical Insights) equipped with a dichroic mirror (630dcxr, transmitting wavelengths < 630 nm and reflecting wavelengths > 630 nm) and two bandpass filters (HQ575/40m (transmitting wavelengths 575 ± 20 nm) for Alexa Fluor 555, and HQ680/50m (transmitting wavelengths 680 ± 25 nm) for Alexa Fluor 647). Images were recorded with a back-illuminated EMCCD Cascade II:512 camera (Roper Scientific).
Supplementary Material
ACKNOWLEDGMENTS
We thank S. Valitutti and Y. Wong for critical reading of the manuscript; A. Ting (Massachusetts Institute of Technology) for constructs for the expression of monovalent streptavidin; A. Shaw and M. Kelly (Washington University St. Louis) for AND mouse spleen cells; and Y.-H. Chien, J. Campbell, F. Wang, J. Zhou, P. Nelida, N. Sigal and A. Girvin for discussions and/or experimental assistance. Supported by the Cancer Research Institute (J.X.), the Howard Hughes Medical Institute (M.M.D.) and the US National Institutes of Health (R01 AI022511 to M.M.D.).
Footnotes
Note: Supplementary information is available in the online version of the paper.
AUTHOR CONTRIBUTIONS
J.X. and M.M.D. conceived of the project; J.X. developed the photocrosslinkable pMHC reagent and the acid-mediated peptide-exchange method; J.B.H. optimized the lipid bilayer system and the total internal reflection fluorescence microscope system and contributed ideas; J.X. and J.B.H. worked together on live-cell total internal reflection fluorescence imaging; E.W.N., J.H., P.J.R.E. and Q.-J.L. contributed reagents and technical support; and J.X. and M.M.D. wrote the manuscript.
COMPETING FINANCIAL INTERESTS
The authors declare no competing financial interests.
References
- 1.Davis MM, et al. T cells as a self-referential, sensory organ. Annu. Rev. Immunol. 2007;25:681–695. doi: 10.1146/annurev.immunol.24.021605.090600. [DOI] [PubMed] [Google Scholar]
- 2.Altman JD, et al. Phenotypic analysis of antigen-specific T lymphocytes. Science. 1996;274:94–96. [PubMed] [Google Scholar]
- 3.Davis MM, Altman JD, Newell EW. Interrogating the repertoire: broadening the scope of peptide-MHC multimer analysis. Nat. Rev. Immunol. 2011;11:551–558. doi: 10.1038/nri3020. [DOI] [PMC free article] [PubMed] [Google Scholar]
- 4.McKeithan TW. Kinetic proofreading in T-cell receptor signal transduction. Proc. Natl. Acad. Sci. USA. 1995;92:5042–5046. doi: 10.1073/pnas.92.11.5042. [DOI] [PMC free article] [PubMed] [Google Scholar]
- 5.Valitutti S, Muller S, Cella M, Padovan E, Lanzavecchia A. Serial triggering of many T-cell receptors by a few peptide-MHC complexes. Nature. 1995;375:148–151. doi: 10.1038/375148a0. [DOI] [PubMed] [Google Scholar]
- 6.Kalergis AM, et al. Efficient T cell activation requires an optimal dwell-time of interaction between the TCR and the pMHC complex. Nat. Immunol. 2001;2:229–234. doi: 10.1038/85286. [DOI] [PubMed] [Google Scholar]
- 7.Holler PD, Kranz DM. Quantitative analysis of the contribution of TCR/pepMHC affinity and CD8 to T cell activation. Immunity. 2003;18:255–264. doi: 10.1016/s1074-7613(03)00019-0. [DOI] [PubMed] [Google Scholar]
- 8.Huang J, et al. The kinetics of two-dimensional TCR and pMHC interactions determine T-cell responsiveness. Nature. 2010;464:932–936. doi: 10.1038/nature08944. [DOI] [PMC free article] [PubMed] [Google Scholar]
- 9.Huppa JB, et al. TCR-peptide-MHC interactions in situ show accelerated kinetics and increased affinity. Nature. 2010;463:963–967. doi: 10.1038/nature08746. [DOI] [PMC free article] [PubMed] [Google Scholar]
- 10.González PA, et al. T cell receptor binding kinetics required for T cell activation depend on the density of cognate ligand on the antigen-presenting cell. Proc. Natl. Acad. Sci. USA. 2005;102:4824–4829. doi: 10.1073/pnas.0500922102. [DOI] [PMC free article] [PubMed] [Google Scholar]
- 11.Thomas S, et al. Human T cells expressing affinity-matured TCR display accelerated responses but fail to recognize low density of MHC-peptide antigen. Blood. 2011;118:319–329. doi: 10.1182/blood-2010-12-326736. [DOI] [PubMed] [Google Scholar]
- 12.Irving M, et al. Interplay between T cell receptor binding kinetics and the level of cognate peptide presented by major histocompatibility complexes governs CD8+ T cell responsiveness. J. Biol. Chem. 2012 May 1; doi: 10.1074/jbc.M112.357673. published online. [DOI] [PMC free article] [PubMed] [Google Scholar]
- 13.Monks CR, Freiberg BA, Kupfer H, Sciaky N, Kupfer A. Three-dimensional segregation of supramolecular activation clusters in T cells. Nature. 1998;395:82–86. doi: 10.1038/25764. [DOI] [PubMed] [Google Scholar]
- 14.Wülfing C, Sjaastad MD, Davis MM. Visualizing the dynamics of T cell activation: intracellular adhesion molecule 1 migrates rapidly to the T cell/B cell interface and acts to sustain calcium levels. Proc. Natl. Acad. Sci. USA. 1998;95:6302–6307. doi: 10.1073/pnas.95.11.6302. [DOI] [PMC free article] [PubMed] [Google Scholar]
- 15.Grakoui A, et al. The immunological synapse: a molecular machine controlling T cell activation. Science. 1999;285:221–227. [PubMed] [Google Scholar]
- 16.Rozdzial MM, Malissen B, Finkel TH. Tyrosine-phosphorylated T cell receptor zeta chain associates with the actin cytoskeleton upon activation of mature T lymphocytes. Immunity. 1995;3:623–633. doi: 10.1016/1074-7613(95)90133-7. [DOI] [PubMed] [Google Scholar]
- 17.Valitutti S, Dessing M, Aktories K, Gallati H, Lanzavecchia A. Sustained signaling leading to T cell activation results from prolonged T cell receptor occupancy. Role of T cell actin cytoskeleton. J. Exp. Med. 1995;181:577–584. doi: 10.1084/jem.181.2.577. [DOI] [PMC free article] [PubMed] [Google Scholar]
- 18.Campi G, Varma R, Dustin ML. Actin and agonist MHC-peptide complex-dependent T cell receptor microclusters as scaffolds for signaling. J. Exp. Med. 2005;202:1031–1036. doi: 10.1084/jem.20051182. [DOI] [PMC free article] [PubMed] [Google Scholar]
- 19.Billadeau DD, Nolz JC, Gomez TS. Regulation of T-cell activation by the cytoskeleton. Nat. Rev. Immunol. 2007;7:131–143. doi: 10.1038/nri2021. [DOI] [PubMed] [Google Scholar]
- 20.Burkhardt JK, Carrizosa E, Shaffer MH. The actin cytoskeleton in T cell activation. Annu. Rev. Immunol. 2008;26:233–259. doi: 10.1146/annurev.immunol.26.021607.090347. [DOI] [PubMed] [Google Scholar]
- 21.Ilani T, Vasiliver-Shamis G, Vardhana S, Bretscher A, Dustin ML. T cell antigen receptor signaling and immunological synapse stability require myosin IIA. Nat. Immunol. 2009;10:531–539. doi: 10.1038/ni.1723. [DOI] [PMC free article] [PubMed] [Google Scholar]
- 22.Hashimoto-Tane A, et al. Dynein-driven transport of T cell receptor microclusters regulates immune synapse formation and T cell activation. Immunity. 2011;34:919–931. doi: 10.1016/j.immuni.2011.05.012. [DOI] [PubMed] [Google Scholar]
- 23.Altman JD, Reay PA, Davis MM. Formation of functional peptide complexes of class II major histocompatibility complex proteins from subunits produced in Escherichia coli. Proc. Natl. Acad. Sci. USA. 1993;90:10330–10334. doi: 10.1073/pnas.90.21.10330. [DOI] [PMC free article] [PubMed] [Google Scholar]
- 24.Toebes M, et al. Design and use of conditional MHC class I ligands. Nat. Med. 2006;12:246–251. doi: 10.1038/nm1360. [DOI] [PubMed] [Google Scholar]
- 25.Grotenbreg GM, et al. Empty class II major histocompatibility complex created by peptide photolysis establishes the role of DM in peptide association. J. Biol. Chem. 2007;282:21425–21436. doi: 10.1074/jbc.M702844200. [DOI] [PMC free article] [PubMed] [Google Scholar]
- 26.Weber KS, et al. Distinct CD4+ helper T cells involved in primary and secondary responses to infection. Proc. Natl. Acad. Sci. USA. doi: 10.1073/pnas.1202408109. (in the press). [DOI] [PMC free article] [PubMed] [Google Scholar]
- 27.Rock EP. Ph.D. thesis. Stanford Univ.; 1993. Structure-Function Analysis of Antigen-Specific T Cell Receptors; pp. 60–91. [Google Scholar]
- 28.Kaye J, et al. Selective development of CD4+ T cells in transgenic mice expressing a class II MHC-restricted antigen receptor. Nature. 1989;341:746–749. doi: 10.1038/341746a0. [DOI] [PubMed] [Google Scholar]
- 29.Cemerski S, et al. The stimulatory potency of T cell antigens is influenced by the formation of the immunological synapse. Immunity. 2007;26:345–355. doi: 10.1016/j.immuni.2007.01.013. [DOI] [PMC free article] [PubMed] [Google Scholar]
- 30.Newell EW, et al. Structural basis of specificity and cross-reactivity in T cell receptors specific for cytochrome c-I-Ek. J. Immunol. 2011;186:5823–5832. doi: 10.4049/jimmunol.1100197. [DOI] [PMC free article] [PubMed] [Google Scholar]
- 31.Carbone FR, Bevan MJ. Induction of ovalbumin-specific cytotoxic T cells by in vivo peptide immunization. J. Exp. Med. 1989;169:603–612. doi: 10.1084/jem.169.3.603. [DOI] [PMC free article] [PubMed] [Google Scholar]
- 32.Fremont DH, Stura EA, Matsumura M, Peterson PA, Wilson IA. Crystal structure of an H-2Kb-ovalbumin peptide complex reveals the interplay of primary and secondary anchor positions in the major histocompatibility complex binding groove. Proc. Natl. Acad. Sci. USA. 1995;92:2479–2483. doi: 10.1073/pnas.92.7.2479. [DOI] [PMC free article] [PubMed] [Google Scholar]
- 33.Purbhoo MA, Irvine DJ, Huppa JB, Davis MM. T cell killing does not require the formation of a stable mature immunological synapse. Nat. Immunol. 2004;5:524–530. doi: 10.1038/ni1058. [DOI] [PubMed] [Google Scholar]
- 34.Juang J, et al. Peptide-MHC heterodimers show that thymic positive selection requires a more restricted set of self-peptides than negative selection. J. Exp. Med. 2010;207:1223–1234. doi: 10.1084/jem.20092170. [DOI] [PMC free article] [PubMed] [Google Scholar]
- 35.Mombaerts P, et al. RAG-1-deficient mice have no mature B and T lymphocytes. Cell. 1992;68:869–877. doi: 10.1016/0092-8674(92)90030-g. [DOI] [PubMed] [Google Scholar]
- 36.Hogquist KA, et al. T cell receptor antagonist peptides induce positive selection. Cell. 1994;76:17–27. doi: 10.1016/0092-8674(94)90169-4. [DOI] [PubMed] [Google Scholar]
- 37.Boniface JJ, et al. Initiation of signal transduction through the T cell receptor requires the multivalent engagement of peptide/MHC ligands. Immunity. 1998;9:459–466. doi: 10.1016/s1074-7613(00)80629-9. [DOI] [PubMed] [Google Scholar]
- 38.Cochran JR, Cameron TO, Stern LJ. The relationship of MHC-peptide binding and T cell activation probed using chemically defined MHC class II oligomers. Immunity. 2000;12:241–250. doi: 10.1016/s1074-7613(00)80177-6. [DOI] [PubMed] [Google Scholar]
- 39.Cebecauer M, et al. CD8+ cytotoxic T lymphocyte activation by soluble major histocompatibility complex-peptide dimers. J. Biol. Chem. 2005;280:23820–23828. doi: 10.1074/jbc.M500654200. [DOI] [PubMed] [Google Scholar]
- 40.Kim ST, et al. The αβ T cell receptor is an anisotropic mechanosensor. J. Biol. Chem. 2009;284:31028–31037. doi: 10.1074/jbc.M109.052712. [DOI] [PMC free article] [PubMed] [Google Scholar]
- 41.Li YC, et al. Cutting Edge: mechanical forces acting on T cells immobilized via the TCR complex can trigger TCR signaling. J. Immunol. 2010;184:5959–5963. doi: 10.4049/jimmunol.0900775. [DOI] [PubMed] [Google Scholar]
- 42.Ma Z, Finkel TH. T cell receptor triggering by force. Trends Immunol. 2010;31:1–6. doi: 10.1016/j.it.2009.09.008. [DOI] [PMC free article] [PubMed] [Google Scholar]
- 43.Howarth M, et al. A monovalent streptavidin with a single femtomolar biotin binding site. Nat. Methods. 2006;3:267–273. doi: 10.1038/NMETHXXX. [DOI] [PMC free article] [PubMed] [Google Scholar]
- 44.Luescher IF, Cerottini JC, Romero P. Photoaffinity labeling of the T cell receptor on cloned cytotoxic T lymphocytes by covalent photoreactive ligand. J. Biol. Chem. 1994;269:5574–5582. [PubMed] [Google Scholar]
- 45.Luescher IF, et al. Structural analysis of TCR-ligand interactions studied on H-2Kd-restricted cloned CTL specific for a photoreactive peptide derivative. Immunity. 1995;3:51–63. doi: 10.1016/1074-7613(95)90158-2. [DOI] [PubMed] [Google Scholar]
- 46.Naeher D, et al. A constant affinity threshold for T cell tolerance. J. Exp. Med. 2007;204:2553–2559. doi: 10.1084/jem.20070254. [DOI] [PMC free article] [PubMed] [Google Scholar]
- 47.Hudrisier D, et al. The efficiency of antigen recognition by CD8+ CTL clones is determined by the frequency of serial TCR engagement. J. Immunol. 1998;161:553–562. [PubMed] [Google Scholar]
- 48.Leyva E, Platz MS, Persy G, Wirz J. Photochemistry of phenyl azide - the role of singlet and triplet phenylnitrene as transient intermediates. J. Am. Chem. Soc. 1986;108:3783–3790. [Google Scholar]
- 49.Varma R, Campi G, Yokosuka T, Saito T, Dustin ML. T cell receptor-proximal signals are sustained in peripheral microclusters and terminated in the central supramolecular activation cluster. Immunity. 2006;25:117–127. doi: 10.1016/j.immuni.2006.04.010. [DOI] [PMC free article] [PubMed] [Google Scholar]
- 50.Yokosuka T, et al. Newly generated T cell receptor microclusters initiate and sustain T cell activation by recruitment of Zap70 and SLP-76. Nat. Immunol. 2005;6:1253–1262. doi: 10.1038/ni1272. [DOI] [PubMed] [Google Scholar]
- 51.Lee KH, et al. The immunological synapse balances T cell receptor signaling and degradation. Science. 2003;302:1218–1222. doi: 10.1126/science.1086507. [DOI] [PubMed] [Google Scholar]
- 52.Cemerski S, et al. The balance between T cell receptor signaling and degradation at the center of the immunological synapse is determined by antigen quality. Immunity. 2008;29:414–422. doi: 10.1016/j.immuni.2008.06.014. [DOI] [PMC free article] [PubMed] [Google Scholar]
Associated Data
This section collects any data citations, data availability statements, or supplementary materials included in this article.