Abstract
Most X-ray tubes comprise a rotating anode that is bombarded with electrons to produce X-rays. A substantial amount of heat is generated, and to increase the area of the anode exposed to the electrons, without increasing the apparent size of the focal spot, the focal track of the anode is generally beveled with a very shallow angle (typically 5–7° in a computed tomography (CT) tube). Due to the line focus principle, this allows a fairly large area of the focal track to be exposed to electrons while retaining a fairly small effective projected focal spot. One side effect of anode angulation is that the focal spot appears different from different positions in the detector array; the effective focal spot size at a constant distance from the tube will be larger for a peripheral detector than for a central one. These differences in the effective size of the focal spot across the field of view lead to worse resolution in the periphery than in the center of reconstructed images. In this work we describe a method for achieving more uniform resolution in fanbeam CT images by correcting for these focal spot angulation effects. We do so by modeling the effects as a series of local blurrings in the space of transmitted CT intensities and determining the effective coefficients of the corresponding discrete convolutions. The effect of these blurrings can then be compensated for in the sinogram domain through the use of a penalized-likelihood sinogram restoration model we have recently developed.
Index Terms: Computed tomography, sinogram restoration
I. Introduction
Most modern X-ray tubes comprise a circular rotating anode of tungsten or other high-atomic-number material. Electrons boiled off from the tube’s cathode are drawn across a vacuum by the potential difference between the anode and the cathode and interact in the anode. These interactions give rise to X-rays by means of bremstrahlung radiative losses and emission of characteristic X-rays from atoms whose inner shell electrons are liberated by the incident electrons. Substantial amounts of non-radiative (heat) energy is generated as well, and the rotation of the anode allows for this energy to be dissipated over a wider area [1], [2].
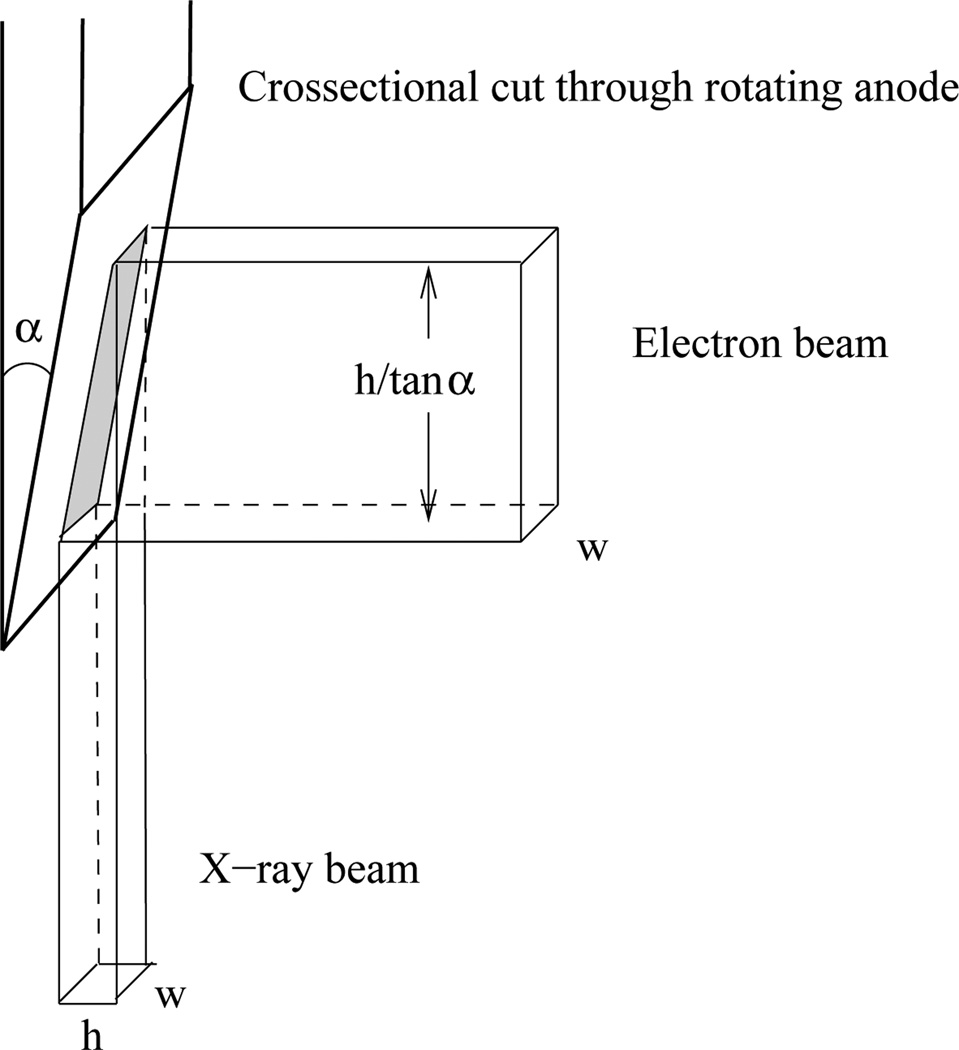
To further increase the area of the anode exposed to the electron beam, without unnecessarily increasing the apparent size of the focal spot, the edge of the anode known as the focal track is generally beveled with a very small angle (typically 5–7 degrees in a CT tube). Due to the line-focus principle illustrated in Fig. 1, this allows a fairly large area of the focal track to be exposed to electrons while retaining a fairly small effective projected focal spot [1], [2].
Figure 1.
Illustration of the line-focus principle employed in X-ray anodes. By beveling the edge of the anode, the electron beam (traveling in from the right in this figure) can expose a relatively large expanse of anode while the projected cross-section of the X-ray beam (traveling downward in this figure) remains relatively small.
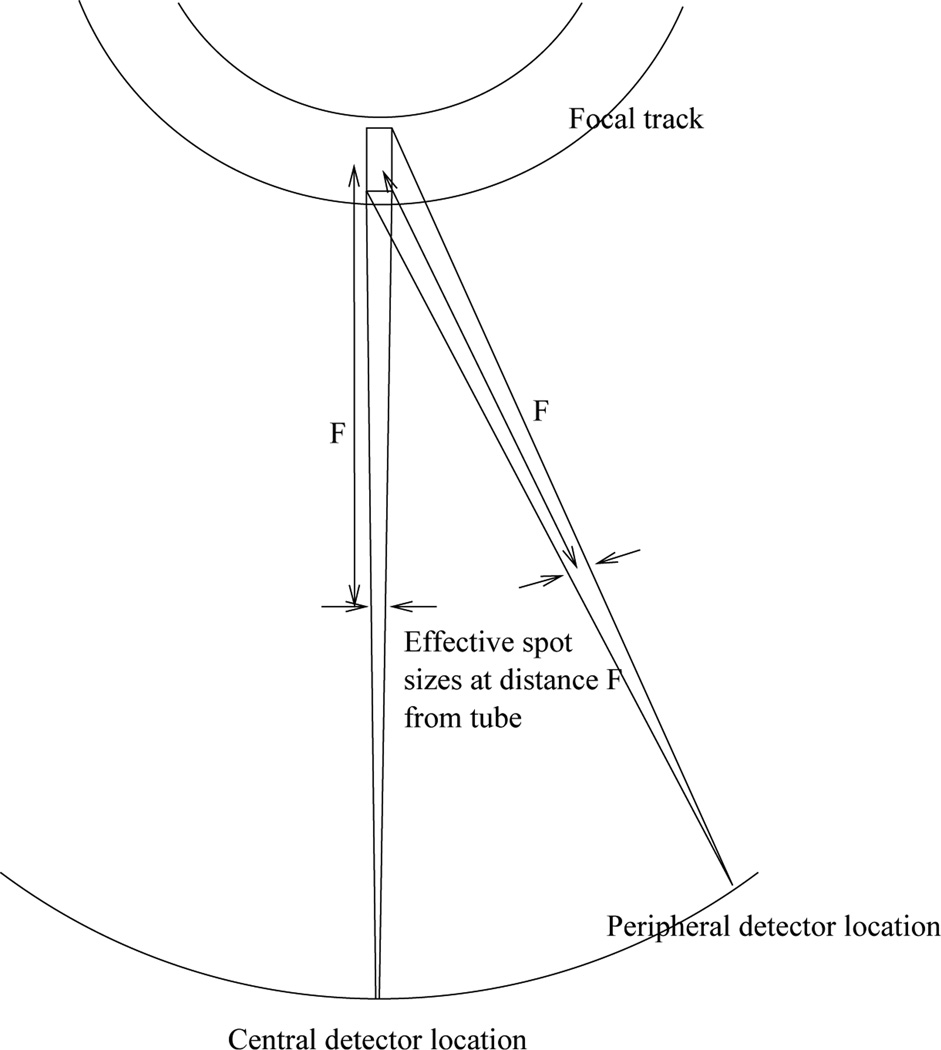
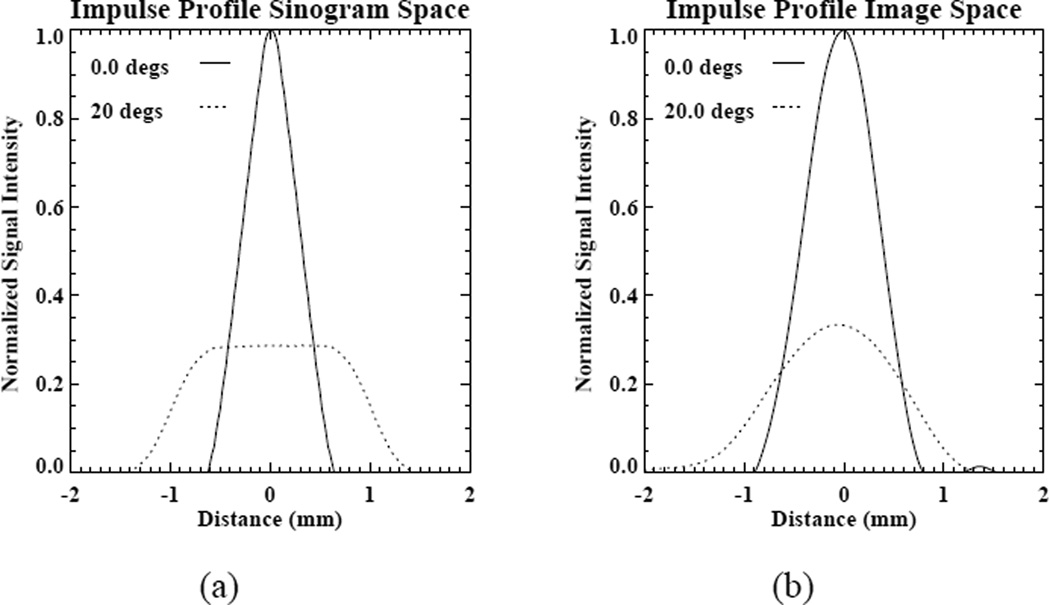
One side effect of the anode angulation, however, is that the rectangular, angled focal spot is seen differently from different positions in the detector array [2]. The central detector channels are the primary beneficiary of the line-focus principle, seeing the minimal projected focal spot. More peripheral detectors see the spot from an angle that somewhat mitigates the line-focus benefit. This is illustrated in Fig. 2, which shows a view along the longitudinal axis of the scanner demonstrating that the effective focal spot size at a constant distance from the tube will be larger for a peripheral detector than for a central one. Similarly, an impulse placed a constant distance from the source will produce a larger projection if placed peripherally than if placed centrally. This is confirmed through numerical simulation employing the Radonis CT simulation package (Philips Research and Development, Hamburg) in which we employed a 5-degree anode angle with projected focal spot size of longitudinal height 0.9 mm and transverse width 0.7 mm and we simulated very small (0.02 mm) detector channels so as to focus attention on the source effects (for all the other results in this paper we simulate standard size detector channels). The source was divided into a 5×5 grid of sourcelets and the detector into a 3×3 grid of detectorlets [3]. The projections of impulses placed at 0 degrees and 20 degrees off the axis connecting the center of the source to the center of the detector array are shown in Fig. 3(a). A similar plot is given by Hsieh [2].
Figure 2.
A view along the scanner longitudinal axis depicting the view of the focal spot from a central detector location and from a peripheral one. The peripheral location sees an effectively larger focal spot.
Figure 3.
(a) Projection of impulses of size 0.1 mm placed 0 degrees and 20 degrees off the axis connecting the center of the source to the center of the detector array. The off-axis impulse projection has been shifted and overlaid on the central impulse projection. (b) Overlaid reconstructions of these impulses.
As will be shown for typical focal spot and detector sizes, these differentials in the effective size of the focal spot across the field of view can degrade the uniformity of resolution achievable in reconstructed images. This is clearly a complex issue in fanbeam CT, involving questions also of resolution non-uniformities introduced by reconstruction algorithms themselves through, for example, linear interpolation among non-uniformly spaced samples. However, for typical source and detector sizes, one would expect the anode angle effect to lead to poorer resolution in the periphery than in the center of reconstructed images. This is confirmed by the radial profiles through the reconstructions of the simulated impulses shown in Fig. 3(b). The more peripheral impulse is obviously broader than the central one.
In this work we describe a method for achieving more uniform resolution in fanbeam CT images by correcting for the differential blurring effects of anode angulation. We do so by modeling the effects of the anode angle as a series of local blurrings in the space of transmitted CT intensities and determining the effective coefficients of the discrete convolutions characterizing these local blurrings. The effect of these blurrings can then be compensated for in the sinogram domain through the use of a penalized-likelihood sinogram restoration model we have recently developed [4]. For simplicity of presentation, we focus on the single-slice circular fanbeam case. In the discussion section, we describe how this strategy could be extended to helical and multislice scans.
II. Methods
A. Characterizing sinogram-domain anode angle blurring
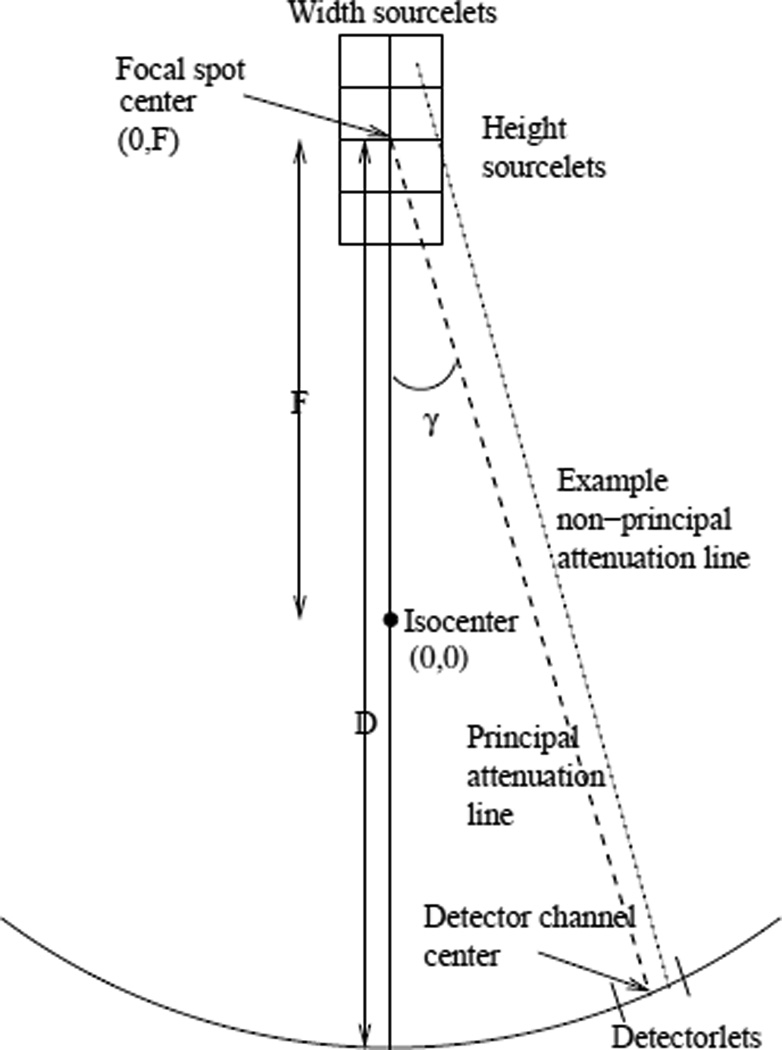
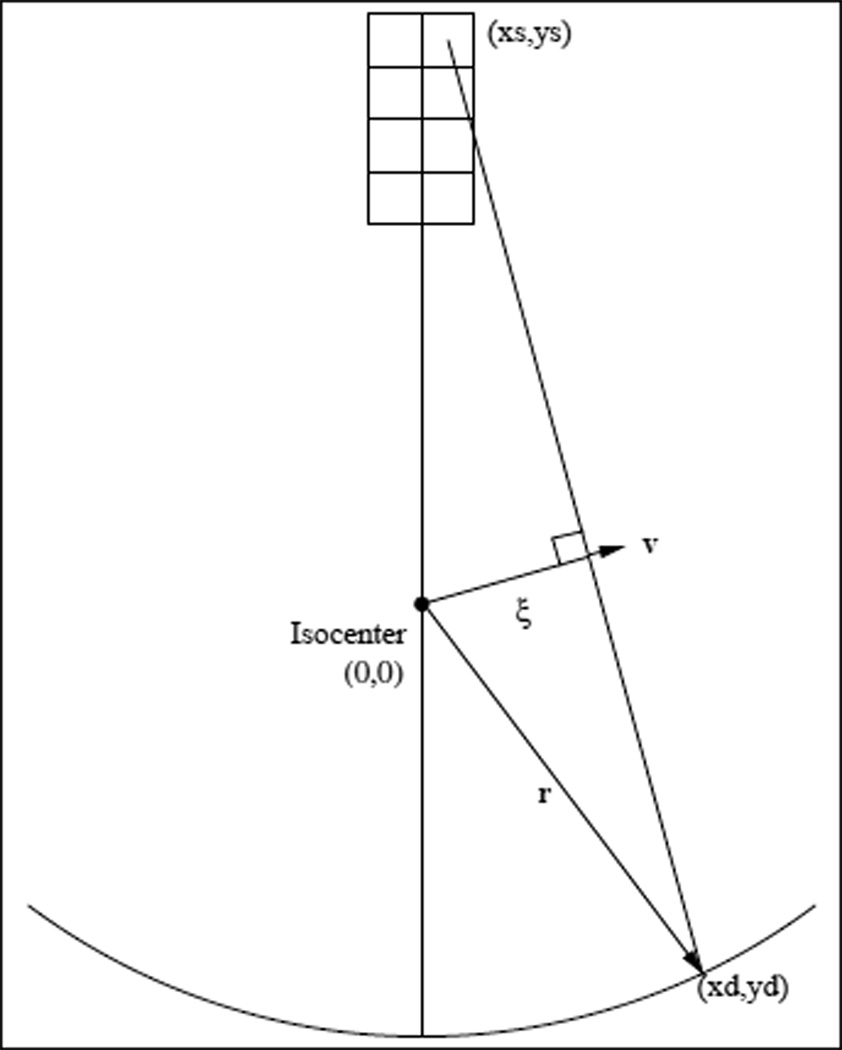
In Fig. 4, we show a transverse (x−y) view of a single-slice CT scanner with the focal spot (greatly exaggerated in size) shown at angle β = 0 from the vertical. As in Fig. 2, this is a projection view of the focal spot, which in reality is slightly angled out of the plane shown. A dashed line labeled “Principal attenuation line” is shown connecting the center of the focal spot to the center of a detector channel of interest; it makes an angle γ with the line connecting the center of the source to the isocenter of the system.
Figure 4.
The geometry of a CT measurement. See text for more detailed explanation.
Analytic image reconstruction algorithms implicitly assume that the measurement obtained by the detector channel shown represents the X-ray transmission through the object along the ideal line characterized by specific fanbeam coordinates γ and β (where β = 0 in this figure). In practice, of course, the measurement obtained actually reflects an average transmission through the object along all possible lines connecting every point on the source to every point within the detector channel, which we assume to have width Δγ.1 The dotted line labeled “Example non-principal attenuation line” represents one such line. This averaging obviously limits the resolution achievable in a CT scan and can also introduce artifacts known as nonlinear partial volume artifacts [5]. Further averaging also takes place in the β direction since CT X-ray tubes typically remain on constantly during a scan and detectors integrate the X-ray induced signal while the tube and detectors are rotating a small amount Δβ in β.
A crucial point for our algorithm is that any non-principal attenuation line like the one depicted in Fig. 4 can itself be characterized by a pair of fanbeam coordinates β and γ. We determine these coordinates as follows. Consider the line connecting a given point on the focal spot, with transverse coordinates (xs,ys), to a given point on the detector array, with transverse coordinates (xd,yd), as depicted in Fig. 5. It is straightforward to determine the parallel-beam coordinates of this line. The vector v that is normal to the line is given by
| (1) |
Figure 5.
Illustration of the coordinates used.
Defining the vector
| (2) |
then the perpendicular distance from the isocenter to the line is given by
| (3) |
and its angle with the x-axis by
| (4) |
where vx and vy are the x and y components, respectively, of the vector v. The corresponding fanbeam coordinates [6] can then be found by use of
| (5) |
where F is the source-to-isocenter distance and
| (6) |
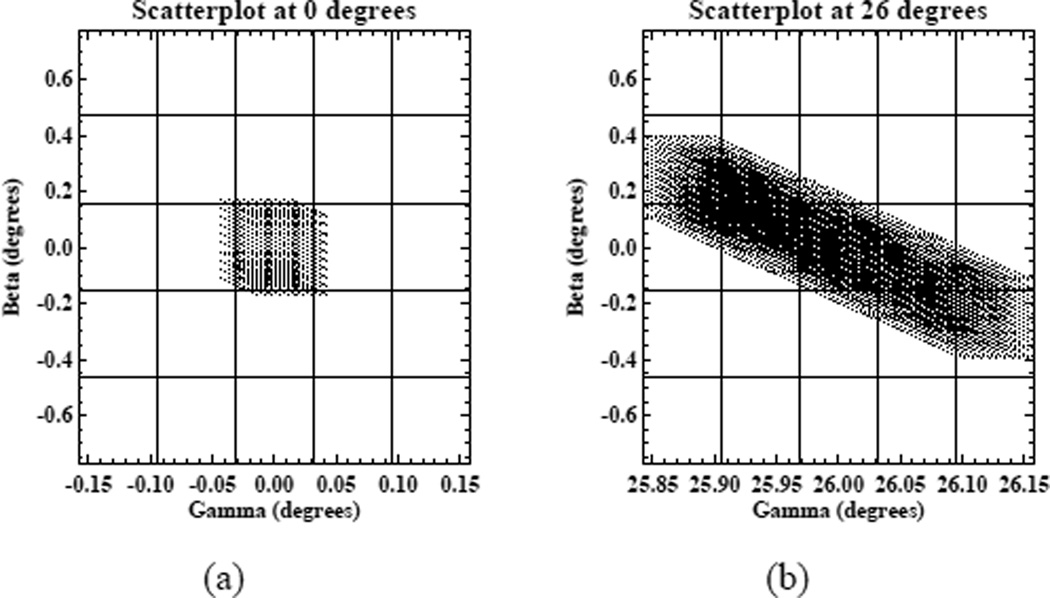
We can then characterize the set of such lines contributing to a given measurement by subdividing the source into numerous “sourcelets” in the width and height directions, by subdividing the detector channel’s angular width Δγ of interest into “detectorlets” in the fan angle direction and by subdividing the trajectory into “trajectorylets” spanning the sampling interval Δβ between measurements. As an example, for a measurements centered at β = 0 and γ = 0.0, we subdivided the source into 10 × 10 sourcelets, the detector into 10 detectorlets and the trajectory interval into 10 sourcelets. This yielded 104 lines contributing to the measurement and we determined the fanbeam coordinates of each such line by the method described above. We then make a scatterplot of the resulting coordinates, as shown in Fig. 6(a). We did the same for a channel centered at γ = 26.0 degrees. The scatterplot is shown in Fig. 6(b). The grid overlaid in the scatterplot represents squares of dimension Δγ in γ and Δβ in β.
Figure 6.
Scatterplots of attenuation lines contributing to measurements centered at β = 0, γ = 0 (left) and β = 0, γ = 26.0 degrees (right). The grid overlaid in the scatterplot represents squares of dimension Δγ in γ and Δβ in β.
It can be seen that for the central area of the detector centered around γ = 0, the lines contributing the the measurement nearly all lie within a rectangle of side Δγ by Δβ. This suggests that most of the blurring implicit in this measurement is due to the finite detector width, which is Δγ, and the finite trajectory interval Δβ over which the data is averaged. The blurring due to the finite focal spot size causes only minor additional spreading beyond this central box of dimensions Δγ by Δβ. For the peripheral channel, the blurring is much more significant, spanning nearly 5Δγ in the γ direction and 3Δβ in the β direction.
Note that in this analysis, we are ignoring the averaging and obliqueness of the various lines in the longitudinal (z) direction due to the angulation of the anode and the finite longitudinal extent of the detector. This is because our interest in mainly in modeling and compensating for differential averaging effects in the transverse plane, and these effects are not strongly influenced by the longitudinal averaging that is also present.
B. Determining discrete blurring coefficients
With this understanding in hand, one could imagine pursuing the fairly ambitious goal of deconvolving these response functions entirely, in order to recover genuinely ideal line integrals that represent delta sampling of the underlying fanbeam sinogram. In the presence of noise, such a super-resolution strategy is fraught with peril and unlikely to meet with success.
We pursue the more reasonable strategy of attempting to equalize the resolution across the sinogram by compensating for the differential effects seen in comparing Figs. 6(a) and (b). The goal, then, is not ideal delta-sampled line integrals, but rather to achieve approximately uniform Δγ by Δβ resolution across the sinogram. To do this, we need to discretize the scatterplots of the kinds shown in Figs. 6(a) and (b) to obtain coefficients that represent effective blurrings that link the samples of the target, uniform-resolution sinogram to samples of the measured, non-uniform resolution sinogram. Such discretization is facilitated by the fact that the sampling interval in the sinogram is Δγ in the γ dimension and Δβ in the β and thus we need simply find one coefficient for each of the grid shown in Figs. 6(a) and (b). In other words, we wish to find coefficients bij such that we can write
where are the samples of the uniform-resolution sonogram and the samples of the measured sinogram. Ny is the total number of measurements in the sinogram, given by the number of detector channels times the number of projection views acquired (and times the number of rows in a multi-row scanner). Naturally, the matrix B, of which the bij are elements, is very sparse. For the scatterplot of Fig. 6(b), for example, there would be at most 11 non-zero elements in the corresponding row of B. These coefficients can then be incorporated into our previously described sonogram restoration model [4]. This approach seeks to deconvolve sinogram domain degradations by maximizing a penalized likelihood objective function. The result is a set of “ideal,” undegraded line integrals that can then be reconstructed by use of analytic algorithms. The details of the objective function are given in Appendix A.
A variety of approaches are possible for estimating these coefficients. The most obvious involves simply binning the points in the scatterplot into the 5×3 grid of boxes spanning 5Δγ in the γ direction and 3Δβ in the β direction and normalizing the result. We found that this lead to overestimation of the resolution nonuniformities seen in practice, since it assigned the average value of a relatively large bin to its center, so we have adopted a different strategy. We bin the scatterplot into at 45× 27 grid (still spanning 5Δγ in the γ direction and 3Δβ in the β direction, just with finer sampling), to which we apply a 5×5 boxcar smoothing filter. We then subsample the smoothed 45×27 grid down to the desired 5×3 grid by picking up the central value of each 9×9 subgrid.
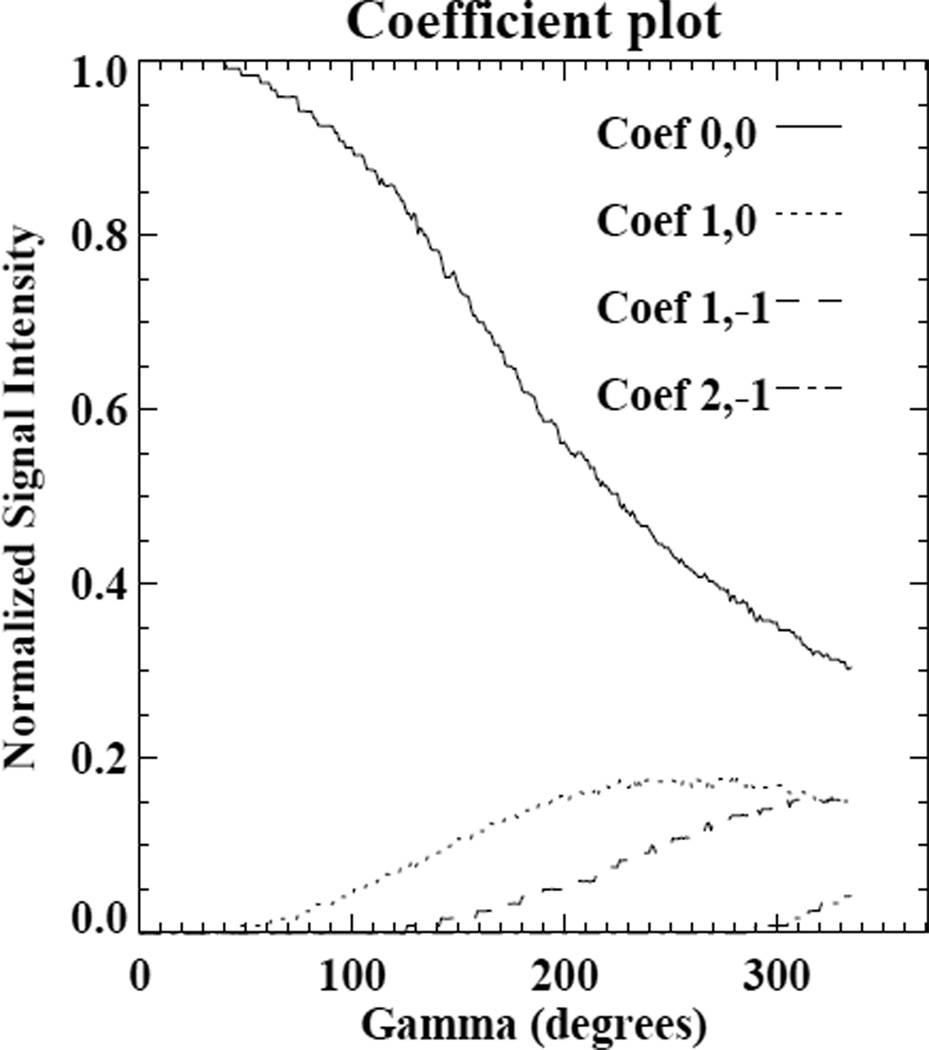
Figure 7 shows a plot of selected coefficients estimated in this way as a function of detector channel angle for a detector of 672 channels of size 1.4 mm (at the detector) with a sourceto- isocenter distance of 570 mm and a isocenter-to-detector distance of 470 mm. It can be seen that for the most central detectors there is no effective blurring and that the degree of blurring increases toward the periphery.
Figure 7.
Example estimated discrete blurring coefficients plotted as a function of detector channel angle. The coefficient indices are of the form (m,n) where m denotes the γ index and n the β index. The (0,0) coefficients correspond to the center of the grids shown in Figs. 6(a) and (b)
III. Results
A. Data simulation model
In order to validate these coefficients and explore our ability to deconvolve their effect, we used the Radonis CT simulation environment (Philips R&D). This package allows one to define the geometry of the source and detectors, including anode angulation, as well as to specify subdivision of the source, detectors, and trajectory into given numbers of sourcelets, detectorlets, and trajectorylets. It then calculates the analytic line integrals through numerical phantoms defined as superpositions of geometric primitives such as ellipsoids and averages the exponentiated line integrals to obtain the simulate measurements.
We used the package to simulate two kind of sinogram. A “standard sinogram” was simulated employing an anode angle of 5 degrees, with a projected focal spot size of height 0.9 mm and width 0.7 mm. In the transverse direction, the source is normal to the line connecting it to the isocenter. The source was subdivided into 5×5 sourcelets for the simulation.
A “uniform resolution sinogram” was simulated using an idealized tube with a one dimensional focal spot of height 0.9 mm and of infinitesimal width with no angulation, i.e, configured parallel to the detector array. The source was subdivided into 5 sourcelets in the height dimension. The target sinogram obtained in this configuration should contain no transverse blurring due to focal spot effects since the focal spot is infinitesimally narrow in the transverse direction.
In both cases, we simulated a focal length of 570.0 mm and a single-row detector of 672 channels of transverse extent 1.4 mm each and of longitudinal extent 1.0 mm (both measured at the detector). We subdivided the detector channels into 5 × 5 detectorlets. We simulated 1160 projections evenly spaced over 360 degrees. In doing so, we subdivided each such sampling interval into 5 trajectorylets to model the effect of acquiring data while the source and detectors rotate. We found that using a larger number of “lets” than 5 for the source, detector, and trajectory produced virtually no change in the simulated data for the phantom employed but added substantially to computation time, which scales as the number of lets to the fifth power. It is also worth mentioning that this package does model the longitudinal angulation of the various lines of response, which we ignored above in developing our model for the sinogram blurring coefficients. This is as it should be. One naturally wants the simulated data to be as true to reality as possible, with approximation entering only during the later modeling and processing.
B. Impulse phantom
1) Reconstructed images
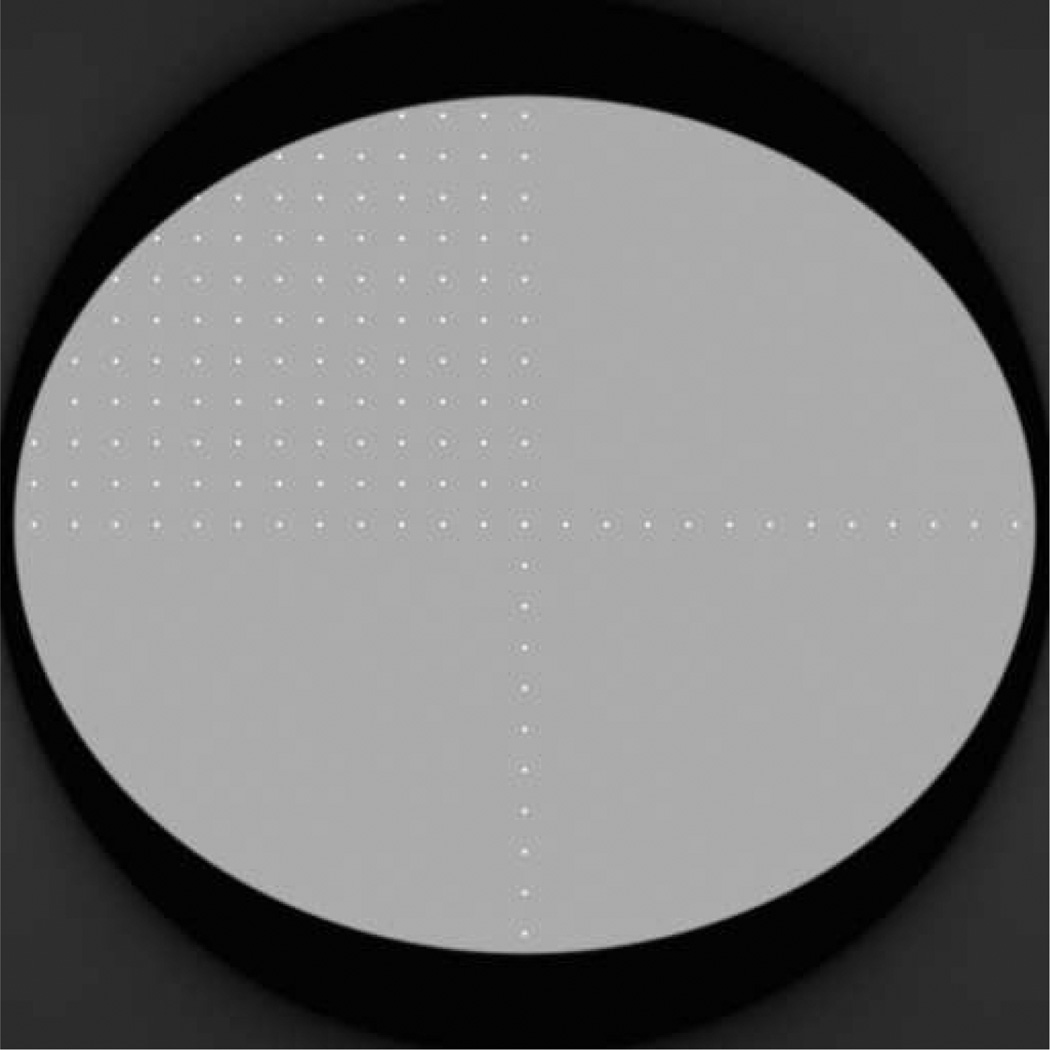
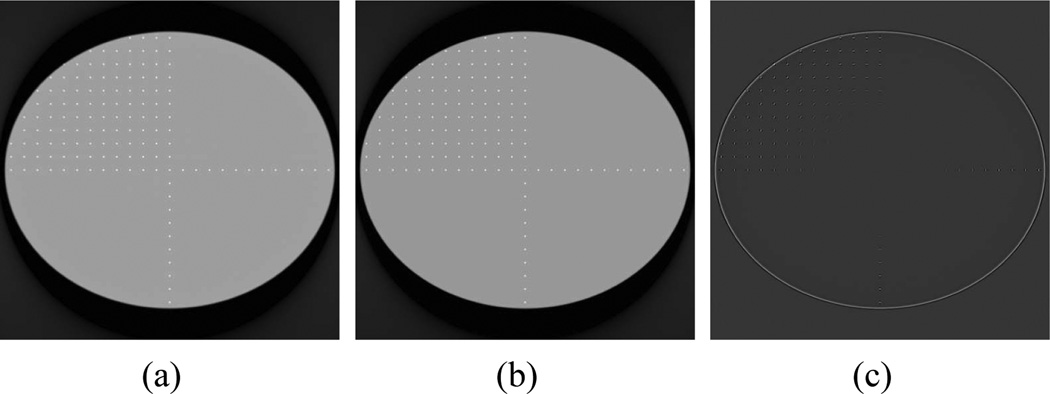
The first object considered was an elliptical phantom containing an array of point impulses of size 0.1 mm, as illustrated in Fig. 8. We reconstructed 512 × 512 images with 1 mm pixels from the standard sinogram and from a sinogram that had been corrected for anode angle effects by means of the algorithm described. For reconstruction, we use a fan-to-parallel rebinning algorithm involving Fourier rebinning in the angular direction and linear interpolation in the radial direction followed by parallel-beam FBP reconstruction with an unapodized ramp filter [7]. The resulting images, as well as a difference image, are shown in Fig. 9. The uncorrected image shows blurring of the impulses toward the periphery as compared to the corrected image. This is apparent in the subtracted image, which indicates that the two images match nearly perfectly near the center but differ more substantially near the periphery.
Figure 8.
Phantom used in studies of the algorithm.
Figure 9.
(a) Image of the impulse phantom without correction of the sinogram for anode angle effects. (b) Image of the impulse phantom after correction of the sinogram for anode angle effects. (c) Difference between the two images.
2) Resolution characterization
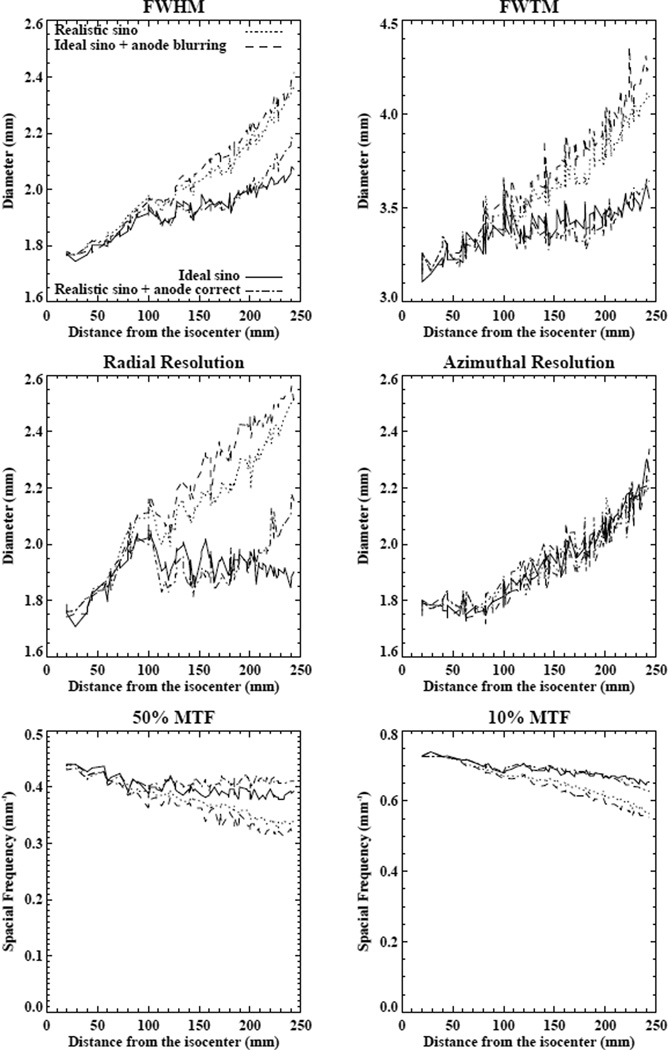
To characterize resolution more quantitatively we reconstructed zoomed images (with 0.1 mm pixels) of each of the impulses in the phantom in order to focus on sinogram resolution effects and eliminate the effect of reconstructed pixel size. We calculated a variety of parameters, including the average full width half maximum (FWHM) and full-width tenth maximum (FWTM). We also calculated what we call the radial FWHM of each impulse by calculating the FWHM of the profile through the impulse corresponding to the line connecting the origin of the phantom to the center of the impulse. The azimuthal FWHM is the FWHM of the profile perpendicular to that line. We plot the results versus the distance of the centers of the impulses from the origin in Fig. 10.
Figure 10.
Results for verifying forward and inverse models. The curve labeled “Ideal sino” is for the ideal “uniform resolution” sinogram, the curve labeled “Realistic sino” is for the standard resolution sinogram. The curve labeled “Ideal sino + anode blurring” is obtained when we apply our anode angle blurring coefficients to the uniform resolution sinogram. It matches the “Realistic sino” curve fairly well, as hoped. The curve labeled “Realistic sino + anode correct” is obtained by applying sinogram restoration to the standard sinogram. It agrees well with the “Ideal sino” curve, as hoped.
The curve labeled “Ideal sino” is for the ideal “uniform resolution” sinogram, the curve labeled “Realistic sino” is for the standard resolution sinogram. The difference between these two curves demonstrates the effect that anode angle has on resolution. For the system parameters employed, which are typical of Philips CT scanners, the radial resolution particularly gets about 30% worse at the edge of the field of view with an anode angle than with an idealized source. The shape of the ideal sino curves on the radial resolution plot merits some comment. The resolution is seen to worsen by about 10% as one moves out to 100 mm from isocenter and then to oscillate, with increasing frequency, by about 5% as one moves toward the edge of the field of view. This behavior can be attributed to the linear interpolation applied in rebinning from the fanbeam data to parallel beam samples. The fan to parallel rebinning first involves the use of the Fourier shift theorem to yield a set of nonuniformly sampled parallel beam projections. Linear interpolation is then used to generate uniform parallel beam samples. Near the center of the detector array, very little interpolation is needed as the rebinned fanbeam samples are nearly coincident with the parallel beam samples. The location of the needed samples gradually moves away from the measured samples, and are midway between the measurements about 100 mm from isocenter before starting to approach the measured samples again. The effect of interpolation on resolution then oscillates, with increasing freqeuncy, as the needed sample locations move away from and then toward the measured locations.
The curve labeled “Ideal sino + anode blurring” is obtained when we apply our anode angle blurring coefficients to the uniform resolution sinogram. It matches the “Realistic sino” curve fairly closely, indicating that our coefficients accurately capture the effect of the anode angle.
We then attempted to undo the effects of the anode angle by applying our sinogram restoration approach with the estimated coefficients to the Radonis-simulated 5-degree anode angle sinogram. The results are shown in the curve labeled “Realistic sino + anode correct” in Fig. 10. They agree well with the “ideal” uniform resolution results, indicating that the deconvolution has succeeded.
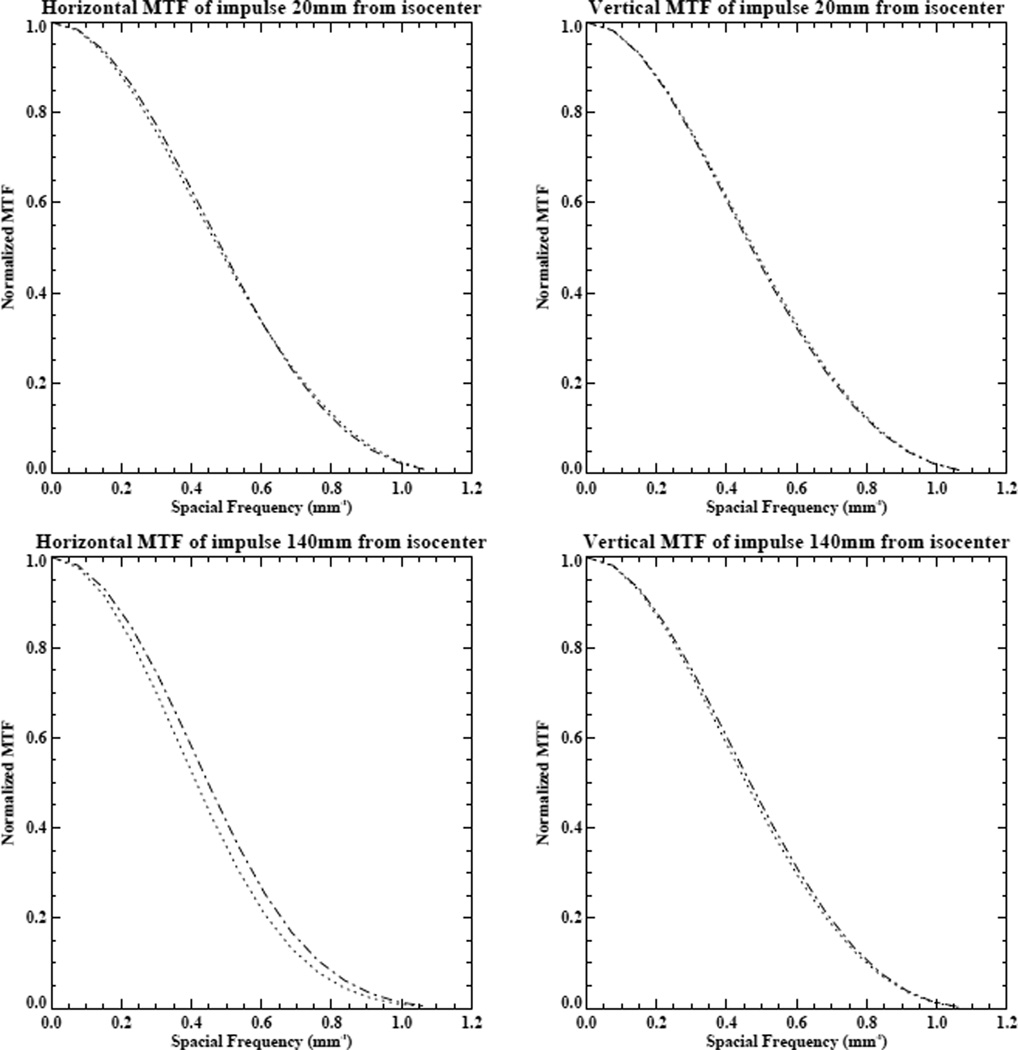
Because CT resolution is often characterized using modulation transfer functions (MTFs), we also calculated MTFs by computing the normalized modulus of the two-dimensional discrete Fourier transform of the impulse reconstructions. Typical vertical and horizontal plots through the MTFs at 20mm and 140 mm from the isocenter are shown in Fig. 11 for the uncorrected and corrected images. It can be seen that at 20 mm, the MTFs are essentially identical, while at 140 mm there is a clear enhancement of the horizontal MTF after correction for the anode angle effects. The average 50% and 10% values of MTF for the various methods under consideration are shown in Fig. 10; they are consistent with the results for the FWHM and FWTM of the impulses, which is, of course, not surprising since they are calculated from the same impulse data.
Figure 11.
Horizontal and vertical MTFs calculated for impulses located 20mm and 140 mm from the isocenter for the uncorrected (dotted line) and corrected (dashed-dotted line) images.
3) Noise effects
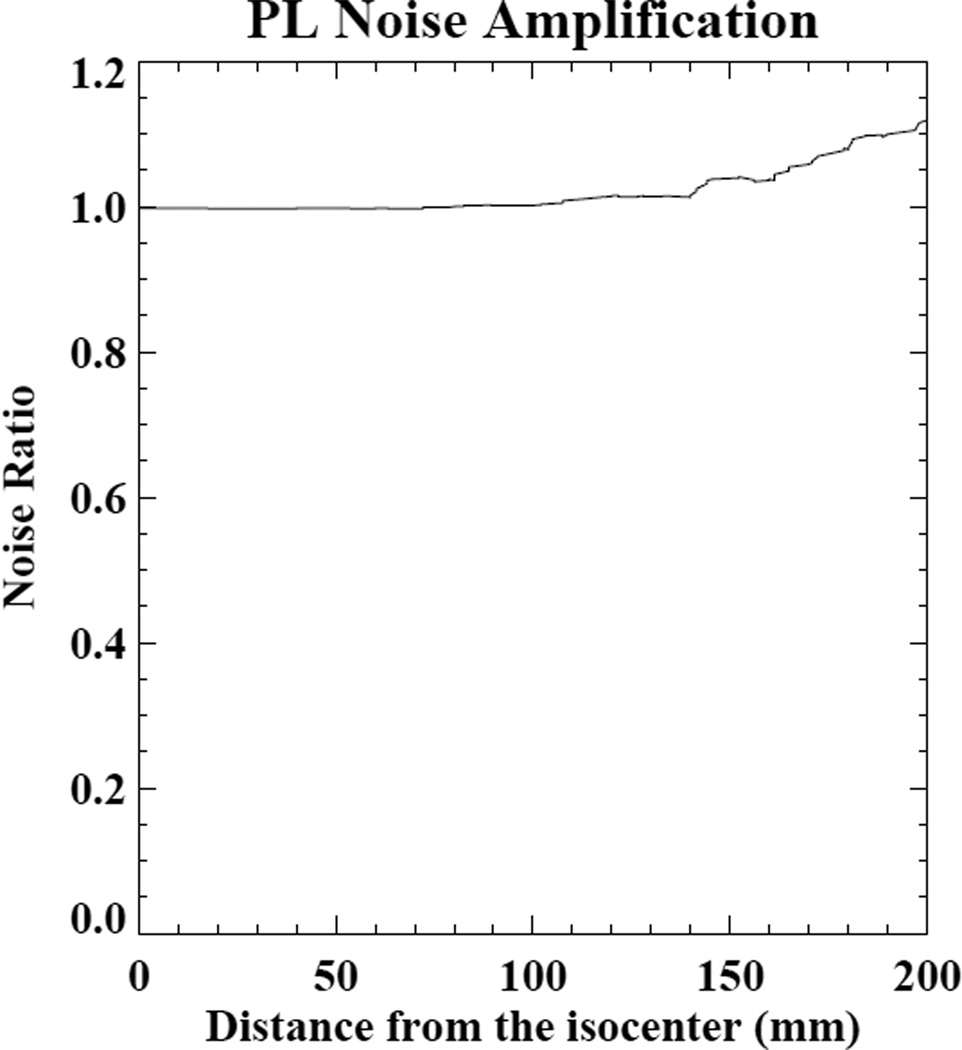
We obtain very similar results in the presence of noise. To quantify the presumed amplification of noise that arises when employing this technique with noisy data, we calculated the standard deviation in circular regions of interest around the impulses located at various distances from the isocenter in both the image reconstructed from the standard sinogram and the image reconstructed after applying our deconvolution approach to this sinogram. In Fig. 12 we plot the ratio of the standard deviations in these two images, where it can be seen that the proposed approach produces a relatively mild, distance-dependent noise amplification, peaking at about 10% at the periphery. The relatively mild noise increase is made possible by the use of the iterative penalized likelihood algorithm which regularizes the otherwise potentially unstable deconvolution.
Figure 12.
Ratio of standard deviation in image ROIs for images reconstructed with and without application of our anode angle resolution correction approach.
C. Phantom images
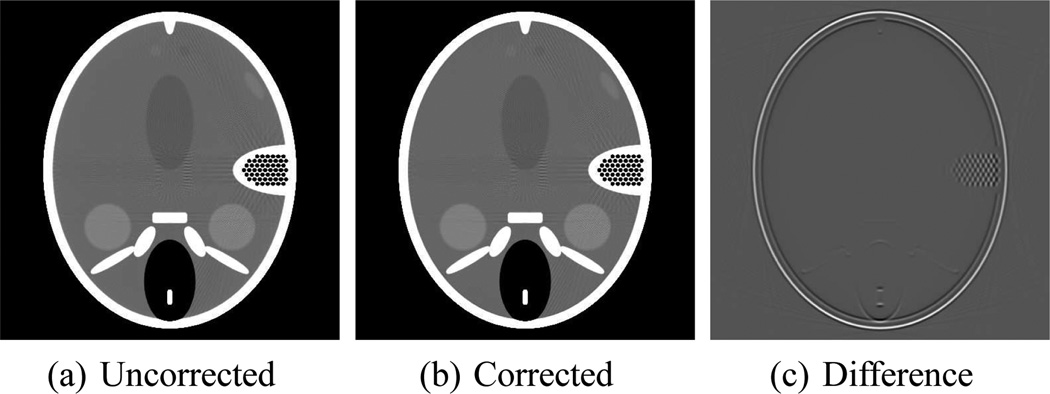
To demonstrate that the method does not introduce any obvious artifacts when faced with sharp transitions in contrast, we reconstructed images of the Forbild head phantom with and without correction for the effects of the anode angle. The simulation geometry was described in Sec. III-A and we reconstructed images on a 512×512 grid of 1 mm pixels. The uncorrected and corrected images, as well as a difference image, are shown in Fig. 14. It can be seen that the proposed algorithm does not introduce any artifacts and that it sharpens the edges of peripheral objects.
Figure 14.
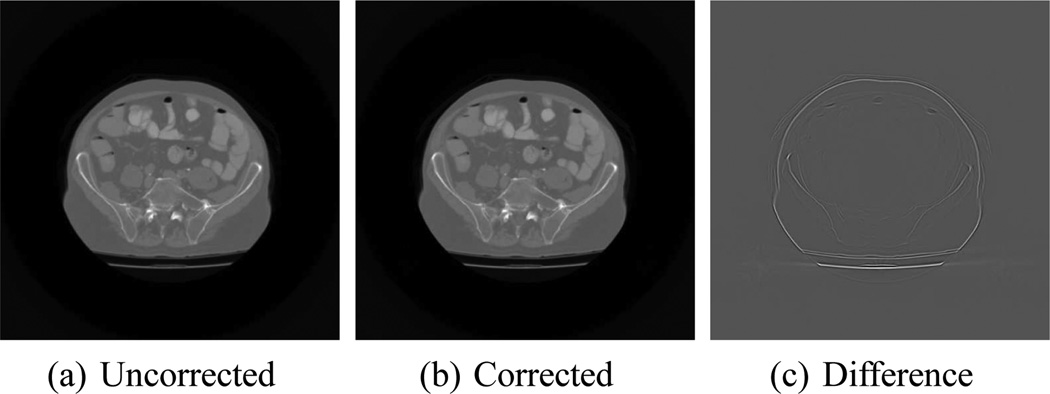
(a) Uncorrected reprojected abdominal slice. (b) Image after sinogram-domain correction for anode angle effects. (c) The difference between the two images.
D. Anatomically realistic image
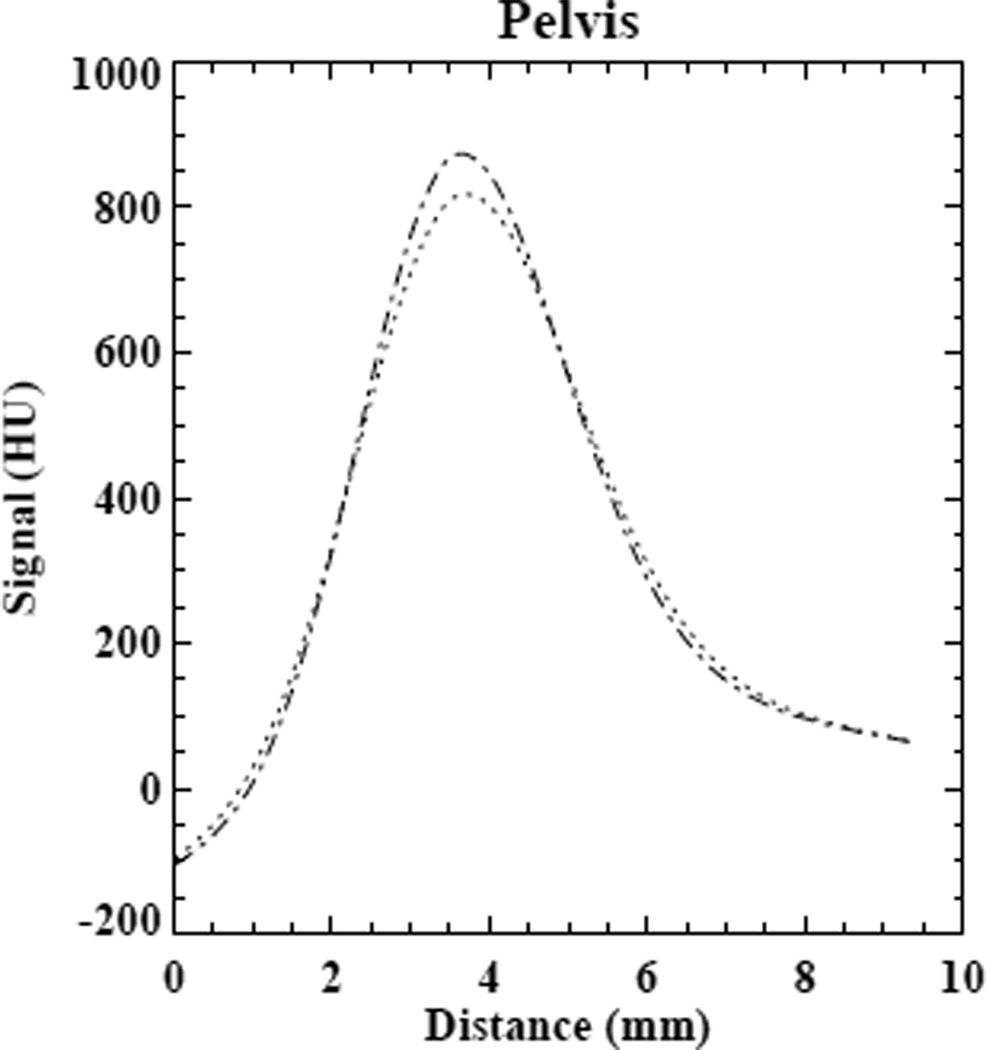
Finally, we tested the algorithm on data obtained by reprojecting a reconstructed clinical abdominal dataset using the same geometry described in Sec. III-A. The uncorrected and corrected images, as well as a difference image, are shown in Fig. 14. The difference image reveals an enhancement of resolution and contrast at the periphery of the field of view. This is further confirmed by the line plot through the pelvic bone shown in Fig. 15, which shows a contrast enhancement of about 10% after correction.
Figure 15.
Line plot through the pelvic bone in the images of Fig. 14 The dotted line is the plot through the uncorrected image, the dashed-dotted line through the corrected image.
IV. Discussion and Conclusions
We have explored the effect of anode angulation on resolution uniformity across the field of view in circular fanbeam CT. The effect of anode angulation is that the peripheral detector channels see an effectively larger focal spot than do the central channels. This results in degradation of resolution toward the periphery of the field of view. For the typical scanner parameters simulated, we observed a nearly 30% increase in the radial extent of a reconstructed impulse at the edge of a 50-cm field of view relative to that at the center.
We have also proposed a way of correcting for this resolution non-uniformity by modeling the effect of anode angulation as a series of discrete local blurrings of an ideal, “uniform” resolution sinogram. We have shown how to calculate the relevant coefficients and how to compensate for the effect by use of a sinogram preprocessing approach we have previously developed.
For simplicity of presentation, we assumed that the flux of X-rays emerging from the rectangular focal spot was uniform. In practice, the spatial distribution of X-rays emerging from the focal spot may be non-uniform: a Gaussian shape, for instance. It would be very straightforward to incorporate this kind of distribution into the estimation of the coefficients of our model simply by appropriately weighting the contribution of various lines in the scatterplots used to calculate the coefficients.
The algorithm can readily accommodate the use of quarter detector offset (QDO) and flying focal spot (FFS). QDO by itself would have essentially no effect on the application of the algorithm since it effectively involves a small shift of the detector fanbeam coordinates at each view and would not alter the calculation or application of the blurring coefficients. Transverse FFS introduces a second set of line integral samples at each view, and these two sets of measurements could be interleaved with each other. In this case, the calculation and subsequent deconvolution of the blurring coefficients should be done on this denser sampling grid.
Finally, it is worth mentioning that while the results presented here have focused on the single-slice, circular fanbeam case, the concepts and, potentially, actual blurring coefficients can be applied in the case of helical or multi-slice scans as well. Since the coefficients span only a small range in β, the small longitudinal increment of the patient over that range during a helical scan, even for large pitches, is a small fraction of the detector row longitudinal size, which we are already neglecting in performing the deconvolution. Likewise, in a multislice or conebeam scan, be it circular or helical, the blurring coefficients could still be applied independently to each row of the scanner since the small longitudinal offset of the various rows does not greatly affect the transverse effects being considered in this paper. Naturally, the longitudinal view of the focal spot is affected by the longitudinal offsets of the various rows, and this results in different rows experiencing different fluxes and spectral distributions of X-rays due to the heel effect, most prominently. But the peripheral channels of any row still see an effectively larger focal spot than do the central channels, and this effect could potentially be modeled and corrected for by the methods presented here.
Figure 13.
(a) Uncorrected reconstruction. (b) Image after sinogram-domain correction for anode angle effects. (c) The difference between the two images.
Acknowledgments
This work was supported in part by the Schweppe Foundation and NIg grant R01 CA134680.
APPENDIX A
In applying the penalized likelihood sinogram restoration strategy, we assume the measurements yi, i = 1, . . . , NY, are related to the “ideal,” monochromatic line integrals , i = 1, . . . , NY, by
| (7) |
where fj(l) is a beam-hardening induced line integral remapping function [4].
Expressing the set of unknown attenuation line integrals as a vector l(mono), with elements , i=1, . . . ,NY, and the set of measurements as a vector y, with elements yi, i=1, . . . ,NY, we then seek to find an estimate l̂(mono), subject to positivity constraints, that maximizes
| (8) |
where ℒ (l;y) is the usual Poisson likelihood function
| (9) |
The roughness penalty R(l) can be expressed very generally in the form
| (10) |
given by Fessler [8], where T is a matrix and ψk a potential function that assigns a cost to the K combinations of attenuation line integral values represented by the matrix product Tl. The smoothing or regularization parameter β in Eqn. 8 determines the relative influence of the likelihood and smoothness terms. In this work, we employ a quadratic penalty ψk(t) = ωkt2/2 applied to the simple difference of a sinogram sample with its horizontal and vertical neighbors, with ωk = 1/2 for those neighbors.
The iterative update for maximizing this objective function is given in Ref. [4].
Footnotes
The average would be a weighted average if the source intensity was not uniform across the focal spot or if the detector sensitivity was not uniform across the active area of the detector.
References
- 1.Bushberg JT, Seibert JA, Leidholt EM, Jr, Boone JM. The Essential Physics of Medical Imaging. Philadelphia: Lippincott Williams and Wilkins; 2002. [Google Scholar]
- 2.Hsieh J. Computed Tomography: Principles, Design, Artifacts, and Recent Advances. Bellingham: SPIE Press; 2003. [Google Scholar]
- 3.Crawford CR, King KF. Computed tomography scanning with simultaneous patient translation. Med. Phys. 1990;vol. 17:967–982. doi: 10.1118/1.596464. [DOI] [PubMed] [Google Scholar]
- 4.La Rivière PJ, Bian J, Vargas P. Penalized-likelihood sinogram restoration for computed tomography. IEEE Trans. Med. Imag. 2006;vol. 25:1022–1036. doi: 10.1109/tmi.2006.875429. [DOI] [PubMed] [Google Scholar]
- 5.Glover GH, Pelc NJ. Nonlinear partial volume artifacts in x-ray computed tomography. Med. Phys. 1980;vol. 7:238–248. doi: 10.1118/1.594678. [DOI] [PubMed] [Google Scholar]
- 6.Kak AC, Slaney M. Principles of Computerized Tomography Imaging. New York: IEEE Press; 1988. [Google Scholar]
- 7.Pan X. Optimal noise control in and fast reconstruction of fan-beam computed tomography image. Med. Phys. 1999;vol. 26:689–697. doi: 10.1118/1.598574. [DOI] [PubMed] [Google Scholar]
- 8.Fessler JA. Statistical image reconstruction methods for transmission tomography. In: Fitzpatrick JM, Sonka M, editors. Handbook of Medical Imaging. Vol. 2. Bellingham, WA: SPIE Press; 2000. pp. 1–70. [Google Scholar]


