

Abstract
Genome-wide experiments often measure quantitative differences between treated and untreated cells to identify affected strains. For these studies, statistical models are typically used to determine significance cutoffs. We developed a method termed “CLIK” (Cutoff Linked to Interaction Knowledge) that overlays biological knowledge from the interactome on screen results to derive a cutoff. The method takes advantage of the fact that groups of functionally related interacting genes often respond similarly to experimental conditions and, thus, cluster in a ranked list of screen results. We applied CLIK analysis to five screens of the yeast gene disruption library and found that it defined a significance cutoff that differed from traditional statistics. Importantly, verification experiments revealed that the CLIK cutoff correlated with the position in the rank order where the rate of true positives drops off significantly. In addition, the gene sets defined by CLIK analysis often provide further biological perspectives. For example, applying CLIK analysis retrospectively to a screen for cisplatin sensitivity allowed us to identify the importance of the Hrq1 helicase in DNA crosslink repair. Furthermore, we demonstrate the utility of CLIK to determine optimal treatment conditions by analyzing genome-wide screens at multiple rapamycin concentrations. We show that CLIK is an extremely useful tool for evaluating screen quality, determining screen cutoffs, and comparing results between screens. Furthermore, because CLIK uses previously annotated interaction data to determine biologically informed cutoffs, it provides additional insights into screen results, which supplement traditional statistical approaches.
Keywords: bioinformatics, false discovery rate
Advances in high-throughput biological techniques have resulted in a wealth of data on diverse cellular processes (1). These analyses are often performed using strain libraries, whose members differ by discrete changes in gene expression (e.g., via gene disruption or RNAi). Strains are exposed to a screen condition, a response is quantified for each member of the library, and the population is ranked by that metric. Affected members can then be compared with previously published data, to provide broader biological context. However, this prior knowledge is not typically used to determine the affected set. Instead, statistical models are used to assign probability values (P values) to population members, and then a significance threshold is applied. Unfortunately, there are limitations to statistical models. For example, because of the large population size of high-throughput experiments, simple analysis using a P value cutoff often produces an unacceptable number of false positives (2). Familywise error adjustments, such as Bonferroni corrected P values, minimize the type I errors (false positives) but result in an increase in type II errors (false negatives) (3). In an effort to strike a balance between type I and type II errors, Benjamini and Hochberg developed a method known as false discovery rate (FDR) (4). The FDR methodology, later improved upon by Storey (5), aims to increase statistical power at the cost of increasing the rate of type I errors. However, these statistically based methods do not take into account the biological interactions among the affected members of a screen and, thus, ignore an important aspect of screen results.
In contrast to using population-driven statistics, other screen analysis approaches may be used that take into account previously determined biological relationships. For example, gene-set enrichment analysis (GSEA) is a method wherein rank-ordered results from a high-throughput experiment are queried for the enrichment of known sets of functionally or physically related genes, thus providing some biological context to the affected population of the screen (6). However, GSEA does not define a cutoff in the population and is limited in that gene sets for comparison need to be predefined (7). Thus, biases may develop in GSEA if a particular cellular process is over- or under-represented in the gene sets.
More recently, new algorithms have been developed that combine systems biology data with statistical models to improve the scoring of high-throughput screen results (e.g., refs. 8 and 9). These methods use preexisting knowledge to help inform the ranking of affected queries in high-throughput screens (10, 11). However, these methods still require the user to determine a significance cutoff. This decision presents a problem because, a priori, it is difficult to determine a cutoff that will maximize discriminatory power (selectivity) while maintaining sensitivity.
Here, we present a method, termed CLIK (Cutoff Linked to Interaction Knowledge), which overcomes the issues described above by using the knowledge implicit in biological databases to define a cutoff. CLIK takes advantage of two properties of genome-wide screens: first, successful high-throughput screens organize functionally related genes into clusters by virtue of similar response scores (12–14); and second, the frequency of genetic and physical interactions among these clusters is higher than that of unrelated genes (15). We used CLIK to analyze five screens performed with the haploid budding yeast gene-disruption library. For these screens, we observe an increased density of known interactions among members of the affected population and find that the magnitude of the interaction density reflects validation rate. Furthermore, because CLIK cutoffs are automatically determined using previously defined biological data, we find that it is more robust than choosing an arbitrary statistical cutoff. The gene sets defined by CLIK often extend beyond the sets determined by standard statistical cutoffs without substantially increasing the number of false positives. Finally, we show that the additional genes defined by CLIK analysis often lead to unique biological insights.
Results
Interaction Density Among Affected Mutants Is Higher than Random.
A successful genome-wide screen typically organizes a small percentage of related genes high in the rank order. The rate of genetic and physical interactions among related genes is high (12–15), so interactions among genes at the top of the rank order are correspondingly high. Conversely, strains showing no response to treatment are dispersed randomly elsewhere in the rank order and, correspondingly, there is lower interaction density in this region of the rank order. We hypothesized that this differential interaction density between affected and unaffected members of the population could be visualized and used to define a screen cutoff. To define this cutoff, we developed CLIK, in which known interaction data are overlaid on top of the results from a screen to generate a scatterplot. The rank-order list of genes is used as both the x and y axes of a graph and a point is plotted for each known interaction between ORFs on the axes such that the query gene rank provides the x coordinate, and the target gene rank provides the y coordinate (Fig. 1A). For the purposes of this paper, all Saccharomyces cerevisiae interactions within the BioGRID database were considered when generating CLIK graphs (11).
Fig. 1.

CLIK graph creation. (A) Scatter plot of interaction data from the top1-T722A mutant screen generated using interaction data from the BioGRID database. The rank-ordered list of genes from a genome-wide screen is used to generate a scatterplot of interaction data, as described in the text. Only the first 600 ranks are shown on each axis. (B) Plot of the same screen data as in A but using a randomized rank order. (C) Same plot as in A with color scale (Inset) applied to indicate plot density. Plot point densities below the significance threshold are colored gray (for details, see SI Materials and Methods). (D) Complete CLIK graph of interaction data using the top1-T722A screen rank order. Color scale is the same as in C.
We applied this method to a high-throughput screen for mutants sensitive to DNA damage induced by overexpression of a mutant allele of TOP1 (top1-T722A) (16). The affected set from the screen is enriched for genes involved in the DNA-damage response, and the numerous interactions among these genes produces a dense plot near the top of the rank order (Fig. 1A). A control plot in which the ∼4,800 strains from the original screen are randomly ordered shows many fewer interactions in the same region (Fig. 1B).
To more clearly represent the differential densities on a graph, the CLIK algorithm quantifies the local densities of every plot point and colors them according to their relative magnitude. All density values significantly above the background signal are colored according to their relative values, and all other points are colored gray (Fig. 1C and SI Materials and Methods). As seen in the CLIK graph for the top1-T722A screen, contiguous significant (i.e., colored) points form distinct areas that we term “CLIK groups” (Fig. 1C). In this graph, the largest CLIK group (lower-left corner) identifies the sensitive mutants in the screen. Interestingly, in addition to sensitive mutants, CLIK groups representing suppressors are observed at the upper-right corner of the graph when the entire rank order is plotted (Fig. 1D). Hereafter, we focus our analyses on the sensitive mutants.
Interaction Density Effectively Defines Screen Cutoff.
The utility of the CLIK method to define screen cutoffs was evaluated by analyzing the top1-T722A screen, along with three previously unreported genome-wide screens of the haploid yeast gene-disruption library. These include a screen with the target of rapamycin (TOR) inhibitor, rapamycin, and two synthetic dosage-lethality (SDL) screens overexpressing the spindle pole body gene, SPC110, or the meiosis-specific recombination gene, DMC1. We also analyzed a previously published screen for mutants sensitive to the DNA cross-linking agent cisplatin (17). The ratio of strain growth on control vs. experimental conditions was used to define the rank order for each screen.
In four of the five screens, well-defined CLIK groups are present at the top of the rank order, with the exception being the DMC1 SDL screen (Fig. 2 A–D and Fig. S1). These CLIK groups each contain a “core” of genes that highly interact among themselves, extending from the origin to the point on the diagonal where interaction density drops below the level of significance (red boxes in Fig. 2A). The core is often connected to “tails” that extend along the axes (Fig. 2). This tailing-interaction density represents sections of the rank order in which strains do not highly interact with their neighbors but do interact strongly with members at the top of the ranked list. We, therefore, use the distal edge of the core along the diagonal to define the CLIK group cutoff.
Fig. 2.

CLIK graphs of four genome-wide screens. Plot density scale is the same as in Fig. 1. Only the first ∼900 rank positions are shown. Red dashed boxes indicate the CLIK-derived cutoffs. Insets show ROC curves derived from validation data for each screen. The trend line of each ROC graph is colored according to the density from the CLIK graph along the diagonal. Arrows indicate the position of the Youden index for each ROC curve. (A) top1-T722A–sensitivity screen. (B) Cisplatin-sensitivity screen. (C) Rapamycin-sensitivity screen. (D) SPC110 SDL screen.
For the four screens with well-defined CLIK groups, the cutoffs define affected sets that vary in size from 114 to 309 genes and whose mean interaction densities range from 0.045 to 0.072. These mean density values are all more than sevenfold greater than the control values that were generated in the corresponding random sets (Dataset S1-1). To evaluate these cutoffs, we retested 16 replicates of each individual strain within the CLIK-defined set plus the next 100 strains in the rank order (Dataset S2). The validation rate of each CLIK group varied widely among the different screens, with the top1-T722A screen showing the highest validation and the SPC110 SDL screen showing the lowest (Table 1). The results were used to generate receiver operating characteristic (ROC) curves (Fig. 2, Insets), which show the tradeoff between the rate of true positives (sensitivity) and the rate of false positives (specificity) at any point within the validated set. The better an individual screen is at separating true positives from false positives, the larger the resulting area under the ROC curve. The point along the curve where the perpendicular distance from the diagonal is greatest is referred to as the Youden index, which some view as the optimal cutoff because it balances sensitivity and specificity (18). Strikingly, we find that the CLIK-derived cutoffs lie near the Youden index in the ROC curves for the top1-T722A screen, the SPC110-overexpression screen, and the cisplatin-sensitivity screen (Fig. S2 A–E).
Table 1.
Total set size based on CLIK analysis and 5% FDR analysis
| Screen | CLIK group |
5% FDR |
||
| No.* | Validated, % | No.* | Validated, % | |
| top1-T722A | 242 | 81.8 | 172 | 86.6 |
| Cisplatin | 155 | 63.6 | 26 | 96 |
| 4 nM rapamycin | 309 | 80.9 | 142 | 92.1 |
| SPC110 overexpression | 114 | 42.1 | 99 | 44.4 |
| DMC1 overexpression | 82 | 12.3 | 35 | 17 |
No. indicates set size for each screen. Percentage of validation is also shown.
We next compared CLIK-derived cutoffs to FDR, the current standard statistical method for determining screen cutoffs. CLIK-defined cutoffs correspond to widely different FDRs for each screen (Table 1 and Fig. S2F). In the top1-T722A screen, the CLIK-derived cutoff implicates the top 242 strains, corresponding to an FDR of 24.5%. Interestingly, this cutoff extends 70 positions beyond a more traditional 5% FDR cutoff, while maintaining a similar validation rate: 87% for 5% FDR vs. 82% for CLIK (Table 1 and Fig. S2F). Importantly, after the CLIK-derived cutoff, the validation rate of the next 100 genes drops to only 36% (Dataset S2-1). In the rapamycin screen, the CLIK group defines 309 sensitive mutants, more than twice as many as a 5% FDR cutoff, without significantly compromising validation rate. Here, once again, we find that the validation rate after the CLIK cutoff drops (Dataset S2-3). Furthermore, the predicted FDR corresponding to the CLIK cutoff for rapamycin is arbitrarily high (Fig. S2F), making this an unlikely choice without the insight from CLIK. Likewise, the 5% FDR cutoff in the cisplatin screen corresponds to the top 26 affected ORFs vs. 155 ORFs for the CLIK-derived cutoff (corresponding FDR cutoff not available). Again the CLIK-derived cutoff is informative in defining the affected population members, because it identifies a sixfold larger gene set than that identified by the FDR method, with only a modest corresponding reduction in percentage of validation (Table 1). Furthermore, the validation rate of the next 100 genes past the CLIK cutoff falls to 10% (Dataset S2-2). Interestingly, even for screens with relatively low validations rates, such as the SPC110 screen (42%), we find that the CLIK cutoff corresponds to the Youden index and only 18% of the next 100 genes validate (Dataset S2-4).
Intriguingly, we find that top1-T722A has the strongest CLIK group, as shown by the coloring of interaction density in the plot, and, correspondingly, has the highest validation rate (Fig. 2 and Table 1). Conversely, the SDL screen performed by overexpressing the meiosis recombination gene, DMC1, results in only a small, weak CLIK group, the mean interaction density of which is the same as the minimum value on the color scale (Fig. S1 and Dataset S1-1). The lack of strong interaction density among the sensitive mutants predicts a low rate of validation. Indeed, only 12% of the ORFs within the CLIK group validate (Dataset S2-5). Importantly, in this screen, neither the 5% FDR cutoff (35 ORFs; validation rate: 17%) nor the P value cutoff (106 ORFs; validation rate: 9%) anticipate this low rate of validation, which CLIK analysis correctly predicted. The lack of true positives identified in the DMC1 screen is not surprising given that its gene product mainly functions during meiosis and our screens are performed in mitotically dividing cells.
Taken together, these results show that CLIK analysis effectively identifies functional organization (i.e., related genes) in screen results by overlaying previously defined biological relationships. CLIK defines cutoffs by identifying a point in a rank where screen organization, and, thus, true positives, begins to dissipate. This point is often different from that determined using statistical models, which rely on the underlying population distribution and require the user to define a cutoff.
CLIK Analysis Captures Additional Biologically Relevant Genes.
To demonstrate the utility of CLIK analysis to uncover unique biological insights, we looked more closely at the gene set identified in the analysis for cisplatin sensitivity. CLIK identified a 155 member gene set vs. 26 identified in the original study, and 66 of the additional genes validated (Fig. 2C) (17). Many of them fall into repair pathways that are enriched in the 26-member set. Moreover, additional gene-ontology (GO) categories are enriched in the larger CLIK-defined set, including sister chromatid cohesion, replication fork stability, and chromatin remodeling (Dataset S1-2).
Next, we focused on the hrq1 strain, which shows weak cisplatin sensitivity, falls within the CLIK group, but is outside of the FDR cutoff. Hrq1 belongs to the family of RecQ helicases orthologous to human RECQ4 (19). The repair pathways that respond to cisplatin-induced lesions include translesion synthesis (TLS), replication fork regression (FR) [collectively called postreplication repair (PRR)], and homologous recombination (HR) (reviewed in ref. 20). Nucleotide excision repair (NER) also plays a role in cisplatin resistance, particularly in G1 cells (21). To investigate its role in cisplatin resistance, we combined hrq1 with mutations in the TLS (pol32, rev1, rev3), FR (rad5), HR (rad51, sgs1), and NER (rad14, rad10) pathways.
A mutant rev1 strain shows an approximate 100-fold growth reduction at 83 µM cisplatin compared with wild type (Fig. 3A). Interestingly, the double hrq1 rev1 mutant shows a strong synergistic growth reduction on 83 µM cisplatin (>1,000-fold), well below the concentration of cisplatin necessary to see sensitivity in an hrq1 single mutant (125 µM). A similar synergistic effect was observed between hrq1 and other mutants in the PRR pathways, including rev3, rad5, and pol32 (Fig. S3), indicating a dramatic effect on a pathway parallel to PRR. In contrast, an hrq1 rad51 mutant strain showed the same sensitivity as a rad51 single mutant. A similar epistatic effect was also observed between hrq1 and rad14 (Fig. 3) and between rad10 and sgs1 (Fig. S3).
Fig. 3.
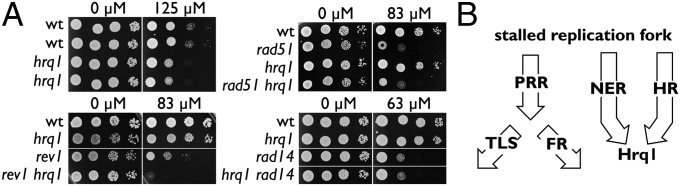
Pathways affecting cisplatin sensitivity and the role of Hrq1. (A) The hrq1-null mutant was crossed to rev1, rad14, and rad51 mutant strains to generate single- and double-mutant combinations as indicated. wt, wild type. Cultures were serially diluted and spotted onto plates with and without cisplatin. (B) Arrows indicate major repair pathways that respond to crosslinks after replication fork stalling, including PRR, TLS, FR, NER, and HR. The epistasis data predict that Hrq1 acts at a point of convergence of the NER and HR pathways.
The synergistic effect between hrq1 and PRR, and epistasis to both the NER and HR pathways, suggests a model in which Hrq1 functions after a convergence of HR and NER. On the other hand, HR and NER are genetically separable pathways for cisplatin resistance (22). Thus, Hrq1 may only function in the processing of specific cisplatin-induced lesions that require the function of both NER and HR [e.g., interstrand crosslinks (23)].
CLIK Analysis Can Be Used to Compare Experimental Treatments.
Rapamycin, an antiproliferative drug targeting the highly conserved mammalian TOR pathway (24, 25), has been used to screen the yeast gene-disruption library multiple times (26–33). Although each screen has identified a set of rapamycin-resistance genes, there is poor overlap in the results, possibly attributable to variation in the drug concentrations used. To test for concentration-based variability, we conducted rapamycin drug screens at 4, 10, and 16 nM. Because CLIK enables a visualization of the functional grouping of related genes in a screen, we expected that the CLIK graphs would help interpret any differences in screen organization.
The 4 nM rapamycin treatment does not significantly reduce the growth rate of most strains in the gene-disruption library. Because this growth rate is similar to the no-drug control, variation within this screen is small and the plot of growth ratios appears flat (Fig. 4A). As a result, the transition between affected and unaffected strains is obvious. In contrast, 16 nM rapamycin inhibits the growth of most strains; thus, small experimental variations lead to comparatively large variations in growth ratio, and the plot is sloped over most of the distribution (Fig. 4A). The 10 nM screen was intermediate; growth was somewhat reduced and variation between strains was moderate (Fig. 4A and Dataset S2).
Fig. 4.

The effect of increasing rapamycin concentration on screen results. (A) Rank-order plots of strains from the yeast gene-disruption library sorted by log growth ratio (LGR) for three rapamycin concentrations. The most sensitive strains are on the left in each graph. Dashed horizontal lines indicate population mean and solid horizontal lines indicate 2 SDs above and below the mean. Vertical dashed blue lines indicate the cutoff defined by CLIK analysis. Blue shading indicates the section of the growth curve included in the CLIK graphs below. (B) CLIK graphs for three rapamycin concentrations. All graph interaction densities are color scaled to be the same as the 4 nM rapamycin results (Inset). q and p with black and gray vertical arrows indicate the 5% FDR cutoff and the 0.05 P value cutoff for each graph, respectively. There are no q values <10% for the 16 nM screen.
Comparing the CLIK groups for the three drug concentrations (Fig. 4B), we found a set of 309 genes with an average of 13.3 interactions per ORF for the 4 nM screen, a set of 166 genes with 8.8 interactions per ORF for the 10 nM screen, and a set of 160 genes with 6.9 interactions per ORF for the 16 nM screen. These network differences are attributable to changes in interaction frequency between genes at the top of each rank order. Interestingly we find that the mutants identified in all three screens validate at similar levels: 81%, 75%, and 80% for 4, 10, and 16 nM, respectively (Dataset S2). These results confirm that, for rapamycin, CLIK analysis successfully determines cutoffs of similar specificity, despite the large differences in variance among the screens (Fig. 4A).
Strikingly, we find that only 46 mutants are commonly identified in all three rapamycin screens (Fig. S4A), including mutants in TOR1 complex members tor1 and tco89. Interestingly, the 10 nM screen overlaps the 4 and 16 nM screens more than the 4 and 16 nM screens overlap with each other (Fig. S4A). These results argue that the differing concentrations affect fundamentally different pathways. To analyze this hypothesis further, we performed GO category-enrichment analysis on the 4 and 16 nM gene sets, which are the most dissimilar (Fig. S4B and Dataset S1). From these analyses, it is apparent that although the different concentrations affect many common genes, they also affect distinct processes. A particularly striking example is found among mutants in the Rim101-processing pathway. Thirteen of 18 genes involved in this pathway are sensitive to 4 nM rapamycin but show wild-type sensitivity at 16 nM (34, 35). This differential sensitivity was confirmed by separate dilution assays (Fig. 5A). These genes are ranked within the CLIK group in the 4 nM screen but are dispersed in the rank order at higher doses (Fig. 5B). Because 16 nM rapamycin is more cytostatic than 4 nM rapamycin, the growth reduction in the Rim101-disruption strains at the higher dosages was indistinguishable from that of wild-type strains. Strikingly, CLIK analysis revealed this result, whereas the RIM101 genes would not be considered hits even with a more lenient FDR threshold (Fig. 4 and Fig. S2F).
Fig. 5.

Concentration-specific rapamycin sensitivities of mutant strains. (A) Sixteen replicates of each indicated strain were 10-fold serially diluted and spotted onto plates with the indicated concentrations of rapamycin; wt indicates wild type. (B) Line plots indicating the rank-order positions of the RIM101 pathway mutants in the 4, 10, and 16 nM rapamycin screens. Horizontal lines represent the rank order from 1 to ∼4,800 (left to right) from each screen. Solid vertical lines indicate the rank positions of dfg16, rim8, rim9, rim13, rim20, rim21, rim101, and ygr122w. Vertical dashed lines indicate the CLIK-defined cutoff for each screen. (C) Line plots constructed as in B showing the positions of dynein–dynactin mutants dyn1, dyn3, nap1, ndl1, nip100, and pac1.
We also identified several genes involved in dynein metabolism, the disruptions of which show an inverse relationship to rapamycin drug concentration compared with the RIM101 genes. Mutations in DYN1, DYN3, NAP1, NIP100, NDL1, and PAC1 are more sensitive at 16 nM and less sensitive at 4 nM. These genes cluster at the top of the rankings at 16 nM but are dispersed into the ranked lists at 10 and 4 nM (Fig. 5C). This relationship was confirmed by validation experiments and a separate dilution assay for dyn1∆ (Fig. 5A and Dataset S2-11).
In summary, the three rapamycin concentrations affect the population of mutants differently. CLIK accurately identifies affected members of each population and also reveals differences between the screens that were confirmed by validation. Interestingly, the genes identified reflect the different underlying biological effects at 4, 10, and 16 nM rapamycin. Importantly, CLIK analysis helped us to readily identify many of these biological insights.
Discussion
CLIK analysis leverages the fact that the rate of interactions among true positives in a screen is higher than for a random set of genes. CLIK uses this differential-interaction density to automatically identify biologically informed cutoffs. This method contrasts with statistical methods, which require a user-defined confidence threshold (e.g., 5% FDR or 10% FDR, etc.). In four separate genome-wide screens, CLIK cutoffs successfully increased screen sensitivity, while maintaining reasonable specificity. These cutoffs corresponded to widely different FDR cutoffs, highlighting the difficulty of applying a uniform statistical metric to assess diverse screen results. In three of those screens, few true positives are identified after the CLIK cutoff. The exception is the 4 nM rapamycin screen, which shows a relatively high verification rate beyond the CLIK cutoff (69%; Dataset S2-3). This screen is unique in that the interaction density of the tails is similar to the interaction density of the core group (Fig. 2C). We, therefore, recommend that tail interaction density not be ignored in all cases.
We additionally show that the interaction density within a CLIK group reflects the validation rate of the ORFs within it. The top1-T722A CLIK group contained the highest mean interaction density, and, correspondingly, the ORFs within it validate at the highest rate (Table 1 and Dataset S1-1). Conversely, the lack of a strong CLIK group in the DMC1 screen successfully predicted an extremely low validation rate. In contrast, a 5% FDR cutoff implicated the top 35 genes, which only showed a 17% validation rate. Thus, CLIK is a useful tool for evaluating screen efficacy.
CLIK Analysis Defines a Role for Hrq1 in Crosslink Repair.
CLIK analysis of the cisplatin sensitivity data from Lee et al. demonstrates how interaction density supplements traditional statistical analyses (17). It is clear that the 5% FDR cutoff used by the authors appropriately maintains specificity in the dataset (i.e., most genes in the set are true positives). However, the CLIK group contains 66 additional true positives (Dataset S2-2), and the cost to verify these additional cisplatin resistance genes is offset by the benefit of additional biological insight. For example, the hrq1 mutant at position 98 in the rank order is 72 positions beyond the FDR cutoff but within the CLIK cutoff of 155. This mutant is weakly sensitive to cisplatin, but when combined with mutants in PRR, its role in resistance is clear (Fig. 3 and Fig. S3). Furthermore, epistasis analysis shows that NER and HR, which have previously been defined as separate pathways affecting cisplatin sensitivity (22), work in concert with Hrq1 (Fig. 3 and Fig. S3). This relationship suggests either that Hrq1 has independent functions downstream of each of these pathways or that the NER and HR pathways operate together when Hrq1 function is required. We favor the latter because interstrand crosslinks (ICLs) make up less than 5% of cisplatin lesions (36). If Hrq1 has a specific role in processing ICLs, then both HR and NER mechanisms would converge on Hrq1 for repair. In the absence of Hrq1, such lesions may be routed through the PRR pathways. Further support for this view comes from the fact that hrq1 mutants are highly sensitive to drugs that produce more ICLs than cisplatin [mechlorethamine and mitomycin C (17)].
We suggest that a helicase such as Hrq1 functions to denature the dsDNA near an ICL after incision of the strands and helps initiate strand invasion to allow completion of repair. Similar to our findings in S. cerevisiae, in Schizosaccharomyces pombe, hrq1 mutations are epistatic to NER and synergistic to PRR with respect to cisplatin (37). However, our model differs from the S. pombe one, which has HR acting downstream of PRR. In addition, hrq1 and the S. pombe SGS1 ortholog, rqh1, show synthetic lethality, suggesting that these genes function in redundant pathways. In budding yeast, hrq1 and sgs1 mutants are epistatic for cisplatin sensitivity (Fig. 3), further demonstrating pathway divergence for Hrq1 function between the two yeasts.
CLIK Analysis Reveals Different Functional Responses to Rapamycin.
The first rapamycin studies in yeast used concentrations too high (100 nM and higher) to distinguish moderately sensitive mutants strains from wild-type strains (32). Consequently, Parsons et al. (26) used 11 and 16 nM, Xie et al. (33) used 10 and 30 nM, and Hillenmeyer et al. (27) used 5 and 6 nM rapamycin in their screens. These studies reported 246, 281, and 2,036 rapamycin-sensitive strains, respectively, with only 54 deletions commonly identified in all three screens. To determine whether these concentrations led to different biological responses or whether rapamycin screens are intrinsically “noisy,” we carried out fully controlled parallel genomic screens to compare different dose responses.
We conducted three screens using 4, 10, and 16 nM rapamycin and showed that the 4 nM rapamycin screen generated the strongest and largest CLIK group (Fig. 4B). This result indicates that the low dosage screen is most effective in organizing related strains. However, we also observed that a different set of strains is sensitive to each drug concentration and validate most effectively when retested with the same drug concentration (Figs. S4 and S5). We conclude that there are two effects governing the efficacy of these screens. First, the signal-to-noise ratio may be too low to identify mildly affected strains at a high drug concentration. For example, the growth ratio of the 16 nM dose has the largest SD (1.6), and, correspondingly, at this high concentration, there are fewer true positives (Fig. 4A and Dataset S2-7). Second, different rapamycin doses have different biological effects (Fig. S4B). For instance, we show that disruption of the pH-sensing RIM101 pathway only shows sensitivity to 4 nM rapamycin. In contrast, mutations in the dynein–dynactin complex only show sensitivity at higher concentrations. The dynein–dynactin pathway functions in mitotic spindle orientation in a process that is parallel to, and functionally redundant with, the Kar9 pathway (38). Because the Kar9 pathway is dependent on actin polarization, which is controlled by the TOR complex, our results suggest that actin cytoskeleton polarization is only affected at high rapamycin concentrations.
It is not known whether these concentration-dependent differences in drug sensitivity are a common property of drug toxicity or whether rapamycin represents a special case because of its broad range of effects. In any case, our results indicate that for more complete genetic insight, it may be necessary to conduct drug screens at multiple concentrations. Importantly, this conclusion would not have been revealed by standard statistical analyses. For example, at 4 nM, the FDR cutoff was too stringent to include many of the RIM101-processing genes (Fig. 4B and Dataset S2-3). Furthermore, an FDR cutoff of 10% did not select any genes as significantly affected at 16 nM rapamycin.
CLIK Group Network Analysis.
The interactions between the ORFs within a CLIK group define biological subnetworks that are tied to the particular screen. By definition, most of the genes within the CLIK group are connected to the network. The unconnected orphans may simply represent noise within the screen or, more interestingly, may represent genes with connections to the defined network that have yet to be discovered. Indeed, in three of four screens analyzed, the orphan genes validate at a rate similar to the connected ORFs (Fig. S5). Although CLIK networks lend themselves to scrutiny by other metrics, such analyses are beyond the scope of this study. For instance, graph theory metrics (e.g., mean clustering coefficient, mean degree, comparison with random graphs, etc.) have proven useful in other biological applications and may provide added value to CLIK analysis (39).
Network Coverage Required for CLIK.
In this work, CLIK analysis was performed using all data within the BioGRID database. CLIK also performs well when other interaction databases are used (Fig. S6B). In addition, although we only applied CLIK to genome-wide screen data from S. cerevisiae, we believe it will soon be applicable to other organisms. Currently, the number of nonredundant interactions annotated in BioGRID is over 33 interactions per gene for S. cerevisiae. Given this large number, the database is likely more than comprehensive enough to avoid biases toward well-studied processes. To estimate the minimal number of interactions sufficient to produce an informative CLIK graph, we performed a retrospective analysis using archived versions of the BioGRID database (Fig. S6A). This analysis shows that an average of ∼seven interactions per gene is necessary to produce a stable CLIK graph and accurately define a screen cutoff in budding yeast. Interaction networks in BioGRID for S. pombe, Drosophila melanogaster, and Homo sapiens are rapidly approaching this level of saturation. Thus, we suspect that genome-wide screens in these systems will soon benefit from CLIK analysis as their interaction networks grow.
In summary, CLIK is a valuable tool for assessing high-throughput screen results. Because this method uses previously annotated interaction data, it supplements traditional statistical approaches. It provides a reliable cutoff determination and estimate of screen quality and also facilitates the comparison of results between screens. Finally, we show from the cisplatin and rapamycin screens that additional biological insights are gained through CLIK analysis.
Materials and Methods
Methods related to yeast strains and screens, and drug-sensitivity assays are described in SI Materials and Methods. This section also describes how the CLIK algorithm determines significant density values (Fig. S7). CLIK Software is available for download (GNU General Public License) at www.rothsteinlab.com. A web-based CLIK application is also available at that site.
Supplementary Material
Acknowledgments
We thank Michael Chang, Marie-Claude Kergoat, Erika Shor, Peter Thorpe, Sake van Wageningen, Scott Keeney, Elizabeth Miller, and Dana Pe’er for critically reading the manuscript. This work was supported by National Institutes of Health Grant GM050237 (to R.R.) and SWOG Grant CU12-0734 SC1 (to R.R.).
Footnotes
The authors declare no conflict of interest.
This article is a PNAS Direct Submission.
This article contains supporting information online at www.pnas.org/lookup/suppl/doi:10.1073/pnas.1219582110/-/DCSupplemental.
References
- 1.Snyder M, Gallagher JEG. Systems biology from a yeast omics perspective. FEBS Lett. 2009;583(24):3895–3899. doi: 10.1016/j.febslet.2009.11.011. [DOI] [PMC free article] [PubMed] [Google Scholar]
- 2.Shaffer JP. Multiple hypothesis-testing. Annu Rev Psychol. 1995;46(1):561–584. [Google Scholar]
- 3.Perneger TV. What’s wrong with Bonferroni adjustments. BMJ. 1998;316(7139):1236–1238. doi: 10.1136/bmj.316.7139.1236. [DOI] [PMC free article] [PubMed] [Google Scholar]
- 4.Benjamini Y, Hochberg Y. Controlling the false discovery rate - a practical and powerful approach to multiple testing. J R Stat Soc Series B Stat Methodol. 1995;57(1):289–300. [Google Scholar]
- 5.Storey JD. A direct approach to false discovery rates. J R Stat Soc Series B Stat Methodol. 2002;64(3):479–498. [Google Scholar]
- 6.Mootha VK, et al. PGC-1alpha-responsive genes involved in oxidative phosphorylation are coordinately downregulated in human diabetes. Nat Genet. 2003;34(3):267–273. doi: 10.1038/ng1180. [DOI] [PubMed] [Google Scholar]
- 7.Subramanian A, et al. Gene set enrichment analysis: A knowledge-based approach for interpreting genome-wide expression profiles. Proc Natl Acad Sci USA. 2005;102(43):15545–15550. doi: 10.1073/pnas.0506580102. [DOI] [PMC free article] [PubMed] [Google Scholar]
- 8.Ma X, Lee H, Wang L, Sun F. CGI: A new approach for prioritizing genes by combining gene expression and protein-protein interaction data. Bioinformatics. 2007;23(2):215–221. doi: 10.1093/bioinformatics/btl569. [DOI] [PubMed] [Google Scholar]
- 9.Wang C, et al. Knowledge-guided gene ranking by coordinative component analysis. BMC Bioinformatics. 2010;11:162. doi: 10.1186/1471-2105-11-162. [DOI] [PMC free article] [PubMed] [Google Scholar]
- 10.Ashburner M, et al. The Gene Ontology Consortium Gene ontology: Tool for the unification of biology. Nat Genet. 2000;25(1):25–29. doi: 10.1038/75556. [DOI] [PMC free article] [PubMed] [Google Scholar]
- 11.Stark C, et al. The BioGRID Interaction Database: 2011 update. Nucleic Acids Res. 2011;39(Database issue):D698–D704. doi: 10.1093/nar/gkq1116. [DOI] [PMC free article] [PubMed] [Google Scholar]
- 12.Eisen MB, Spellman PT, Brown PO, Botstein D. Cluster analysis and display of genome-wide expression patterns. Proc Natl Acad Sci USA. 1998;95(25):14863–14868. doi: 10.1073/pnas.95.25.14863. [DOI] [PMC free article] [PubMed] [Google Scholar]
- 13.Costanzo M, et al. The genetic landscape of a cell. Science. 2010;327(5964):425–431. doi: 10.1126/science.1180823. [DOI] [PMC free article] [PubMed] [Google Scholar]
- 14.Bandyopadhyay S, et al. Rewiring of genetic networks in response to DNA damage. Science. 2010;330(6009):1385–1389. doi: 10.1126/science.1195618. [DOI] [PMC free article] [PubMed] [Google Scholar]
- 15.Boone C, Bussey H, Andrews BJ. Exploring genetic interactions and networks with yeast. Nat Rev Genet. 2007;8(6):437–449. doi: 10.1038/nrg2085. [DOI] [PubMed] [Google Scholar]
- 16.Reid RJ, et al. Selective ploidy ablation, a high-throughput plasmid transfer protocol, identifies new genes affecting topoisomerase I-induced DNA damage. Genome Res. 2011;21(3):477–486. doi: 10.1101/gr.109033.110. [DOI] [PMC free article] [PubMed] [Google Scholar]
- 17.Lee W, et al. Genome-wide requirements for resistance to functionally distinct DNA-damaging agents. PLoS Genet. 2005;1(2):e24. doi: 10.1371/journal.pgen.0010024. [DOI] [PMC free article] [PubMed] [Google Scholar]
- 18.Perkins NJ, Schisterman EF. The inconsistency of “optimal” cutpoints obtained using two criteria based on the receiver operating characteristic curve. Am J Epidemiol. 2006;163(7):670–675. doi: 10.1093/aje/kwj063. [DOI] [PMC free article] [PubMed] [Google Scholar]
- 19.Barea F, Tessaro S, Bonatto D. In silico analyses of a new group of fungal and plant RecQ4-homologous proteins. Comput Biol Chem. 2008;32(5):349–358. doi: 10.1016/j.compbiolchem.2008.07.005. [DOI] [PubMed] [Google Scholar]
- 20.Heyer WD, Ehmsen KT, Liu J. Regulation of homologous recombination in eukaryotes. Annu Rev Genet. 2010;44:113–139. doi: 10.1146/annurev-genet-051710-150955. [DOI] [PMC free article] [PubMed] [Google Scholar]
- 21.Ulrich HD. Regulating post-translational modifications of the eukaryotic replication clamp PCNA. DNA Repair (Amst) 2009;8(4):461–469. doi: 10.1016/j.dnarep.2009.01.006. [DOI] [PubMed] [Google Scholar]
- 22.Eshel D, et al. Cytoplasmic dynein is required for normal nuclear segregation in yeast. Proc Natl Acad Sci USA. 1993;90(23):11172–11176. doi: 10.1073/pnas.90.23.11172. [DOI] [PMC free article] [PubMed] [Google Scholar]
- 23.Vasquez KM. Targeting and processing of site-specific DNA interstrand crosslinks. Environ Mol Mutagen. 2010;51(6):527–539. doi: 10.1002/em.20557. [DOI] [PMC free article] [PubMed] [Google Scholar]
- 24.Jacinto E, Lorberg A. TOR regulation of AGC kinases in yeast and mammals. Biochem J. 2008;410(1):19–37. doi: 10.1042/BJ20071518. [DOI] [PubMed] [Google Scholar]
- 25.Dobashi Y, Watanabe Y, Miwa C, Suzuki S, Koyama S. Mammalian target of rapamycin: A central node of complex signaling cascades. Int J Clin Exp Pathol. 2011;4(5):476–495. [PMC free article] [PubMed] [Google Scholar]
- 26.Parsons AB, et al. Integration of chemical-genetic and genetic interaction data links bioactive compounds to cellular target pathways. Nat Biotechnol. 2004;22(1):62–69. doi: 10.1038/nbt919. [DOI] [PubMed] [Google Scholar]
- 27.Hillenmeyer ME, et al. The chemical genomic portrait of yeast: Uncovering a phenotype for all genes. Science. 2008;320(5874):362–365. doi: 10.1126/science.1150021. [DOI] [PMC free article] [PubMed] [Google Scholar]
- 28.Huang J, et al. Finding new components of the target of rapamycin (TOR) signaling network through chemical genetics and proteome chips. Proc Natl Acad Sci USA. 2004;101(47):16594–16599. doi: 10.1073/pnas.0407117101. [DOI] [PMC free article] [PubMed] [Google Scholar]
- 29.Zaragoza D, Ghavidel A, Heitman J, Schultz MC. Rapamycin induces the G0 program of transcriptional repression in yeast by interfering with the TOR signaling pathway. Mol Cell Biol. 1998;18(8):4463–4470. doi: 10.1128/mcb.18.8.4463. [DOI] [PMC free article] [PubMed] [Google Scholar]
- 30.Düvel K, Santhanam A, Garrett S, Schneper L, Broach JR. Multiple roles of Tap42 in mediating rapamycin-induced transcriptional changes in yeast. Mol Cell. 2003;11(6):1467–1478. doi: 10.1016/s1097-2765(03)00228-4. [DOI] [PubMed] [Google Scholar]
- 31.Lorenz MC, Heitman J. TOR mutations confer rapamycin resistance by preventing interaction with FKBP12-rapamycin. J Biol Chem. 1995;270(46):27531–27537. doi: 10.1074/jbc.270.46.27531. [DOI] [PubMed] [Google Scholar]
- 32.Cardenas ME, Cutler NS, Lorenz MC, Di Como CJ, Heitman J. The TOR signaling cascade regulates gene expression in response to nutrients. Genes Dev. 1999;13(24):3271–3279. doi: 10.1101/gad.13.24.3271. [DOI] [PMC free article] [PubMed] [Google Scholar]
- 33.Xie MW, et al. Insights into TOR function and rapamycin response: Chemical genomic profiling by using a high-density cell array method. Proc Natl Acad Sci USA. 2005;102(20):7215–7220. doi: 10.1073/pnas.0500297102. [DOI] [PMC free article] [PubMed] [Google Scholar]
- 34.Hayashi M, Fukuzawa T, Sorimachi H, Maeda T. Constitutive activation of the pH-responsive Rim101 pathway in yeast mutants defective in late steps of the MVB/ESCRT pathway. Mol Cell Biol. 2005;25(21):9478–9490. doi: 10.1128/MCB.25.21.9478-9490.2005. [DOI] [PMC free article] [PubMed] [Google Scholar]
- 35.Barwell KJ, Boysen JH, Xu W, Mitchell AP. Relationship of DFG16 to the Rim101p pH response pathway in Saccharomyces cerevisiae and Candida albicans. Eukaryot Cell. 2005;4(5):890–899. doi: 10.1128/EC.4.5.890-899.2005. [DOI] [PMC free article] [PubMed] [Google Scholar]
- 36.Gonzalez VM, Fuertes MA, Alonso C, Perez JM. Is cisplatin-induced cell death always produced by apoptosis? Mol Pharmacol. 2001;59(4):657–663. doi: 10.1124/mol.59.4.657. [DOI] [PubMed] [Google Scholar]
- 37.Groocock LM, Prudden J, Perry JJ, Boddy MN. The RecQ4 orthologue Hrq1 is critical for DNA interstrand cross-link repair and genome stability in fission yeast. Mol Cell Biol. 2012;32(2):276–287. doi: 10.1128/MCB.06184-11. [DOI] [PMC free article] [PubMed] [Google Scholar]
- 38.Tong AH, et al. Global mapping of the yeast genetic interaction network. Science. 2004;303(5659):808–813. doi: 10.1126/science.1091317. [DOI] [PubMed] [Google Scholar]
- 39.Seebacher J, Gavin AC. SnapShot: Protein-protein interaction networks. Cell. 2011;144(6):1000–1000.e1. doi: 10.1016/j.cell.2011.02.025. [DOI] [PubMed] [Google Scholar]
Associated Data
This section collects any data citations, data availability statements, or supplementary materials included in this article.