Abstract
Multifunctional theranostics have recently been intensively explored to optimize the efficacy and safety of therapeutic regimens. In this work, a photo-theranostic agent based on chlorin e6 (Ce6) photosensitizer-conjugated silica-coated gold nanoclusters (AuNCs@SiO2-Ce6) is strategically designed and prepared for fluorescence imaging-guided photodynamic therapy (PDT). The AuNCs@SiO2-Ce6 shows the following features: i) high Ce6 photosensitizer loading; ii) no non-specific release of Ce6 during its circulation; iii) significantly enhanced cellular uptake efficiency of Ce6, offering a remarkably improved photodynamic therapeutic efficacy compared to free Ce6; iv) subcellular characterization of the nanoformula via both the fluorescence of Ce6 and plasmon luminescence of AuNCs; v) fluorescence imaging-guided photodynamic therapy (PDT). This photo-theranostics owns good stability, high water dispersibility and solubility, non-cytotoxicity, and good biocompatibility, thus facilitating its biomedical applications, particularly for multi-modal optical, CT and photoacoustic (PA) imaging guided PDT or sonodynamic therapy.
Keywords: Theranostics, silica, gold nanocluster, chlorin e6 (Ce6), fluorescence imaging, photodynamic therapy
1. Introduction
The development of activatable theranostics with the capacity to respond to a given stimulus has attracted extensive interest owing to their dramatically enhanced selectivity and specificity for disease destruction with highly localized cytotoxicity and little collateral damage [1–7]. So far, both exogenous and endogenous stimuli (such as temperature, pH, applied magnetic/electrical field, ultrasound, light, and enzymatic action, etc.) have been developed to control the activation of theranostics [8–16]. Light stimulus, as a particularly attractive and convenient option, owing to its specific spatial and temporal controllable ability, has been extensively applied for photodynamic therapy (PDT), photothermal therapy (PTT) and photo-triggered chemotherapy [17–29].
PDT is an emerging external light activatable therapy for various diseases involving three key components: the photosensitizer (PS), light (typically a laser), and tissue oxygen [30–32]. After systemic, local, or topical administration of PS with sufficient incubation period, selective illumination is conducted at the region of interest with appropriate wavelength and power of light [33]. Upon illumination, PS is able to transfer the absorbed photon energy to surrounding oxygen molecules, generating reactive oxygen species (ROS) such as singlet oxygen (SO) or free radicals to induce cell death and tissue destruction without damage to the adjacent healthy tissue in the dark [34]. However, most PSs are limited by prolonged cutaneous photosensitivity, poor water-solubility and inadequate selectivity [12, 35–37]. Hydrophobic nature of most PSs results in strong self-aggregation in aqueous media, which significantly reduces their photodynamic efficacy because only monomeric species are appreciably photoactive [21]. To address these issues, various nanocarriers, such as liposomes, polymeric nanoparticles, proteins, ceramic nanoparticles, carbon nanomaterials, gold nanoparticles, quantum dots (QDs), magnetic nanoparticles (MNPs), upconversion nanoparticles (UCNPs) and so on, have been developed to fabricate a stable dispersion of PDT pharmaceutical formulations in aqueous systems for effective delivery of PSs [35–44]. To date, two main strategies have been employed for the delivery of PSs: (1) Encapsulation, in which PSs are loaded in the core of core-shell structured nanocarriers or mixed in the matrix of nanocarriers [3, 36, 37, 45]. (2) Conjugation, in which PSs are conjugated with oligonucleotides, monoclonal antibodies, carrier proteins, lipids, carbohydrates, hydrophilic polymers, or organic coupling agent on the surface of inorganic nanocarriers [3, 36, 37, 46–48]. It is understood that PDT does not require the release of PSs to directly interact with the lesion cells/tissues, but the ROS generated by PSs upon illumination need to interact with diseased cells to achieve the photodynamic efficacy [49, 50]. If suitably formulated, it will be able to avoid the leakage of PSs in the blood circulation without compromising the photodynamic efficacy of PSs [51]. Comparing encapsulation with conjugation, the encapsulation strategy has the following disadvantages: (1) Most of them suffer from poor drug loading and increased self-aggregation of the drug in the entrapped state [21, 45]. (2) The shell layer materials or the matrix will impair the absorbed photon energy of PSs [33, 49, 50]. (3) In the process of PDT, the dispersion of ROS will react with the shell layer materials or the matrix, especially polymeric materials, resulting in lower photodynamic efficacy than free PSs [12].
Recently, we developed a multifunctional drug delivery system based on photosensitizer-conjugated MNPs that was strategically designed and prepared for simultaneous targeting PDT and dual-modal near-infrared (NIR) fluorescence imaging and MRI of gastric cancer tissue in vivo [33]. We found that the covalently incorporated Ce6 molecules retained their spectroscopic and functional properties for NIR fluorescence imaging and PDT, and the core MNPs offered the functions of magnetically guided drug delivery and magnetic resonance imaging (MRI). Furthermore, we developed a theranostic platform based on Ce6-conjugated carbon dots (C-dots-Ce6). Our results indicated that C-dots-Ce6 is a good candidate with excellent imaging and tumor-homing ability for NIR fluorescence imaging guided PDT treatment [34]. Ce6-conjugated hexagonal phase NaYF4:Yb,Er/NaGdF4 core-shell upconversion nanoparticle (UCNP) platform was also developed for in vivo dual-modal luminescence imaging and MRI, and PDT treatment [52]. By taking the above-mentioned facts into consideration, the PS conjugation strategy is a better choice than PS encapsulation strategy in PDT, since the conjugation strategy owns high drug loading, does not affect the absorbance of the PSs, effectively avoids self-aggregation and leakage of the PSs, and blocks the direct interaction between PSs and matrices [34, 38].
Many types of fluorescent materials, such as QDs, and UCNPs have been applied for optical imaging and as platforms for drug/gene delivery. However, most traditional QDs contain heavy metal elements (such as Cd2+, Pb2+, etc.). The cytotoxicity of the released heavy metal ions in biological systems and potential environmental hazard of these ions limit further applications of QDs in theranostics [53–55]. For UCNPs, the lanthanide complexes as a typical delegate have disadvantages in thermal stability and mechanical stability which limit further applications [56]. On the other hand, noble metal nanoclusters such as gold nanoclusters (AuNCs) are highly attractive because of their high fluorescence, good photostability, non-toxicity, excellent biocompatibility and water-solubility [57]. Herein, we constructed a photo-theranostics based on Ce6-conjugated silica-coated gold nanoclusters (AuNCs@SiO2-Ce6) for fluorescence imaging-guided PDT.
2. Materials and Methods
2.1. Synthesis of AuNCs
Gold nanoclusters (AuNCs) were prepared by a previously reported method [58]. Briefly, 10 ml of HAuCl4 solution (10 mM) was added into 10 ml of bovine serum albumin (BSA) solution (50 mg/ml) under vigorous magnetic stirring for over 2 min at 37 °C, then 250 ul of L-ascorbic acid (0.35 mg/ml) was added by dropwise. After 5 min, 1 ml of NaOH solution (1 M) was introduced, and the resulting mixed solution was incubated at 37 °C for 9 h. The color of the solution turned into light brown and finally changed into dark brown. The reaction mixture was kept in the refrigerator (4 °C) under the dark for further use.
2.2. Synthesis of AuNCs@SiO2
Silica coating was conducted to obtain a core-shell structure fluorescence nanoparticle via a modified Stöber method. In a typical experiment, 200 μl of AuNCs was added into 20 ml of alcoholic solution containing 800 μl of ammonia (ca. 28 wt%) under sonication for 5 min. Then, 200 μl of tetraethylorthosilicate (TEOS, 99.9%) was added under vigorous magnetic stirring for 1 h. Afterwards, another 200 μl of TEOS was added under vigorous stirring. The entire system was vigorously stirred for 24 h. AuNCs@SiO2 were collected by centrifugation at a speed of 9000 rpm and washed with ethanol and deionized (DI) water for several times. The obtained purified AuNCs@SiO2 samples were redispersed into DI water for further characterization and application.
2.3. Quantification of the number of AuNCs in a single AuNCs@SiO2
The obtained purified AuNCs@SiO2 samples were collected by centrifugation and dried at 60 °C for 3 h in vacuum oven. Then the dry powder of AuNCs@SiO2 was put in a quartz crucible and calcined at 600 °C for 2 h. In the process of calcination, the bovine serum albumin (BSA) molecules capping on the surface of AuNCs will decompose into CO2 and H2O, then all of AuNCs will fuse together into a single GNP.
2.4. Synthesis of AuNCs@SiO2-Ce6
Excess amount of 3-aminopropyltrimethoxysilane (APTS) was added to the AuNCs@SiO2 solution with rapid stirring for 12 h. The resultant was washed with DI water for several times. APTS modified silica-coated AuNCs (AuNCs@SiO2-NH2) were terminated with amine groups. Covalent binding of Ce6 to the AuNCs@SiO2-NH2 was performed using a standard EDC–NHS reaction. Carboxyl groups of Ce6 (2 mg) were activated by an EDC/NHS solution for 30 min. Following activation, 6 mg of AuNCs@SiO2-NH2 were added to form a mixed solution and allowed to react at room temperature for 12 h. The resultants were washed five times by DI water and ethanol alternatively for removing unreacted chemicals by centrifugation at 9000 rpm for 10 min. The product was dispersed in PBS buffer (pH= 7.4) for further characterization and application.
2.5. Characterization of AuNCs@SiO2-Ce6
The morphology and size of the aqueous dispersion of the samples were characterized using transmission electron microscopy (TEM) (FEI Tecnai 12), operating at an accelerating voltage of 120 kV. UV–vis spectra were measured by a Genesys 10S UV-Vis Spectrophotometer (Thermo Scientific, Waltham, MA). Fourier transform infrared (FTIR) spectroscopy of AuNCs@SiO2-Ce6 was recorded using a Perkin-Elmer spectrum GX spectrophotometer. Fluorescence spectra were recorded on a Hitachi F-7000 spectrofluorometer. The surface charge of the samples was measured with Zeta potential measurements in water (NICOMP 380ZLS zeta potential/particle size analyzer).
2.6. Conjugation and loading efficiency measurements
UV-vis measurements of AuNCs@SiO2-Ce6 at different concentrations were carried out. Loading efficiency of AuNCs@SiO2-Ce6 was also calculated by the Ce6 UV calibration curve at 663 nm (in PBS solution). Every experiment was repeated three times.
2.7. Singlet oxygen detection
Singlet oxygen sensor green (SOSG) that is highly selective for singlet oxygen, was used to evaluate the singlet oxygen generation (SOG) of AuNCs@SiO2-Ce6. The concentration of Ce6 in AuNCs@SiO2-Ce6 is fixed at 0.5 μM. The mixture solutions were irradiated with a 671 nm laser (200 mW/cm2). SOSG was dissolved in water containing 2% methanol with the final concentration of 1 μM. SOSG fluorescence emission was produced using an excitation wavelength of 494 nm. The sample’s SOG was evaluated by the SOSG fluorescence enhancement compared with the background or control samples.
2.8. Subcellular localization and uptake efficiency
MDA-MB-435 cell line was cultured in L-15 medium medium containing 10% fetal bovine serum and incubated at 37 °C in a humidified 5% CO2 atmosphere. For subcellular colocalization, cells (1 × 10⁴ cells per well) were seeded in 8-well lab-Tek chamber slide and incubated overnight. Then the cells were incubated with 10 μM AuNCs@SiO2-Ce6 in the dark for 24 h. After being rinsed with PBS (pH 7.4) for three times, the cells were stained by DAPI (4′, 6-diamidino-2-phenylindole) and Alexa Fluor® 488 Dye, and observed by fluorescence imaging using a laser scanning confocal microscope (FLUOVIEW FV10i, Olympus).
For cellular uptake efficiency, the cells (5 × 10⁴ cells per well) were seeded in 6 well plates and incubated overnight, then incubated with 10 μM AuNCs@SiO2-Ce6. At different incubation time points (0.5, 1, 2, 6, and 24 h), cells were rinsed with PBS for three times, trpsinized, and resuspended with medium. Afterwards, cells were analyzed by Accuri C6 flow cytometer using C Flow Plus software (BD, Ann Arbor, MI).
2.9. In vitro laser-induced PDT effect
Two plates were set up as dark control and experimental group for the MTT assay. MDA-MB-435 cells (1 × 10⁴ cells per well) were seeded in 96-well plates and incubated overnight at 37 °C in a humidified 5% CO2 atmosphere. After being rinsed with PBS (pH 7.4), the cells were incubated with free Ce6 and AuNCs@SiO2-Ce6 at a concentration range of 0~20 μM for 12 h at 37 °C under the same conditions. Afterwards, the cells were then rinsed again with PBS and immersed in 100 μl of fresh culture medium before being illuminated. For the free Ce6 group, the cells were illuminated using a 671 nm laser with energy density of ~2 W/cm2 for 3 min. For the AuNCs@SiO2-Ce6 group, the cells were illuminated using a 671 nm laser with energy density of ~2 W/cm2 for 1 min. After illumination, cells were incubated for 24 h in a 5% CO2, 95% air humidified incubator at 37 °C. Dark control group keep identical to the experimental group except for illumination. The standard MTT assay was carried out to evaluate the cell viability.
2.10. In vivo fluorescence imaging-guided PDT
Animal procedures were performed according to a protocol approved by the National Institutes of Health Clinical Center Animal Care and Use Committee (NIH CC/ACUC). The tumor model was established in 4–6 week-old female nude mice by subcutaneous injection of 5×10⁶ of MDA-MB-435 cells to the right shoulder. When the tumor size reached ~60 mm3 (10–14 days after tumor inoculation), MDA-MB-435 tumor-bearing mice were used for fluorescence imaging and photodynamic therapy. After tail vein injection of AuNCs@SiO2-Ce6, the mice were anesthetized and placed on an animal plate heated to 37 °C. The fluorescent scans were performed using Cambridge Research & Instrumentation (CRi) in vivo imaging system (CRi, MA, USA)at various time points (1, 2, 4 and 24 h) after i.v. injection. The tumor bearing mice were sacrificed by exsanguinations at 24 h post-injection and the tumor and major organs were harvested.
MDA-MB-435 tumor-bearing mice were divided into 4 groups (n = 5/group) to determine tumor growth rate after the following treatments: (a) PBS + irradiation; (b) Ce6 + irradiation; (c) AuNCs@SiO2-Ce6 only; and (d) AuNCs@SiO2-Ce6 + irradiation. The tumor was irradiated for 10 min using a 671 nm laser (100 mW/cm2) coupled to a 1 m quartz fiber optic cable terminating in a microlens to distribute light uniformly throughout the treatment field. The tumor sizes were measured by caliper every two days after treatment. Tumor volume (V) was determined by the following equation: V = AB2*0.52, where A was the longer and B was the shorter diameter (mm). The relative tumor volumes were normalized to their initial sizes.
3. Results and Discussion
3.1. Synthesis of AuNCs@SiO2-Ce6
AuNCs are different from gold nanoparticles in that they can be highly fluorescent, do not support a surface plasmon, and do not have the metallic and bulk-like properties of nanoparticles and nanocomposites [58]. Therefore, noble metal nanoclusters are a good theranostic candidate for both fluorescence imaging and drug loading. Fluorescent AuNCs consisting of 25 gold atoms were prepared by a protein-directed biomimetic synthesis method with a red emission and a quantum yield (QY) of around 6% [57]. Due to its ultrasmall size (< 1 nm), AuNCs are difficult to separate and purify [59]. To solve this problem, silica nanoparticles were used to entrap AuNCs by a modified Stöber method [35]. Silica coating has a number of traits over commonly used organic polymers. For example, silica is extremely stable, and not vulnerable to microbial attack [45]. Unlike polymers, there is typically no swelling or porosity change for silica with a change in pH. Silica can also be easily modified on the surface with a variety of functional groups using silane chemistry and commercially available organosilicon reagents for further surface functionalization [24, 60]. More importantly, silica plays a protective role to improve the photostability and the chemical stability of the fluorescent AuNCs [45]. As illustrated in Figure 1, AuNCs were coated by a silica layer to form a fluorescent core-shell nanostructure. A silane coupling agent, 3-aminopropyltrimethoxysilane (APTS), was used to modify the silica surface for further conjugation [33]. Covalent binding of Ce6 to AuNCs@SiO2-NH2 was performed using a modified EDC-NHS reaction [34, 61]. After calcination of AuNCs@SiO2 at 600 °C for 2 h, the AuNCs in the core were fused into a single gold nanoparticle (GNP).
Figure 1.
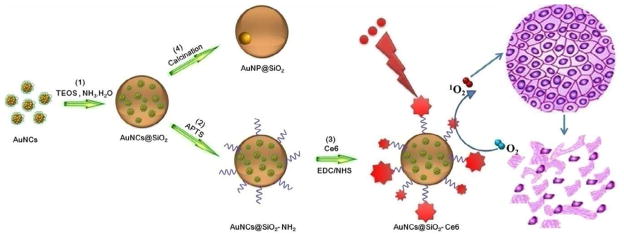
Illustration of the synthetic procedure of Ce6-conjugated silica-coated gold nanoclusters (AuNCs@SiO2-Ce6) for photodynamic therapy and the calcination of AuNCs@SiO2 into AuNP@SiO2. (1) AuNCs were coated by a silica layer to form a fluorescent core-shell nanostructure using a modified Stöber method. (2) A silane coupling agent, 3-aminopropyltrimethoxysilane (APTS), was used to modify the silica surface for further conjugation. (3) Covalent binding of Ce6 to the AuNCs@SiO2-NH2 was performed using a modified EDC-NHS reaction. (4) AuNCs@SiO2 was calcined at 600 °C for 2 h to fuse into GNP@SiO2.
3.2. TEM images and size distribution of AuNCs@SiO2-Ce6
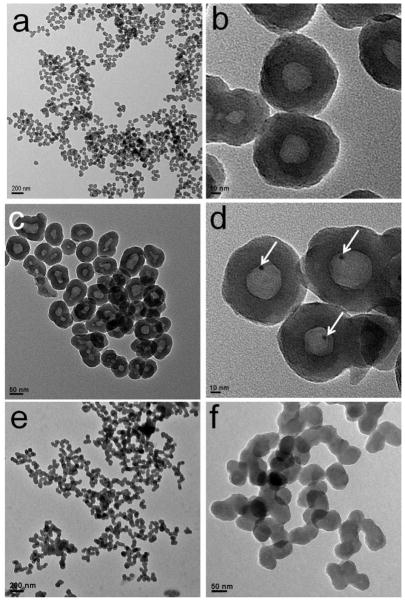
The size and morphology of the as-prepared AuNCs@SiO2, GNP@SiO2 and AuNCs@SiO2-Ce6 were characterized by transmission electronic microscopy (TEM) (Figure 2). As show in Figure 2a & b, AuNCs@SiO2 are spherical nanoparticles with an average size of 67.93 ± 8.5 nm, estimated by measuring 200 randomly selected nanoparticles in the enlarged TEM images. The corresponding histogram of the AuNCs@SiO2 shows that the particle size distribution can be fitted by a Gaussian curve (Supplementary Figure S1a). Moreover, the nanoparticles with well-defined core–shell nanostructures are rather monodisperse. The silica shell has an average thickness of 24.37 ± 3.5 nm. The AuNCs core has an average size of 22.42 ± 3.65 nm. The corresponding histograms of the thickness of silica shell and the size of AuNCs core also suggest Gaussian distribution of the sizes (Supplementary Figure S1b & c).
Figure 2.
TEM images of (a, b) AuNCs@SiO2, (c, d) AuNP@SiO2, and (e, f) AuNCs@SiO2-Ce6. (a, c, e) are at low magnification and (b, d, f) are at high magnification. White arrows point at the AuNPs.
3.3. Quantification of the number of AuNCs in a single AuNCs@SiO2
To quantify the number of AuNCs per AuNCs@SiO2, the dry powder of AuNCs@SiO2 was calcined at 600 °C for 2 h. In the process of calcination, bovine serum albumin (BSA) molecules capped on the surface of AuNCs were decomposed into CO2 and H2O, and all the AuNCs were fused into a single GNP. Figure 2c & d show the TEM images of AuNP@SiO2. As can be seen, AuNP@SiO2 displays a well-defined “nanorattle” structure. There is a single GNP in every silica nanoparticle. This result suggests that the silica nanoparticles can be used as nanoreactors for bottom-up synthesis of metal nanoparticles. The average size of GNPs in AuNP@SiO2 is 4.31 ± 0.38 nm, estimated by measuring 100 randomly selected nanoparticles in the enlarged TEM images. The corresponding histogram of GNPs also shows Gaussian distribution of the particle size (Supplementary Figure S1d). Given the size of a gold atom (0.017 nm3), the volume of an AuNC consisting of 25 gold atoms is thus 0.425 nm3. The number of AuNCs in a single AuNCs@SiO2 can be calculated using Equation 1, where R is the radius of the GNPs. It is estimated to have about 100 ± 25 AuNCs per nanoparticle.
| (Equation 1) |
Figure 2e & f show that AuNCs@SiO2-Ce6 are spherical nanoparticles with an average size of 68.22 ± 8.42 nm (Supplementary Figure S1e). After conjugation with Ce6, the core-shell nanostructures of AuNCs@SiO2 cannot be observed, which is attributed to the high electron density of the abundant Ce6 molecules coated on the surface of AuNCs@SiO2.
3.4. Conjugation and Loading Efficiency of AuNCs@SiO2-Ce6
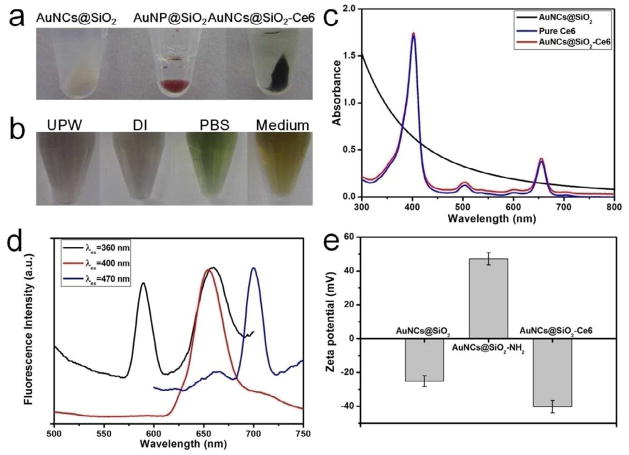
Figure 3a shows the photographs of AuNCs@SiO2, GNPs@SiO2, and AuNCs@SiO2-Ce6 in eppendorf tubes after centrifugation. One can see that the AuNCs@SiO2 display white color. After calcination, the GNPs@SiO2 display red color, due to the formation of GNPs by the fusion of AuNCs. After conjugation, the AuNCs@SiO2-Ce6 display dark green color, due to the existence of Ce6 on the surface of AuNCs@SiO2. The AuNCs@SiO2-Ce6 are stable in various media such as ultrapure water (UPW), deionized water (DI), PBS buffer (pH 7.4) and cell medium (Figure 3b). Figure 3c shows UV-vis absorbance spectra of AuNCs@SiO2, pure Ce6, and AuNCs@SiO2-Ce6. Pure Ce6 exhibits a strong Soret absorption at 406 nm and weak Q-bands between 500 and 700 nm [35]. AuNCs@SiO2 without Ce6 do not show characteristic absorption peaks of Ce6 in the range of 300~800 nm. After conjugation with Ce6, the absorption of AuNCs@SiO2-Ce6 is similar to that of Ce6, indicating no changes to the Ce6’s chromophore upon conjugation. The conjugation efficiency of Ce6 was calculated by using Ce6 UV calibration curve at 663 nm (in PBS solution). The standard curve had a good linear relationship, described by the following typical equation: . The conjugation efficiency is 351.3% based on the added Ce6. The drug loading efficiency of AuNCs@SiO2-Ce6 is ~14.6 wt%.
Figure 3.
a) The photographs of AuNCs@SiO2, GNPs@SiO2, and AuNCs@SiO2-Ce6 in eppendorf vials after centrifugation. b) The photographs of AuNCs@SiO2-Ce6 in different solutions such as ultrapure water (UPW), deionized water (DI), PBS buffer (pH 7.4) and cell medium). c) UV-vis absorbance spectra of AuNCs@SiO2, pure Ce6, and AuNCs@SiO2-Ce6. d) Fluorescence emission spectra of AuNCs@SiO2-Ce6 at different excitation wavelengths (360, 400, and 470 nm). e) Zeta potentials of AuNCs@SiO2, AuNCs@SiO2-NH2, and AuNCs@SiO2-Ce6.
In the excitation spectrum (Supplementary Figure S2), AuNCs@SiO2 show the excitation peak at 470 nm and a strong shoulder in the range of 360~400 nm. The fluorescence emission spectra of AuNCs@SiO2 show shifted emission peaks from 585 nm to 696 nm as the excitation wavelength was changed from 360 nm to 470 nm. After conjugation with Ce6, the AuNCs@SiO2-Ce6 show excitation peaks at 400 and 470 nm (Supplementary Figure S3), which are corresponding to the excitation peaks of Ce6 and AuNCs, respectively. The fluorescence emission spectra of AuNCs@SiO2-Ce6 in DI water by different excitation wavelengths are shown in Figure 3c. Upon 360 nm excitation, AuNCs@SiO2-Ce6 show two emission peaks at 588 and 659 nm, which are corresponding to the emission peaks of Ce6 and AuNCs, respectively. Upon 400 nm excitation, AuNCs@SiO2-Ce6 show one emission peak at 655 nm, which belongs to Ce6. Upon 470 nm excitation, AuNCs@SiO2-Ce6 show one emission peak at 700 nm, which belongs to AuNCs (Supplementary Figure S4). Therefore, the fluorescence emission of AuNCs@SiO2-Ce6 can be adjusted by the change of excitation wavelengths.
Zeta potentials of AuNCs@SiO2, AuNCs@SiO2-NH2, and AuNCs@SiO2-Ce6 were recorded at pH 7.0 and shown in Figure 3d. The zeta potential of AuNCs@SiO2 is −25.22 ± 3.22 mV, due to the existence of –OH groups on the surface of AuNCs@SiO2. After modification with APTS, the zeta potential of AuNCs@SiO2-NH2 is 47.23 ± 3.62 mV, due to the existence of NH2 groups on the surface of AuNCs@SiO2-NH2. The surface functionalization of AuNCs@SiO2 was further characterized by FT-IR spectroscopy (Supplementary Figure S5). The bands at 1640 and 3247 cm−1 confirm the presence of amide bond and successful coupling of Ce6 onto the surface of AuNCs@SiO2-NH2. After conjugation with Ce6, the zeta potential of AuNCs@SiO2-Ce6 turns into −40.24 ± 3.70 mV. These results suggest that Ce6 was successfully conjugated with the amino groups of APTS on the surface of AuNCs@SiO2.
3.5. Single oxygen detection
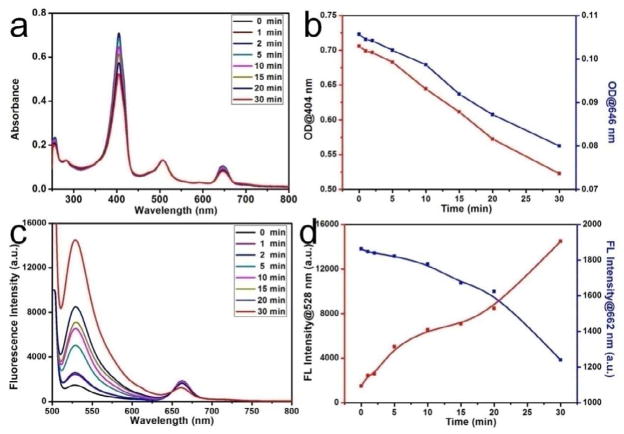
The generation of SO by AuNCs@SiO2-Ce6 was detected chemically using the singlet oxygen sensor green (SOSG) as a detector [62–64]. Figure 4a & b show the decrease in optical density (OD) at 404 and 646 nm as the function of irradiation time. As shown in Figure 4c, the SOSG’s fluorescence intensity exhibits a time-dependent enhancement after reaction with SO, generated from AuNCs@SiO2-Ce6 upon irradiation. Meanwhile, the Ce6’s fluorescence intensity exhibits a time-dependent reduction. Figure 4d shows the increase and decrease in fluorescence intensity at the characteristic peaks of SOSG (530 nm) and Ce6 (662 nm) as a function of laser irradiation time, respectively. For SOSG alone and SOSG + AuNCs@SiO2 with laser irradiation groups, the fluorescence intensities remain unaltered, which indicate that AuNCs@SiO2 alone cannot generate SO.
Figure 4.
a) Time-dependent bleaching of SOSG and AuNCs@SiO2-Ce6 caused by the singlet oxygen (SO) generated by AuNCs@SiO2-Ce6. b) The changes of optical density at various peaks (404 and 646 nm) as the function of laser irradiation time. c) Fluorescence emission spectra of AuNCs@SiO2-Ce6 in SOSG solution with the increase of the laser irradiation time. d) The changes of fluorescence intensity at the characteristic peaks of SOSG (528 nm) and Ce6 (662 nm) as a function of laser irradiation time. The concentration of Ce6 in AuNCs@SiO2-Ce6 is fixed at 0.5 μM. The mixture solutions were irradiated with a 671 nm laser (200 mW/cm2). SOSG was dissolved in water containing 2% methanol with the final concentration of 1 μM. SOSG fluorescence emission was produced using an excitation wavelength of 494 nm.
3.6. Subcellular localization and uptake efficiency
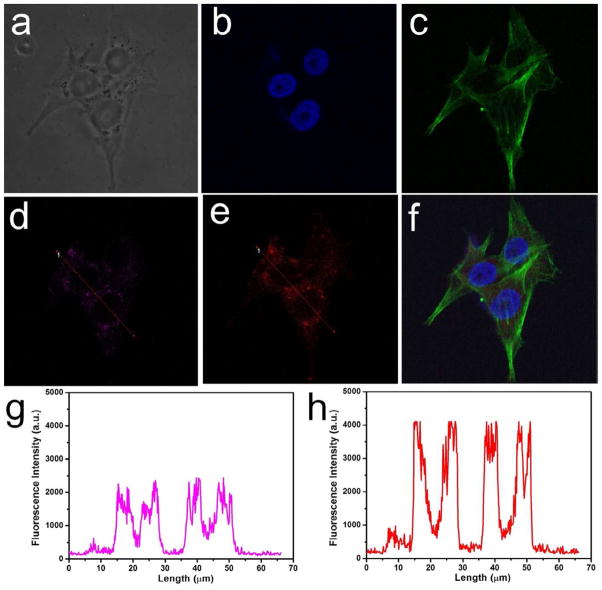
A laser scanning confocal microscope was used to verify the cellular localization of AuNCs@SiO2-Ce6 in MDA-MB-435 cells (Figure 5a). After the nuclei and F-actin of the tumor cells were simultaneously stained with DAPI (4′, 6-diamidino-2-phenylindole) (Figure 5b) and Alexa Fluor® 488 Dye (Figure 5c), respectively. AuNCs@SiO2-Ce6 were found to be located in the vesicles, such as lysosomes (Figure 5f). Almost complete co-localization could be observed by the fluorescence signals of AuNCs (Figure 5d) and Ce6 (Figure 5e), respectively. Although the intracellular locations of AuNCs and Ce6 are matched, the fluorescence intensity of Ce6 is higher than that of AuNCs, which is due to the high loading of Ce6 (>1000 Ce6 per AuNCs@SiO2). The low magnification fluorescence images of MDA-MB-435 cells incubated with AuNCs@SiO2-Ce6 are shown in Supplementary Figure S6.
Figure 5.
Subcellular colocalization of AuNCs@SiO2-Ce6, monitored by fluorescence imaging. MDA-MB-435 cell line was incubated with AuNCs@SiO2-Ce6 at a concentration of 10 μM for 2 h at 37 °C. a) Bright field. b-f) Fluorescence field, b) Nuclei of MDA-MB-435 cells stained by DAPI. c) F-actin of MDA-MB-435 cells stained by Alex 488. d) AuNCs of AuNCs@SiO2-Ce6 in MDA-MB-435 cells, e) Ce6 of AuNCs@SiO2-Ce6 in MDA-MB-435 cells, f) Merged image of b, c and e. g) Fluorescence intensity and location of AuNCs in MDA-MB-435 cells, h) Fluorescence intensity and location of Ce6 in MDA-MB-435 cells.
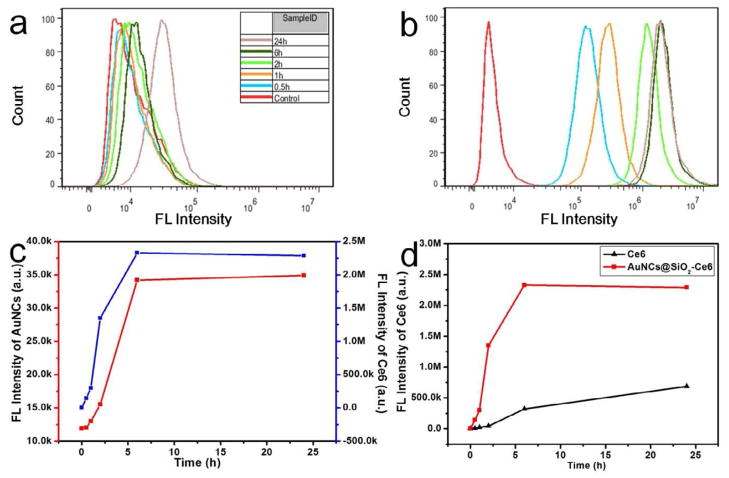
To quantify the cellular uptake efficiency of Ce6, fluorescence-activated cell sorting (FACS) distribution of free Ce6 and AuNCs@SiO2-Ce6 fluorescence in MDA-MB-435 cells were recorded at different incubation time points (0.5, 1, 2, 6, and 24 h) by flow cytometer. As shown in Figure 6a & b, both AuNCs and Ce6 have time-dependent fluorescence intensity enhancement with much higher fluorescence intensity for Ce6 than for AuNCs, which is in agreement with the microscopic image quantification results shown in Figure 5. Figure 6c shows the change of fluorescence intensity of AuNCs and Ce6 in tumor cells as a function of incubation time. The fluorescence intensities of AuNCs and Ce6 quickly arose within 0~6 h incubation, and plateaued in 6~24 h incubation. The increase of fluorescence intensity of Ce6 is in accordance with the increase of fluorescence intensity of AuNCs, which suggests that the AuNCs@SiO2-Ce6 remained intact and were together endocytosed by tumor cells. For free Ce6 and AuNCs@SiO2-Ce6, both of them display time-dependent enhancement of the fluorescence intensity (Figure 6c). The fluorescence intensity of Ce6 in AuNCs@SiO2-Ce6 group is always significantly higher than that in the free Ce6 group at all the time points examined. The mean fluorescence intensity (2.29 × 10⁶ a.u.) of Ce6 in the AuNCs@SiO2-Ce6 group was much stronger than that in the free Ce6 group (6.88 × 10⁵ a.u.) after 24 h incubation. For the AuNCs@SiO2-Ce6 group, the fluorescence intensity of Ce6 rapidly increased and reached a plateau after being incubated for 6 h. For free Ce6 group, the fluorescence intensity of Ce6 slowly increased in the course of 24 h (Figure 6d and Supplementary Figure S7). These results further validated the more rapid and enhanced cellular uptake efficiency of AuNCs@SiO2-Ce6, because of the higher internalization efficacy of AuNCs@SiO2-Ce6 through endocytosis than passive diffusion of free Ce6 into cells.
Figure 6.
Fluorescence-activated cell sorting (FACS) distribution of AuNCs and Ce6 fluorescence in MDA-MB-435 cells after 0.5, 1, 2, 6, and 24 h incubation with AuNCs@SiO2-Ce6 (10 μM) at 37 °C. a) Fluorescence intensity of AuNCs in MDA-MB-435 cells. b) Fluorescence intensity of Ce6 in MDA-MB-435 cells. c) The changes of fluorescence intensity of AuNCs and Ce6 in MDA-MB-435 cells as a function of incubation time. d) The changes of Ce6 fluorescence intensity in MDA-MB-435 cells as a function of incubation time.
3.7. In vitro laser-induced PDT effect
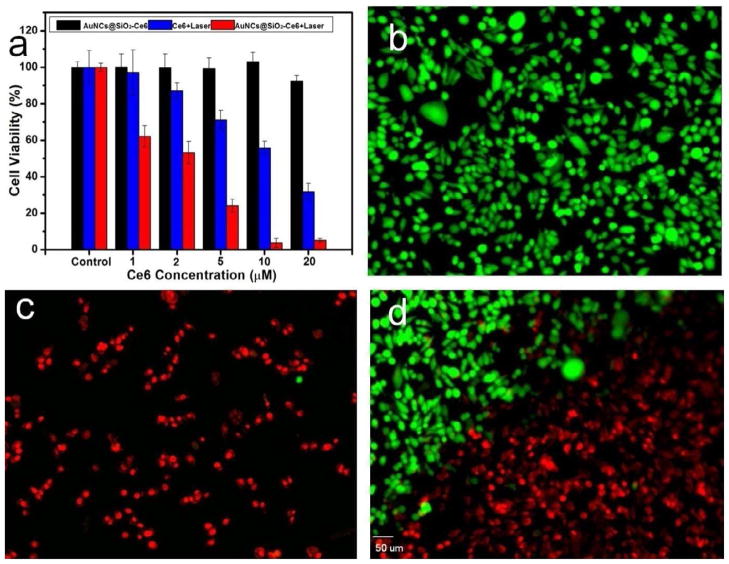
PDT effects of free Ce6 and AuNCs@SiO2-Ce6 in the concentration range of 0320 μM on MDA-MB-435 cells was detected by 3-(4,5-Dimethyl-2-thiazolyl)-2,5-diphenyl-2H-tetrazolium bromide (MTT) assay. As shown in Figure 7a, cell viability was normalized by control groups for cells without the treatment of drugs and irradiation. Without laser irradiation, AuNCs@SiO2-Ce6 exhibited negligible toxicity to MDA-MB-435 cells. In contrast, the cell viability of irradiated groups gradually decreased with the increase of Ce6 and AuNCs@SiO2-Ce6 concentration, indicating a laser irradiation induced concentration-dependent cytotoxicity on tumor cells. AuNCs@SiO2-Ce6 showed a significantly improved PDT efficacy over free Ce6 at all the studied concentrations. This result indicates that enhanced cellular uptake efficiency of Ce6 is responsible for the improved photodynamic therapeutic efficacy of AuNCs@SiO2-Ce6. Laser-triggered PDT effect of AuNCs@SiO2-Ce6 was also observed using Calcein AM and ethidium homodimer-1 co-staining. In the non-irradiated control group, the cells all display green fluorescence, which suggests that the cells keep good physiological state with spindle cell type (Figure 7b). Figure 7c shows that the tumor cells on the laser spot center display intense homogeneous red fluorescence in the nuclei, indicating cells are killed by AuNCs@SiO2-Ce6 upon irradiation. As shown in Figure 7d, at the boarder of the laser spot, cells without irradiation display green fluorescence and cells with irradiation are stained with red fluorescence and appear as small round or polygonal type. The results indicate that AuNCs@SiO2-Ce6 have the capability of selective PDT effect on tumor cells.
Figure 7.
a) MDA-MB-435 cell viability at different concentrations of free Ce6 and AuNCs@SiO2-Ce6 for 12 h at 37 °C with or without irradiation with a 671 nm laser (2 W/cm2). b-d) Calcein AM and ethidium homodimer-1 co-staining images of MDA-MB-435 cells incubated with AuNCs@SiO2-Ce6 at a concentration of 10 μM for 2 h at 37 °C prior to irradiation for 1 min with a 671 nm laser (2 W/cm2). b) MDA-MB-435 cells without irradiation. c) MDA-MB-435 cells with irradiation. d) MDA-MB-435 cells on the boundary of laser spot. The scale bar is 50 μm.
3.8. In vivo fluorescence imaging-guided PDT
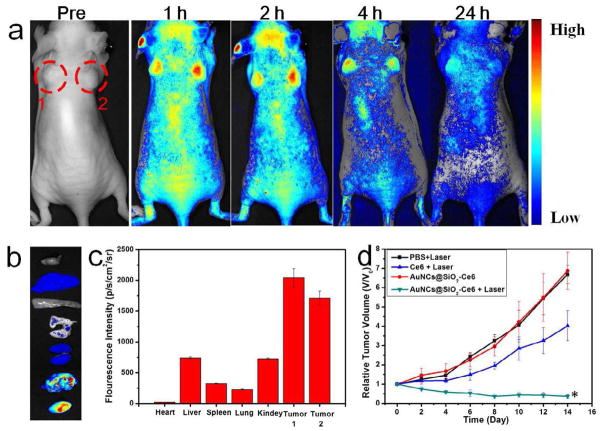
To demonstrate the ability of AuNCs@SiO2-Ce6 for in vivo photo-theranostic, we investigated its feasibility for fluorescence imaging-guided PDT. When the tumors reached 60 mm3, the mice were treated with intravenous injection of AuNCs@SiO2-Ce6 (5 μmol equevalent of Ce6/kg body weight). NIR fluorescence imaging was employed to monitor PDT in vivo. As shown in Figure 8a, after injection, significant fluorescence emitted from the AuNCs@SiO2-Ce6 injected mice was observed in the tumor area. Meanwhile, there are also fluorescence signal in the other tissues. At 24 h time point, the organs of AuNCs@SiO2-Ce6 injected mice were harvested for ex vivo imaging to quantify tissue/organ distribution (Figure 8b & c). The results suggest that AuNCs@SiO2-Ce6 preferentially accumulates at the tumor sites based on the enhanced permeability and retention (EPR) effects. In vivo photodynamic therapeutic efficacy of AuNCs@SiO2-Ce6 was evaluated by measuring tumor growth rates. Tumor volumes were normalized to their initial sizes. AuNCs@SiO2-Ce6 administration/irradiation groups showed remarkable tumor regression (P < 0.05) as illustrated in Figure 8d. The in vivo photodynamic therapeutic efficacy was significantly enhanced in AuNCs@SiO2-Ce6 treated group, compared with free Ce6 treated group. These results indicate that AuNCs@SiO2-Ce6 has excellent imaging capability without compromising the PDT efficacy, and is suitable for NIR fluorescence imaging-guided PDT treatment.
Figure 8.
a) Real-time in vivo NIR fluorescence images after intravenous injection of AuNCs@SiO2-Ce6 in nude mice at different time points, Red circles indicate the location of tumors; b) Ex vivo images of mouse tissues (from top to bottom: heart, liver, spleen, lung, kidneys, tumor 1, tumor 2); c) The fluorescence intensity of organs harvested at 24 h time point from post-injection mice; d) Tumor growth curves of different groups of tumor-bearing mice after treatment. Tumor volumes were normalized to their initial sizes. Error bars represent the standard deviations of 5 mice per group. *, P < 0.05.
4. Conclusion
We have successfully constructed a photo-theranostic formula based on chlorin e6-conjugated silica-coated gold nanoclusters (AuNCs@SiO2-Ce6) for fluorescence imaging-guided PDT. The AuNCs@SiO2-Ce6 shows the following features: i) high Ce6 photosensitizer loading; ii) no non-specific release of Ce6 during its circulation; iii) significantly enhanced cellular uptake efficiency of Ce6, offering a remarkably improved photodynamic therapeutic efficacy compared to free Ce6; iv) subcellular characterization of the nanoformula via both the fluorescence of Ce6 and plasmon luminescence of AuNCs; v) fluorescence imaging-guided photodynamic therapy (PDT). This photo-theranostics owns good stability, high water dispersibility and solubility, non-cytotoxicity, and good biocompatibility, thus facilitating its biomedical applications, particularly for multi-modal optical, CT and photoacoustic (PA) imaging guided PDT or sonodynamic therapy.
Supplementary Material
Acknowledgments
This work was supported in part, by National Key Basic Research Program (973 Project) (2010CB933901 and 2013CB733802), National Science Foundation of China (81171399, 81272987, 51102258, 31170961, 81101101, 81171399, 81230033 and 81101077), Jiangsu Province Foundation (BK2011166, BE2012622, BL2012031 and RC2011095), Zhejiang Province Foundation (LY12H11011), the Chinese Academy of Sciences professorship for Senior International Scientists (2011T2J06), and the Intramural Research Program (IRP) of the National Institute of Biomedical Imaging and Bioengineering (NIBIB), National Institutes of Health (NIH).
Footnotes
Publisher's Disclaimer: This is a PDF file of an unedited manuscript that has been accepted for publication. As a service to our customers we are providing this early version of the manuscript. The manuscript will undergo copyediting, typesetting, and review of the resulting proof before it is published in its final citable form. Please note that during the production process errors may be discovered which could affect the content, and all legal disclaimers that apply to the journal pertain.
References
- 1.Lovell J, Jin C, Huynh E, Jin H, Kim C, Rubinstein J, et al. Porphysome nanovesicles generated by porphyrin bilayers for use as multimodal biophotonic contrast agents. Nat Mater. 2011;20:324–32. doi: 10.1038/nmat2986. [DOI] [PubMed] [Google Scholar]
- 2.Lovell J, Liu T, Chen J, Zheng G. Activatable photosensitizers for imaging and therapy. Chem Rev. 2010;110:2839–57. doi: 10.1021/cr900236h. [DOI] [PubMed] [Google Scholar]
- 3.Rai P, Mallidi S, Zheng X, Rahmanzadeh R, Mir Y, Elrington S, et al. Development and applications of photo-triggered theranostic agents. Adv Drug Deliver Rev. 2010;62:1094–124. doi: 10.1016/j.addr.2010.09.002. [DOI] [PMC free article] [PubMed] [Google Scholar]
- 4.Fleige E, Quadir M, Haag R. Stimuli-Responsive Polymeric nanocarriers for the controlled transport of active compounds: Concepts and applications. Adv Drug Deliver Rev. 2012;64:866–84. doi: 10.1016/j.addr.2012.01.020. [DOI] [PubMed] [Google Scholar]
- 5.Park K, Lee S, Kang E, Kim K, Choi K, Kwon IC. New generation of multifunctional nanoparticles for cancer imaging and therapy. Adv Funct Mater. 2009;19:1553–66. [Google Scholar]
- 6.Yu MK, Park J, Jon S. Targeting strategies for multifunctional nanoparticles in cancer imaging and therapy. Theranostics. 2012;2:3–44. doi: 10.7150/thno.3463. [DOI] [PMC free article] [PubMed] [Google Scholar]
- 7.Chen XS. Introducing Theranostics journal-from the editor-in-chief. Theranostics. 2011;1:1–2. doi: 10.7150/thno/v01p0001. [DOI] [PMC free article] [PubMed] [Google Scholar]
- 8.Lee H, Lee S, Min KH, Kim MS, Lee DS, Choi Y, et al. In vivo tumor diagnosis and photodynamic therapy via tumoral pH-responsive polymeric micelles. Chem Comm. 2010;46:5668–70. doi: 10.1039/c0cc01413c. [DOI] [PubMed] [Google Scholar]
- 9.Lovell JF, Jin CS, Huynh E, MacDonald TD, Cao W, Zheng G. Enzymatic regioselection for the synthesis and biodegradation of porphysome nanovesicles. Angew Chem Int Ed. 2012;124:2479–83. doi: 10.1002/anie.201108280. [DOI] [PubMed] [Google Scholar]
- 10.Du J, O’Reilly R. Anisotropic particles with patchy, multicompartment and Janus architectures: Preparation and application. Chem Soc Rev. 2011;40:2402–16. doi: 10.1039/c0cs00216j. [DOI] [PubMed] [Google Scholar]
- 11.Du J, O’Reilly RK. Advances and challenges in smart and functional polymer vesicles. Soft Matter. 2009;5:3544–61. [Google Scholar]
- 12.Sun Y, Chen Z, Yang X, Huang P, Zhou X, Du X. Magnetic chitosan nanoparticles as a drug delivery system for targeting photodynamic therapy. Nanotechnology. 2009;20:135102. doi: 10.1088/0957-4484/20/13/135102. [DOI] [PubMed] [Google Scholar]
- 13.Cai X, Yang F, Gu N. Applications of magnetic microbubbles for theranostics. Theranostics. 2012;2:103–12. doi: 10.7150/thno.3464. [DOI] [PMC free article] [PubMed] [Google Scholar]
- 14.Chen Y, Liang G. Enzymatic self-Assembly of nanostructures for theranostics. Theranostics. 2012;2:139–47. doi: 10.7150/thno.3696. [DOI] [PMC free article] [PubMed] [Google Scholar]
- 15.Xie J, Liu G, Eden H, Ai H, Chen X. Surface-engineered magnetic nanoparticle platforms for cancer imaging and therapy. Acc Chem Res. 2011;44:883–92. doi: 10.1021/ar200044b. [DOI] [PMC free article] [PubMed] [Google Scholar]
- 16.Cui D, Han Y, Li Z, Song H, Wang K, He R, et al. Fluorescent magnetic nanoprobes for in vivo targeted imaging and hyperthermia therapy of prostate cancer. Nano Biomed Eng. 2009;1:61–74. [Google Scholar]
- 17.Ma Y, Liang X, Tong S, Bao G, Ren Q, Dai Z. Gold nanoshell nanomicelles for potential magnetic resonance imaging, light - triggered drug release, and photothermal therapy. Adv Funct Mater. 2013;23:815–22. [Google Scholar]
- 18.Beer AJ, Kessler H, Wester HJ, Schwaiger M. PET imaging of integrin αvβ3 expression. Theranostics. 2011;1:48–57. doi: 10.7150/thno/v01p0048. [DOI] [PMC free article] [PubMed] [Google Scholar]
- 19.Yang K, Hu L, Ma X, Ye S, Cheng L, Shi X, et al. Multimodal imaging guided photothermal therapy using functionalized graphene nanosheets anchored with magnetic nanoparticles. Adv Mater. 2012;24:1868–72. doi: 10.1002/adma.201104964. [DOI] [PubMed] [Google Scholar]
- 20.Tian B, Wang C, Zhang S, Feng L, Liu Z. Photothermally enhanced photodynamic therapy delivered by nano-graphene oxide. ACS Nano. 2011;5:7000–9. doi: 10.1021/nn201560b. [DOI] [PubMed] [Google Scholar]
- 21.Liang X, Li X, Yue X, Dai Z. Conjugation of porphyrin to nanohybrid cerasomes for photodynamic diagnosis and therapy of cancer. Angew Chem Int Ed. 2011;123:11826–31. doi: 10.1002/anie.201103557. [DOI] [PubMed] [Google Scholar]
- 22.Li Z, Huang P, Zhang X, Lin J, Yang S, Liu B, et al. RGD-conjugated dendrimer-modified gold nanorods for in vivo tumor targeting and photothermal therapy. Mol Pharm. 2009;7:94–104. doi: 10.1021/mp9001415. [DOI] [PubMed] [Google Scholar]
- 23.Cui D, Huang P, Zhang C, Ozkan CS, Pan B, Xu P. Dendrimer-modified gold nanorods as efficient controlled gene delivery system under near-infrared light irradiation. J Control Release. 2011;152(Suppl 1):e137–e9. doi: 10.1016/j.jconrel.2011.08.047. [DOI] [PubMed] [Google Scholar]
- 24.Huang P, Bao L, Zhang C, Lin J, Luo T, Yang D, et al. Folic acid-conjugated silica-modified gold nanorods for X-ray/CT imaging-guided dual-mode radiation and photo-thermal therapy. Biomaterials. 2011;32:9796–809. doi: 10.1016/j.biomaterials.2011.08.086. [DOI] [PubMed] [Google Scholar]
- 25.Huang P, Pandoli O, Wang X, Wang Z, Li Z, Zhang C, et al. Chiral guanosine 5′-monophosphate-capped gold nanoflowers: Controllable synthesis, characterization, surface-enhanced Raman scattering activity, cellular imaging and photothermal therapy. Nano Res. 2012;5:630–9. [Google Scholar]
- 26.Zhang Z, Wang L, Wang J, Jiang X, Li X, Hu Z, et al. Mesoporous silica-coated gold nanorods as a light-mediated multifunctional theranostic platform for cancer treatment. Adv Mater. 2012;24:1418–23. doi: 10.1002/adma.201104714. [DOI] [PubMed] [Google Scholar]
- 27.Koo H, Sun IC, Ryu JH, Kim K, Kwon IC. Multifunctional nanoparticles for multimodal imaging and theragnosis. Chem Soc Rev. 2012;41:2656–72. doi: 10.1039/c2cs15261d. [DOI] [PubMed] [Google Scholar]
- 28.Huang X, Jain P, El-Sayed I, El-Sayed M. Plasmonic photothermal therapy (PPTT) using gold nanoparticles. Laser Med Sci. 2008;23:217–28. doi: 10.1007/s10103-007-0470-x. [DOI] [PubMed] [Google Scholar]
- 29.Huang X, El-Sayed IH, Qian W, El-Sayed MA. Cancer cell imaging and photothermal therapy in the near-infrared region by using gold nanorods. J Am Chem Soc. 2006;128:2115–20. doi: 10.1021/ja057254a. [DOI] [PubMed] [Google Scholar]
- 30.Huang Z, Li L, Wang H, Wang X, Yuan K, Meyers A, et al. Photodynamic therapy–an update on clinical applications. J Innov Opt Health Sci. 2009;2:73–92. [Google Scholar]
- 31.Huang Z, Xu H, Meyers AD, Musani AI, Wang L, Tagg R, et al. Photodynamic therapy for treatment of solid tumors–potential and technical challenges. Technol Cancer Res Treat. 2008;7:309–20. doi: 10.1177/153303460800700405. [DOI] [PMC free article] [PubMed] [Google Scholar]
- 32.Celli JP, Spring BQ, Rizvi I, Evans CL, Samkoe KS, Verma S, et al. Imaging and photodynamic therapy: Mechanisms, monitoring and optimization. Chem Rev. 2010;110:2795–838. doi: 10.1021/cr900300p. [DOI] [PMC free article] [PubMed] [Google Scholar]
- 33.Huang P, Li Z, Lin J, Yang D, Gao G, Xu C, et al. Photosensitizer-conjugated magnetic nanoparticles for in vivo simultaneous magnetofluorescent imaging and targeting therapy. Biomaterials. 2011;32:3447–58. doi: 10.1016/j.biomaterials.2011.01.032. [DOI] [PubMed] [Google Scholar]
- 34.Huang P, Lin J, Wang X, Wang Z, Zhang C, He M, et al. Light-triggered theranostics based on photosensitizer-conjugated carbon dots for simultaneous enhanced-fluorescence imaging and photodynamic therapy. Adv Mater. 2012;24:5104–10. doi: 10.1002/adma.201200650. [DOI] [PMC free article] [PubMed] [Google Scholar]
- 35.Huang P, Xu C, Lin J, Wang C, Wang X, Zhang C, et al. Folic acid-conjugated graphene oxide loaded with photosensitizers for targeting photodynamic therapy. Theranostics. 2011;1:240–50. doi: 10.7150/thno/v01p0240. [DOI] [PMC free article] [PubMed] [Google Scholar]
- 36.Bechet D, Couleaud P, Frochot C, Viriot ML, Guillemin F, Barberi-Heyob M. Nanoparticles as vehicles for delivery of photodynamic therapy agents. Trends Biotechnol. 2008;26:612–21. doi: 10.1016/j.tibtech.2008.07.007. [DOI] [PubMed] [Google Scholar]
- 37.Wang S, Gao R, Zhou F, Selke M. Nanomaterials and singlet oxygen photosensitizers: potential applications in photodynamic therapy. J Mater Chem. 2004;14:487–93. [Google Scholar]
- 38.Huang P, Lin J, Yang D, Zhang C, Li Z, Cui D. Photosensitizer-loaded dendrimer-modified multi-walled carbon nanotubes for photodynamic therapy. J Control Release. 2011;152:e33–e4. doi: 10.1016/j.jconrel.2011.08.105. [DOI] [PubMed] [Google Scholar]
- 39.Samia ACS, Chen X, Burda C. Semiconductor quantum dots for photodynamic therapy. J Am Chem Soc. 2003;125:15736–7. doi: 10.1021/ja0386905. [DOI] [PubMed] [Google Scholar]
- 40.Chatterjee DK, Fong LS, Zhang Y. Nanoparticles in photodynamic therapy: an emerging paradigm. Adv Drug Deliver Rev. 2008;60:1627–37. doi: 10.1016/j.addr.2008.08.003. [DOI] [PubMed] [Google Scholar]
- 41.Juzenas P, Chen W, Sun YP, Coelho MAN, Generalov R, Generalova N, et al. Quantum dots and nanoparticles for photodynamic and radiation therapies of cancer. Adv Drug Deliver Rev. 2008;60:1600–14. doi: 10.1016/j.addr.2008.08.004. [DOI] [PMC free article] [PubMed] [Google Scholar]
- 42.Wang C, Tao H, Cheng L, Liu Z. Near-infrared light induced in vivo photodynamic therapy of cancer based on upconversion nanoparticles. Biomaterials. 2011;32:6145–54. doi: 10.1016/j.biomaterials.2011.05.007. [DOI] [PubMed] [Google Scholar]
- 43.Xiao Y, Hong H, Matson VZ, Javadi A, Xu W, Yang Y, et al. Gold nanorods conjugated with doxorubicin and cRGD for combined anticancer drug delivery and PET imaging. Theranostics. 2012;2:757–68. doi: 10.7150/thno.4756. [DOI] [PMC free article] [PubMed] [Google Scholar]
- 44.Li B, Moriyama EH, Li F, Jarvi MT, Allen C, Wilson BC. Diblock copolymer micelles deliver hydrophobic protoporphyrin IX for photodynamic therapy. Photochem Photobiol. 2007;83:1505–12. doi: 10.1111/j.1751-1097.2007.00194.x. [DOI] [PubMed] [Google Scholar]
- 45.Roy I, Ohulchanskyy TY, Pudavar HE, Bergey EJ, Oseroff AR, Morgan J, et al. Ceramic-based nanoparticles entrapping water-insoluble photosensitizing anticancer drugs: a novel drug-carrier system for photodynamic therapy. J Am Chem Soc. 2003;125:7860–5. doi: 10.1021/ja0343095. [DOI] [PubMed] [Google Scholar]
- 46.Lee SJ, Park K, Oh YK, Kwon SH, Her S, Kim IS, et al. Tumor specificity and Therapeutic efficacy of photosensitizer-encapsulated glycol chitosan-based nanoparticles in tumor-bearing mice. Biomaterials. 2009;30:2929–39. doi: 10.1016/j.biomaterials.2009.01.058. [DOI] [PubMed] [Google Scholar]
- 47.Jeong H, Huh MS, Lee SJ, Koo H, Kwon IC, Jeong SY, et al. Photosensitizer-conjugated human serum albumin nanoparticles for effective photodynamic therapy. Theranostics. 2011;1:230–9. doi: 10.7150/thno/v01p0230. [DOI] [PMC free article] [PubMed] [Google Scholar]
- 48.Jang B, Choi Y. Photosensitizer-conjugated gold nanorods for enzyme-activatable fluorescence imaging and photodynamic therapy. Theranostics. 2012;2:190–7. doi: 10.7150/thno.3478. [DOI] [PMC free article] [PubMed] [Google Scholar]
- 49.Chen ZL, Sun Y, Huang P, Yang XX, Zhou XP. Studies on preparation of photosensitizer loaded magnetic silica nanoparticles and their anti-tumor effects for targeting photodynamic therapy. Nanoscale Res Lett. 2009;4:400–8. doi: 10.1007/s11671-009-9254-5. [DOI] [PMC free article] [PubMed] [Google Scholar]
- 50.Liu F, Zhou X, Chen Z, Huang P, Wang X, Zhou Y. Preparation of purpurin-18 loaded magnetic nanocarriers in cottonseed oil for photodynamic therapy. Mater Lett. 2008;62:2844–7. [Google Scholar]
- 51.Tang L, Fan TM, Borst LB, Cheng J. Synthesis and biological response of size-specific, monodisperse drug-silica nanoconjugates. ACS Nano. 2012;6:3954–66. doi: 10.1021/nn300149c. [DOI] [PMC free article] [PubMed] [Google Scholar]
- 52.Park YI, Kim HM, Kim JH, Moon KC, Yoo B, Lee KT, et al. Theranostic probe based on lanthanide-doped nanoparticles for simultaneous in vivo dual-modal imaging and photodynamic therapy. Adv Mater. 2012;24:5755–61. doi: 10.1002/adma.201202433. [DOI] [PubMed] [Google Scholar]
- 53.Gao X, Cui Y, Levenson RM, Chung LWK, Nie S. In vivo cancer targeting and imaging with semiconductor quantum dots. Nat Biotechnol. 2004;22:969–76. doi: 10.1038/nbt994. [DOI] [PubMed] [Google Scholar]
- 54.Huang P, Bao L, Yang D, Gao G, Lin J, Li Z, et al. Protein-directed solution-phase green synthesis of BSA-conjugated MxSey (M= Ag, Cd, Pb, Cu) nanomaterials. Chem Asian J. 2011;6:1156–62. doi: 10.1002/asia.201000818. [DOI] [PubMed] [Google Scholar]
- 55.Tao H, Yang K, Ma Z, Wan J, Zhang Y, Kang Z, et al. In vivo NIR fluorescence imaging, biodistribution, and toxicology of photoluminescent carbon dots produced from carbon nanotubes and graphite. Small. 2011;8:281–90. doi: 10.1002/smll.201101706. [DOI] [PubMed] [Google Scholar]
- 56.Le Guével X, Hötzer B, Jung G, Schneider M. NIR-emitting fluorescent gold nanoclusters doped in silica nanoparticles. J Mater Chem. 2011;21:2974–81. [Google Scholar]
- 57.Xie J, Zheng Y, Ying JY. Protein-directed synthesis of highly fluorescent gold nanoclusters. J Am Chem Soc. 2009;131:888–9. doi: 10.1021/ja806804u. [DOI] [PubMed] [Google Scholar]
- 58.Yuan X, Luo Z, Zhang Q, Zhang X, Zheng Y, Lee JY, et al. Synthesis of highly fluorescent metal (Ag, Au, Pt, and Cu) nanoclusters by electrostatically induced reversible phase transfer. ACS Nano. 2011;5:8800–8. doi: 10.1021/nn202860s. [DOI] [PubMed] [Google Scholar]
- 59.Samanta A, Dhar BB, Devi RN. Ultrasmall gold cluster arrays encapsulated in silica nanospheres: Applications in fluorescence imaging and catalysis. J Phys Chem C. 2012;116:1748–54. [Google Scholar]
- 60.Luo T, Huang P, Gao G, Shen G, Fu S, Cui D, et al. Mesoporous silica-coated gold nanorods with embedded indocyanine green for dual mode X-ray CT and NIR fluorescence imaging. Opt Express. 2011;19:17030–9. doi: 10.1364/OE.19.017030. [DOI] [PubMed] [Google Scholar]
- 61.Johnsson B, Löfås S, Lindquist G. Immobilization of proteins to a carboxymethyldextran-modified gold surface for biospecific interaction analysis in surface plasmon resonance sensors. Anal Biochem. 1991;198:268–77. doi: 10.1016/0003-2697(91)90424-r. [DOI] [PubMed] [Google Scholar]
- 62.Zhu Z, Tang Z, Phillips JA, Yang R, Wang H, Tan W. Regulation of singlet oxygen generation using single-walled carbon nanotubes. J Am Chem Soc. 2008;130:10856–7. doi: 10.1021/ja802913f. [DOI] [PubMed] [Google Scholar]
- 63.Li B, Lin H, Chen D, Wang M, Xie S. Detection system for singlet oxygen luminescence in photodynamic therapy. Chin Optic Lett. 2010;8:86–8. [Google Scholar]
- 64.Lin H, Shen Y, Chen D, Lin L, Wilson BC, Li B, et al. Feasibility study on quantitative measurements of singlet oxygen generation using singlet oxygen sensor green. J Fluoresc. 2013;23:41–7. doi: 10.1007/s10895-012-1114-5. [DOI] [PubMed] [Google Scholar]
Associated Data
This section collects any data citations, data availability statements, or supplementary materials included in this article.


