

Abstract
Learning alters the responses of neurons in the neocortex, typically strengthening their encoding of behaviorally relevant stimuli. These enhancements are studied extensively in the auditory cortex by characterizing changes in firing rates and evoked potentials. However, synchronous activity is also important for the processing of stimuli, especially the relationship between gamma oscillations in the local field potential and spiking. We investigated whether tone/shock fear conditioning in rats, a task known to alter responses in auditory cortex, also modified the relationship between gamma and unit activity. A boost in gamma oscillations developed, especially at sites tuned near the tone, and strengthened across multiple conditioning sessions. Unit activity became increasingly phase-locked to gamma, with sites tuned near the tone developing enhanced phase-locking during the tone, whereas those tuned away maintained a tendency to decrease their phase-locking. Enhancements in the coordination of spiking between sites tuned near the tone developed within the first conditioning session and remained throughout the rest of training. Enhanced cross-covariances in unit activity were strongest for subjects that exhibited robust conditioned fear. These results illustrate that changes in sensory cortex during associative learning extend to the coordination of neurons encoding the relevant stimulus, with implications for how it is processed downstream.
Introduction
An ongoing goal of neuroscience has been to understand the neural substrates of acquired fear behavior. To produce robust fear learning, investigators have relied on associative training paradigms (for instance, classical conditioning) wherein a neutral conditioned stimulus (CS) is paired with an aversive unconditioned stimulus (US), such as presenting a tone CS shortly before a shock US. Animals rapidly develop preparatory and emotional responses to the tone, as if anticipating the shock. Supporting this behavior are neocortical regions that respond to the CS.
Although most attention has been directed to subcortical circuits in auditory fear conditioning (Maren, 2005; Weinberger, 2011), there is abundant evidence for the involvement of the auditory cortex. In particular, a confluence of findings indicates that auditory cortex participates in the acquisition, retention, and retrieval of specific fear memories for acoustic cues. During fear conditioning, activation of layer I GABAergic interneurons by the US inhibits parvalbumin interneurons, which is necessary for subsequent fear responding 24 h later (Letzkus et al., 2011). After conditioning, immediate posttraining lesions of the auditory cortex disrupt fear behavior (Boatman and Kim, 2006). Retrieval of remote fear memories depends on secondary auditory cortices (Sacco and Sacchetti, 2010). Fear conditioning also specifically enhances the responsiveness of auditory cortex neurons to the CS (Weinberger and Diamond, 1987), in particular shifting tuning toward or to this stimulus, a finding demonstrated in numerous species across multiple laboratories (Weinberger, 2004). Furthermore, such plasticity extends to human auditory cortex, as revealed by neuroimaging and MEG (Thiel et al., 2002; Bröckelmann et al., 2011; Miskovic and Keil, 2012).
The acquisition of both plasticity and memory for an acoustic CS is predicted by the strength of CS-induced gamma-band (40–120 Hz) activation in auditory cortex during fear conditioning (Headley and Weinberger, 2011). Although this relationship ceases after initial learning, gamma oscillations continue to occur in auditory cortex, but with an unclear role. It is likely these CS-induced gamma oscillations remain functionally relevant given the ongoing involvement of auditory cortex in the expression of fear memory and the well established linkage between attention and gamma synchronization in sensory cortices (Fries et al., 2001).
A possible function for CS-induced gamma after initial learning is the integration of CS-related information into the network of regions supporting fear behavior. Gamma oscillations regulate the efficacious propagation of neural activity between cortical and subcortical regions (Bauer et al., 2007). They are enhanced in auditory cortex to the target stimulus in a Go/No-Go task (Jeschke et al., 2008). In humans undergoing conditioning, gamma-band coherence increases between cortical sites activated by the CS and US (Miltner et al., 1999). Thus, continued gamma activation by the CS in auditory cortex may coordinate CS-driven spiking activity to vigorously drive downstream targets, leading to successful anticipatory behaviors.
This study addresses whether fear conditioning alters CS-induced gamma-band activation and its ability to entrain neural activity. To this end, we tracked unit activity, gamma activation, and their interaction throughout primary auditory cortex and across multiple fear-conditioning sessions.
Materials and Methods
For a more detailed treatment of some of the methods, refer to our previous paper (Headley and Weinberger, 2011).
Subjects.
Thirty-six male Sprague Dawley rats (Charles River) were used in this study. Two of the subjects were excluded because histological examination revealed damage to the auditory cortex caused by the microwire array. Subjects were housed individually on a 12 h light/dark cycle with ad libitum food and water throughout the experiment. Recording and conditioning sessions occurred during the light cycle. All surgical and experimental treatments were approved by the Institutional Animal Care and Use Committee for the University of California, Irvine.
Surgical procedures.
Anesthesia was induced and maintained with sodium pentobarbital (55 mg/kg, i.p.; Sigma-Aldrich), and secretions were reduced with atropine (0.1 mg/kg, i.m.; Med-Pharmex). Subjects were then placed in a stereotaxic frame (Kopf) with blunt ear bars. Body temperature was maintained throughout the surgery with a thermostatically controlled heating pad. Lidocaine (AstraZeneca Pharmaceuticals) was injected subcutaneously into the scalp, followed by a midline incision and retraction, exposing the frontal and parietal bones. After the periosteum was cleared and the skull dried, miniature stainless steel screws (#0-80; Small Parts) were inserted. A screw over the left cerebellum served as a ground electrode. Dental acrylic was applied around the skull screws to form a pedestal for placement of the electrode array connector. The right temporal muscle was resected, and screws were placed in the parietal bone around the planned site of the craniotomy. These screws served to anchor the electrode array to the skull. A craniotomy (∼3 × 2 mm) was made over the auditory cortex based on skull landmarks. Vascular landmarks and surface-evoked potentials helped localize primary auditory cortex. An array of microwires (50 μm tungsten with polyimide coating; California Fine Wire) consisting either of one row of four or two rows of eight were implanted in the auditory cortex to a depth of ∼800 μm. One of the wires cut shorter than the others rested on the surface of the cortex to serve as a reference when recording unit activity. The tonotopy and response properties of unit activity at the implant site were verified before closing the craniotomy. Gelfoam was applied to protect the exposed cortical surface, whereas dental acrylic enclosed the craniotomy and anchored the microwire array to the skull screws.
A wire sutured around the thoracic musculature either during or 5 d after array implantation served as an electrode for detecting the electrocardiogram (EKG). The electrode consisted of a stranded stainless steel wire with Teflon coating (catalog #793200; A-M Systems). A section of insulation was removed where the wire was immediately opposing the heart. An uninsulated loop of wire placed subcutaneously in the back served as a separate ground for the EKG. Both wires were soldered into a pin connector that was affixed to the skull pedestal. Metal loops (∼5 mm radius) were cemented rostrally and caudally to the pedestal; these were used to restrict head movements during recording sessions.
Experimental enclosure.
The experimental enclosure was a wire mesh alley (30.5 × 5.8 × 6.0 cm) tilted at ∼20°, such that the subject's head was above its body. The enclosure rested atop a weighted table inside an acoustic isolation chamber (Industrial Acoustics). Rats entered the enclosure through the base on their own volition, crawled to the top of the alley, and had their head restrained. Rubber bands attached to the corners of the enclosure were anchored to the metal loops on the rat's head cap, restricting head movements to an ∼15° arc. This practically eliminated all head movements apart from those tied to sporadic grooming and postural adjustment and helped maintain a state of wakefulness during recording.
Before surgery, rats received two ∼1 h acclimation sessions to the enclosure and stimuli used to probe receptive fields (RFs). An acclimation session was composed of two phases. For the first phase, there was ∼30 min of exposure to tone pips under illumination by the lights of the acoustic chamber. After that were ∼30 min in the dark without any acoustic stimuli. Head restraint was introduced 5–7 d after recovery from surgery during a final acclimation session delivered the day before the start of training. Rats acclimated to the head restraint within ∼10 min.
Acoustic calibration and stimuli.
Stimuli were delivered via an electromagnetic speaker [FF1; Tucker-Davis Technologies (TDT)] that was oriented parallel to the axis of the left ear canal at a distance of ∼15 cm. A frequency transfer function for the speaker was measured using a tone generator (RP2.1; TDT) and calibrated microphone (Brüel and Kjær). A programmable attenuator (PA5; TDT) equalized the speaker output across all tone frequencies.
Frequency RFs were obtained using pure tone pips (0.75–48 kHz, 50 dB SPL, 50 ms duration, 8 ms rise/fall time) delivered through the calibrated speaker setup (RP2.1, PA5, and FF1; TDT). Conditioned stimuli had the same properties as the tone pips, except their duration was 10 s.
Receptive field acquisition.
RFs were assessed at the beginning of each training session (Fig. 1B) with a battery of stimuli (pure tones and spectrotemporal ripples). Only RFs obtained using pure tones are presented in this study. The same cohort of stimuli was used for each session and across subjects.
Figure 1.

Diagram illustrating the design of the experiment. A, Each subject went through a sequence of acclimation and training phases. Most of these phases were composed of multiple daily sessions. Discrimination is listed as 1 d, because only the first discrimination session was used in this study. B, Within each session, we first acquired tuning curves from our recording sites, followed by either conditioning or discrimination training. C, Trials featuring the CS were the same for conditioning and discrimination. During discrimination, an unreinforced CS− was introduced that had a different frequency than the CS. D, Diagram illustrating electrode placement and types of pairs used in this study's analyses. Primary auditory cortex is bordered rostrally by the anterior auditory field and caudally by the posterodorsal belt field (Rutkowski et al., 2003). Sites from these secondary regions were excluded (illustrated as crossed out in red) from analysis based on the criteria outlined in Materials and Methods and their deviation from the low- to high-frequency tonotopy along the rostrocaudal axis in primary auditory cortex. The sites composing NEAR pairs were both within 1 octave of the CS frequency and within 1 octave of each other. FAR pairs were both tuned at least 1 octave away from the CS and were within 1 octave of each other. For cross-covariance analyses, filled neurons represent the population supplying the reference spike, whereas the open neurons denote the population supplying spikes from the other site. The LFP used to extract the 60 Hz signal for sorting the reference spikes came from the other electrode. Black cylinders are recording electrodes. E, Illustration of the training enclosure from two vantage points. The top view includes the speaker. Subjects' heads were restrained with elastic bands attached to loops in the head cap, which ensured a consistent posture and position relative to the speaker.
Twenty or thirty repetitions of each tone pip were delivered in a randomly intermixed fashion. The octave distance between pips was either ¼ or ⅛ of an octave. The context of RF acquisition was kept separate from that of conditioning by keeping the acoustic chamber lights illuminated during delivery of tone pips, while fear conditioning was conducted in the dark.
Training.
After RF acquisition, the chamber lights were turned off and the training session began. Subjects underwent daily sessions of tone/shock classical conditioning. During each trial, a 10 s tone was followed by a 1 s silent trace interval and then a 1 s shock (40 Hz, biphasic 8.3 ms pulses, constant current source; catalog #H13-15; Coulbourn Instruments). Shocks were administered through the EKG leads, and intensity was adjusted during the first conditioning session to the minimal possible level that elicited a brief reflexive body contraction, but never struggling or escape responses. Training sessions typically lasted 1.5 h. Twenty subjects received 10 training trials per session [8 min mean intertrial interval (ITI)], and 14 had 40 trials (2 min mean ITI). All training sessions were separated by at least 1 d, and almost all (∼98%) were performed on sequential days. Care was taken to keep the session times consistent across days for each subject. Only the first four conditioning sessions were analyzed, as they yielded the most data.
After the conditioning phase, subjects underwent discrimination training. This established that conditioned responding (CR) was associative and not driven by either pseudo-conditioning (increased arousal caused by repeated presentations of the US) or sensitization (repeated exposure to the CS) (Bouton, 2007). For discrimination, half of the trials were replaced by the presentation of an unreinforced CS− tone that was at a different frequency, at least one octave away from the CS.
Heart rate acquisition and analysis.
EKG signals were recorded with subcutaneous thoracic electrodes, amplified (10,000×), filtered (10–300 Hz; EX-1000, Dagan), digitized (610 Hz; RP2.1, TDT), and stored to disk. The peak voltages of individual heartbeats (R-waves) were threshold edge detected and time stamped. Beat times were converted to beats per minute and linearly interpolated at the sampling rate of the original EKG signal.
The CR on each trial was the percentage change in mean heart rate between a 4 s pre-CS period and the entire 10 s CS period. The cardiovascular system has a high degree of sensitivity to learned contingencies, which allowed us to use a relatively weak US (Winters et al., 2002). When animals are restrained during fear conditioning, as was the case in our preparation, the typical CR is a decrease in heart rate, referred to as bradycardia (Teyler, 1971; Fendt and Fanselow, 1999). If the heart rate is already low before CS delivery, then the CR magnitude may be reduced. To avoid this floor effect, analysis of heart rate was restricted to trials for which baseline heart rate was in the upper 50th percentile for that session.
Neural data acquisition.
Both unit activity and wideband field potentials were recorded after amplification (unity gain, LP16CH headstage, RA16 digitizer with 4- or 16-channel capacity; TDT). Local field potentials (LFPs) were obtained off-line from wideband signals that were digitally filtered with a 0.01–300 Hz second-order bandpass Butterworth filter using the MATLAB (The MathWorks) “butter” and “filtfilt” commands. LFPs were referenced to the ground screw in the calvaria. Movement artifacts were identified by visual and acoustic inspection, and all trials containing such artifacts were eliminated from further analysis (∼11% of trials). Subsequent analyses were performed only on recording sites that met several standard criteria for placement in primary auditory cortex: (1) displayed frequency-tuned evoked potentials (EPs) to auditory stimuli; (2) had an initially negative EP waveform; and (3) with an onset latency < 30 ms (Goldstein et al., 1970; Reale and Imig, 1980; Sally and Kelly, 1988).
Unit activity was digitally filtered on-line (Butterworth filter, 300–3,000 Hz second-order bandpass; RA16, TDT) and detected and sorted off-line. A window discriminator detected spikes with a negative peak exceeding −2.5 root mean square (RMS) followed within 0.6 ms by a positive peak >2.0 RMS. Movement and other artifacts were subtracted out by off-line referencing to an electrode that rested on the cortical surface. All reported unit activity is multiunit (MUA).
Analysis of frequency receptive fields.
The RF for the MUA at a recording site was determined by playing a randomly intermixed series of 50 ms tone pips. We calculated the average firing rate during an evoked response window, minus the firing rate for a 50 ms pretone window. The response window was separately determined for each electrode and kept constant across all days. The response window was calculated as the time when the mean firing rate to all tone pips across all recorded days exceeded 2 SDs of the 50 ms pretone spontaneous period. To ensure that all analyzed RFs were sufficiently above threshold, we required that each contained at least two adjacent frequencies whose response magnitude were minimally twice the mean SD of responses to all frequencies composing that RF.
Each recording site was assigned a best frequency (BF). The BF was the tone frequency that evoked the greatest response. Sites with a BF within 1 octave of the CS frequency were considered “NEAR” the CS, whereas those greater than 1 octave away were labeled “FAR.” A site's status as NEAR or FAR was established on the first training session and held fixed for analyses on all subsequent days.
Spectral analysis.
LFP spectrograms for each training trial were calculated using the Chronux package for MATLAB. Its theoretical basis (Thomson, 1982) and application (Bokil et al., 2010) have been described previously, so our discussion will be brief. The Chronux package performs spectral analysis using a multitaper technique for windowing a time series. Traditional spectral analysis relies on a single windowing function, which can result in a high degree of variance for spectral estimates and an uncontrolled bias in the estimation of particular frequency bands. To help alleviate these issues, a collection of windowing functions can be used that provide multiple estimates of spectral power and with each tailored for estimating spectral power with constant passband bandwidth. Chronux uses a collection of discrete prolate spheroidal functions (for this study, the time–bandwidth product equals 3, and the number of tapers equals 5) to calculate multiple estimates of spectral power for a particular time window and frequency band. The LFP trace was sampled with a succession of 200 ms windows, each overlapping by 100 ms. When calculating the strength of gamma elicited by the CSs, spectrograms were normalized. The power in each bin was z-score transformed to the mean and SD of the 4 s baseline period preceding trial onset.
The relationship between unit activity and gamma oscillations was determined by calculating the corresponding instantaneous phase and amplitude of gamma at the time of each spike. MUA and the corresponding LFP were taken from separate sites with BFs within 1 octave of each other. Both sites were either within 1 octave of the CS frequency or >1 octave away (see Fig. 1D). To estimate phase and amplitude, the LFP was bandpass filtered (5 dB cutoffs at 59 and 61 Hz) to extract a narrow band signal around 60 Hz (see Fig. 4A, bottom, for example), which past studies have shown to be particularly sensitive to phase-locking (Womelsdorf et al., 2007). A Hilbert transform was then applied to the narrow band signal to get the analytic form of the signal. Amplitude was the absolute value of this signal, whereas phase was its angle. Spikes could now be binned depending on their time of occurrence during the trial, along with the corresponding phase and amplitude of gamma. For a set of N spikes, we estimated the dependence that spiking had on gamma phase by calculating the magnitude of the mean unit vector for the phases, θ, that occurred during each spike:
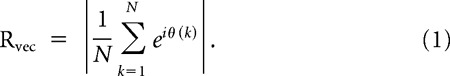 |
When we wanted to determine the resultant vector of a phase histogram, H, with bins ph (10 bins, −π to π in steps of π/10), a similar equation was used:
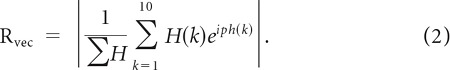 |
Figure 4.

MUA exhibited phase-locking to the oscillatory components of the LFP. A, An example recording of a single trial demonstrates electrophysiological events of interest. The topmost row charts the delivery of the tone CS and shock US. Below that is the LFP spectrogram, which has a robust activation in the gamma band during CS presentation. The corresponding LFP trace below exhibits the loss of low-frequency power and boost in the higher-frequency bands. Corresponding MUA activity is slightly increased during the tone delivery period. At the bottom, 500 ms epochs of MUA, unfiltered LFP, and the 60 Hz narrow band signal are overlaid together. Spiking is clearly phase-locked to the negative peak of the 60 Hz signal. The 60 Hz signal appears to track rapid deflections in the wideband LFP. Whereas this example compares unit activity and the LFP from the same electrode, all analyses were performed on data derived from different electrodes. B, We compared the percentage deviation from the mean unit activity across different frequency bands of the LFP and between NEAR and FAR sites. Red outlines denote phase/frequency bins that were significantly different between the NEAR and FAR sites (p < 0.05, Bonferroni corrected). C, Distribution of mean phase during the 4 s pre-CS period across all sites and all conditioning sessions. The dashed gray line shows the corresponding waveform in the 60 Hz signal across phase. Units typically fired near the end of the descending phase of the oscillation. Sites that lacked significant phase-locking were more dispersed in their preferred phase, but their distribution still peaked near the trough.
Gamma-stratified cross-covariance analyses.
Unit cross-covariance functions (CCs) were calculated between recording sites conditioned on the phase and amplitude of gamma (60 Hz band). Spikes from the reference site were sorted by the phase, ph (−π to π, 10 bins), and amplitude, a (0–33, 33–66, 66–100 percentiles), of gamma at the other corresponding site. Spikes from the other site were not sorted with respect to gamma. Since the CC can be distorted by spike count differences, the binning allowed us to keep the number of spikes across gamma conditions relatively constant. Spike counts were relatively evenly distributed across the gamma phase bins (Fig. 4B, 60 Hz band), and binning amplitudes by percentile ensured that equal numbers of spikes were assigned to each amplitude level. Each spike train was binned into 2.5 ms steps for the reference, δr, and the other corresponding site, δc, with each bin indicating the number of spikes. The CC was calculated for a subset of spikes from the reference train that corresponded to a particular phase and amplitude bin of gamma at the other site, and all spikes from the other site:
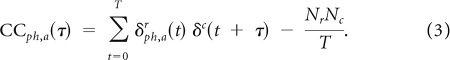 |
The total number of time bins per trial was T, and Nr and Nc are the number of spikes in each respective train. τ denotes the time lag in 2.5 ms steps. With 10 phase bins and 3 amplitude bins, we created 30 different CCs for each pair (see Fig. 6A for examples). Adding all of these CCs together would give the conventional CC function. Each of the 30 CCs was divided by the corresponding number of spikes from the reference site. To reduce the influence of periodicities caused by the autocorrelations present in the spiking due to phase-locking with gamma, gamma-stratified auto-covariance functions were calculated for both sites (ACrph,a and ACCph,a) using the same method as above. These were then deconvolved from the CCph,a in the frequency domain by taking the fast Fourier transform of each and dividing the following:
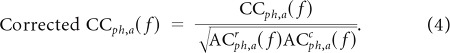 |
An inverse fast Fourier transform then converted the corrected CCph,a back into the time domain (Brillinger et al., 1976). Finally, we tested whether the nonstationarity of firing caused by the CS could produce our CCs by calculating shift-predictor versions of each CC and found these did not exhibit any apparent peaks.
Figure 6.
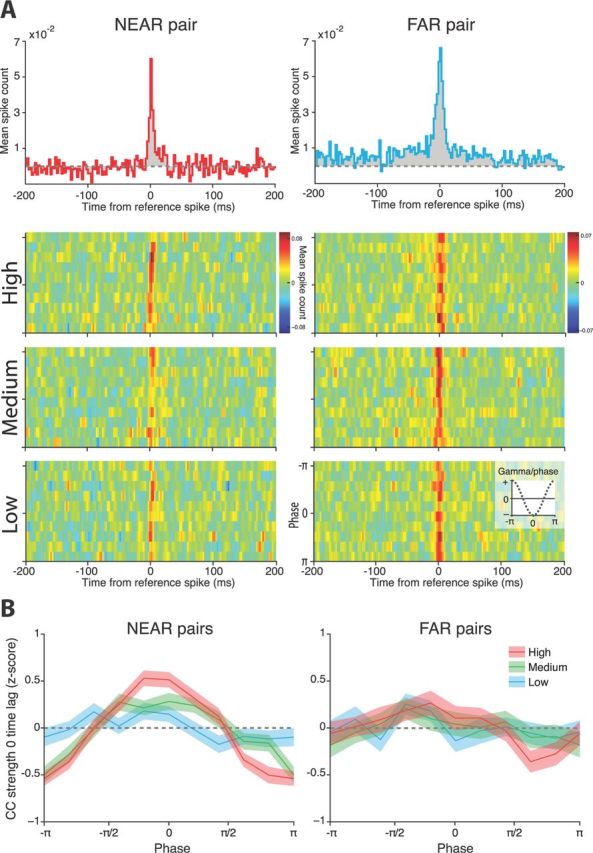
Gamma affected the CC between pairs of sites. A, Example CCs from a NEAR and FAR pair. The topmost graphs show the CC without accounting for the phase and amplitude of gamma. CC strength at the zero time lag was similar between sites. Below are the corresponding gamma-stratified CCs for the same pairs. Low, Medium, and High indicate the percentile amplitude of gamma used for constructing the CCs, whereas the y-axis of each graph is the phase of gamma. Despite their similar overall CCs, the NEAR and FAR pairs differ in their gamma-stratified CCs, with the CC strength in the NEAR pair varying with gamma phase and amplitude. B, We compared the shape of the relationship between CC strength and gamma between all NEAR and FAR pairs during the CS. NEAR sites exhibited greater modulation of their CC by gamma than did FAR sites. Note that −π and π are equivalent. Shaded regions denote ± SEM.
Statistical analyses.
Factorial ANOVAs or an ANCOVA tested the statistical significance of experimental effects. The Tukey–Kramer method was used in some cases as a post hoc test to determine the basis for group differences. Comparisons between the means of two samples were done with two-sample t tests. When multiple t tests are conducted, a Bonferroni's correction was used to control for type 1 errors. Linear correlations between two variables were measured with the Pearson's correlation coefficient or a general linear model when performing multiple regressions.
Results
Experimental overview
Thirty-four Sprague Dawley rats were trained on an acoustic fear-conditioning task with heart rate as the behavioral measure. Subjects were gently head fixed throughout training and recording, allowing for heart rate stability and consistent delivery of acoustic stimuli to the ear. Subjects typically received four daily conditioning sessions in total (range, 2–7; mode, 4). We only analyzed the first four sessions, because only 7 of the 34 subjects received subsequent training sessions. For each session, a 10 s tone CS was followed by a 1 s shock US, with a 1 s silent trace interval between the offset of the tone and the onset of the shock (Fig. 1C). Subjects consistently received either 10 or 40 trials per session. After at least four conditioning sessions, subjects then received discrimination training to control for nonassociative effects (Fig. 1A). During discrimination, half the trials were replaced with a 10 s unreinforced tone (CS−) at a different frequency than the CS (Fig. 1C).
Recordings of unit activity and LFPs were obtained from 168 recording sites. Some sites exhibited both MUA and single units; however, we pooled these together to increase the power of our phase-locking and cross-correlation analyses (Fisher, 1993; Bedenbaugh and Gerstein, 1997). Recording sites were sorted into two groups by how distant their best frequency was from the CS. Sites with a BF within 1 octave of the CS were considered NEAR (n = 93), whereas those >1 octave away were FAR (n = 75). Recordings from the discrimination phase were not analyzed because of an insufficient numbers of trials. Subjects receiving 40 training trials per session had more training trials overall than those that only had 10 trials per session and thus might drive the learning-induced changes we observed throughout this study. This did not seem to be the case, because a reanalysis constrained to subjects that received 10 trials per session exhibited the same pattern of significant learning-induced changes in gamma power, phase-locking, and modulation of unit cross-covariance.
Twenty-one of the 34 subjects in this study appeared in a prior publication, but addressing a different research question (Headley and Weinberger, 2011).
Acquisition of conditioned fear
Subjects underwent tone cued trace fear conditioning and developed autonomic responses to the CS reflecting conditioned emotional fear. The conditioned response (CR) was a slowing of heart rate, known as bradycardia, which exhibited a rapid onset, peaking within seconds of CS delivery, and persisted until the occurrence of the US (Fig. 2A). Its mean strength throughout the duration of the CS served as an index of conditioned fear. To identify whether learning occurred, we ran an ANOVA with CR grouped by session (1, 2, 3, 4), followed by a series of posttests. The daily mean CR reached asymptote by the second conditioning session. There was a significant effect of session (ANOVA; F(3,124) = 4.27; p = 0.007), and post hoc testing showed that session 1 had significantly reduced CRs compared with sessions 2–4 (Tukey–Kramer method, p < 0.05), whereas sessions 2–4 did not differ from each other (Fig. 2B). This fast acquisition of conditioned fear was expected (Fig. 2D), given the simplicity of the contingency and the repeated trials within each session. Even within the first session, CR strength increased across trials (Pearson's correlation; n = 220; r = 0.197; p = 0.003) to the level present during subsequent sessions (two-sample t test; t(634) = −0.5; p = 0.615). Further underscoring the complete acquisition within the first training session, subsequent sessions lacked any learning curve (Pearson's correlation; n = 620; r = 0.043; p = 0.287).
Figure 2.

Across training sessions, subjects acquired conditioned fear to the CS. A, Bradycardia, a slowing of the heart rate, served as our index of conditioned fear. Bradycardia was weakest on the first conditioning day and had reached asymptote by the second. Inset, Heart rate was measured by taking the times between beats and converting them to beats per minute. B, The mean change in heart rate during the entire 10 s of the tone served as our index of CR strength. Session 1 CRs were significantly weaker than those for sessions 2–4. CR strength was not significantly different between sessions 2, 3, and 4. C, After the conditioning phase, subjects underwent discrimination training. The first session of discrimination indicates the CR's specificity for the CS. Responding to the CS−, which was not paired with a shock, was significantly weaker than that for the CS. D, For each session, trials were divided into 10 blocks, and the mean CR was measured for each block. CR strength increased across the first session but remained at a plateau across each of the subsequent sessions. Error bars are mean ± SEM.
A robust response to the CS, however, does not necessarily indicate an association between the CS and the US. Responding to the CS could result from sensitization to the CS caused by its repeated presentation, or pseudo-conditioning, whereby the shock arouses the subject and heightens responsiveness to any stimulus. To test these possibilities, the same subjects underwent discrimination training the day after their final conditioning session. For discrimination, half the trials were replaced with an unreinforced tone of a different frequency, CS−. If the CR was produced by the mere repeated presentation of a tone or increased arousal attributable to the shock, then an equivalent CR should also develop to the CS−. This was not the case (Fig. 2C): the CS− evoked significantly less bradycardia than the CS (two-sample t test; t(58) = 2.41; p = 0.019). Thus, responding to the CS depended on an association between the tone and shock.
Enhancement of gamma-band activation
The auditory cortex is part of a network of brain regions that mediate fear behavior for acoustic stimuli (Gonzalez-Lima and Scheich, 1986; Maren, 2005). Its participation in this network requires it, at the very least, to convey CS information to its downstream targets. The successful transmission of that information depends on spiking activity in the auditory cortex effectively driving postsynaptic depolarizations. One way to achieve this is for spiking across a population to phase-lock to a common rhythm evoked by the CS. The relative timing of spikes influences the efficacy of signal propagation between brain regions (Salinas and Sejnowski, 2000) and consequently the integration of CS information from the auditory cortex into a broader network. To be most effective, spikes should synchronize on time scales that are conducive for synaptic integration, which is <20 ms. Since spiking depends on membrane depolarization and LFPs reflect the fluctuations in membrane potential across a local population of neurons, changes in the gamma frequency band, from 40 to 120 Hz, would be the most apparent indicator of neural synchrony on the time scale of synaptic integration (Okun et al., 2010).
We investigated whether gamma-band activation at sites in auditory cortex change across multiple sessions of fear conditioning and whether these changes depend on how closely tuned a site is for the CS. LFP spectrograms were compared between conditioning sessions and at different tuning distances from the CS. We first analyzed the dependency of induced (>100 ms after CS onset) gamma-band activation (40–120 Hz) on tuning and training session across the entire tone period. A two-factor ANOVA with training session (1, 2, 3, 4) and distance from the CS (NEAR, FAR) had significant main effects for both training session (F(3,618) = 7.53; p < 0.001) and CS distance (F(1,618) = 34.76; p < 0.001) and no interaction effect between the two (F(3,618) = 0.42; p = 0.74).
These effects were not explained by differences in the baseline gamma power between NEAR or FAR sites or across conditioning sessions. A similar analysis on the untransformed gamma power for the 4 s before CS onset did not identify a significant main effect of session (F(1,618) = 0.51; p = 0.67) or interaction with tuning (F(3,618) = 0.03; p = 0.99).
Direct examination of the LFP spectrograms revealed that only a portion of the gamma frequency band and time window after the CS drove the effects we observed (Fig. 3A). Spectrograms were computed for each trial and electrode, and the power in each frequency band was normalized with a z-score transform using the 4 s before the CS as the baseline. Overall, the CS elicited a broadband increase in spectral power immediately after tone onset that reflected the evoked potential, followed by a decrease in power for frequency bands below 40 Hz and an increase in power for frequencies between 40 and 120 Hz. The strongest activation appeared around 60 Hz and during the first 4 s of the CS. This was consistent across training sessions and for both NEAR and FAR recording sites. However, there did seem to be an increase in gamma-band activation across sessions, along with greater gamma activation at NEAR sites as opposed to FAR sites.
Figure 3.

LFP spectrograms revealed increased gamma-band power with training. A, The mean LFP spectrograms across all NEAR or FAR sites are shown for each of the four conditioning sessions. The frequency axis is in hertz. The spectrogram for each site was z-score transformed relative to the 4 s baseline before averaging. B, A general linear model was applied to each time/frequency bin to evaluate the effect of tuning and training session as predictors of CS-driven changes in spectral power. The chart on the left shows the β coefficients of tuning for each time/frequency bin, whereas the chart on the right is the β coefficients for training session. Colors correspond to sign and magnitude of the β coefficients, with hot colors denoting a positive relationship and cool colors a negative one. White denotes time/frequency bins that were not predicted by both tuning and training session. The black traces in A and B illustrate the period when the tone was on.
To characterize these dependencies, we used a general linear model to estimate the effect of tuning distance from the CS and training session on spectral power in each time/frequency bin of the spectrogram (Fig. 3B). A permutation test (500 repetitions) determined the significance of the β-coefficients returned by the model. For each bin, we tested the conjunctive null hypothesis (Nichols et al., 2005) that neither octave distance nor training session affected spectral power. To be considered significant, a bin had to have p values <0.01 for both octave distance and training session. This analysis revealed that only the gamma-band increased its spectral power across multiple fear-conditioning sessions and the more closely sites were tuned to the CS.
Given that the LFP reflects postsynaptic membrane potentials, activation in the gamma-band corresponds to subthreshold oscillations that could entrain spiking. Thus, we would expect that increased gamma strength would enhance phase-locking of spikes to CS-induced gamma.
Enhancement of unit phase-locking to gamma
Assuming that the gamma signal detected in the LFP reflects oscillations in the membrane potential of a local population of neurons, then CS-driven increases in gamma power should affect the periodicity of firing. Neurons will tend to spike during the phases of gamma that correspond with membrane depolarization. Consequently, the response to the CS should extend to the phase-locking of spiking to gamma oscillations. Neurons that phase-lock to gamma can exert an outsized influence on their downstream targets (Fries, 2005; Womelsdorf et al., 2007). Previous studies have singled out the 60 Hz band as being the most susceptible to phase-locking and synchrony phenomena (Womelsdorf et al., 2007), so we chose to focus on this band for our study.
To characterize the relationship between unit activity and gamma phase, MUA was binned (10 phase bins between −π and π) according to the phase of gamma from a different electrode (Fig. 4A). Each pair was composed of sites that were either both tuned near (n = 126) or far (n = 64) from the CS. The basal relationship between unit activity and gamma was characterized by comparing the phase-locking of NEAR and FAR units in the first session during the 4 s periods before CS delivery. We quantified the phase dependence of their spiking across a range of frequencies that are present in the LFP. Both sets of sites showed comparable degrees of phase-locking across the entire frequency range, with frequencies below gamma, such as theta and alpha, exerting the greatest modulation of spiking (Fig. 4B). Unit activity had a modest dependence on gamma phase. For each pair, we measured the peak in the magnitude of the percentage change from the mean spike count across the phases of gamma (60 Hz band). The activity of both NEAR and FAR units depended on gamma phase, with the distribution of peaks for NEAR units having a mean of 16.1% (95% CI, 5–38.4%) and FAR units of 18.7% (95% CI, 4.3–42.5%), and no significant difference between the two (two-sample t test; t(188) = −1.64; p = 0.102). The preferred phase was during the descending portion of the gamma oscillation (Fig. 4C). The Rayleigh Test for unimodality (Fisher, 1993) allowed us to assess the significance of phase-locking. Across all conditioning sessions, a slight majority of pairs, 55.2%, exhibited significant modulation of spiking by gamma (p < 0.05) before CS delivery, and even those sites that did not exhibited a similar dependency on gamma phase when pooled together (Fig. 4C). For completeness, we included all sites in the subsequent analyses. Both the magnitude and direction of phase-locking we observed agree with previous reports (Chrobak and Buzsáki, 1998; Montemurro et al., 2008; Vinck et al., 2010). Importantly, the spontaneous firing rate, which can affect estimates of phase-locking, did not show a significant dependence on training session (F(3,616) = 0.29; p = 0.83).
We next determined whether the effect of CS presentation on phase-locking changed across conditioning sessions and with a site's tuning distance from the CS. To quantify the effect of the CS on the degree of phase-locking, we measured the change in the resultant vector of the spike-triggered phase histogram during delivery of the tone compared with the spontaneous activity period before CS delivery (Fig. 5A). The resultant vector is a convenient measure of phase dependence, with a value of 1 indicating that spiking only occurred during a particular phase of gamma, whereas values approaching 0 indicate less dependence on any one particular phase. In general, a gain in phase-locking will show a positive change, whereas a decrease results in a negative change. To ensure that the changes in phase-locking we observed to CS presentation were not driven by differences in the baseline level of phase-locking across sessions, we ran a two-factor ANOVA on the baseline phase-locking before CS delivery. The factors were training session (1, 2, 3, 4) and tuning (NEAR, FAR). We did not find a significant main effect for either session (F(3,726) = 1.74; p = 0.16) or tuning (F(1,726) = 2.56; p = 0.11).
Figure 5.

CS presentation altered phase-locking to gamma. A, Three example sites demonstrate what an increase, no change, and decrease in phase-locking resembled. Plotted is the probability of a particular phase given that a spike occurred. Phase corresponds to the phase of the 60 Hz band in gamma. The dashed gray line shows the corresponding waveform of the 60 Hz narrowband signal. B, Both NEAR and FAR sites changed their phase-locking during the tone CS. During the first session both NEAR and FAR sites decreased their phase-locking during the CS. Across subsequent training sessions, NEAR sites developed a tendency to enhance their phase-locking during the tone, whereas FAR sites retained their decrease. Error bars are mean ± SEM.
The change in phase-locking to gamma depended on both training session and tuning (Fig. 5B). A two-factor ANOVA was run with training session (1, 2, 3, 4) and tuning (NEAR, FAR). There was a significant main effect of training session (F(3,726) = 6.75; p < 0.001) and tuning (F(1,726) = 16.74; p < 0.001), but not a significant interaction between the two factors (F(3,726) = 0.63; p = 0.6). The main effect of session was driven by a trend across sessions toward increased phase-locking during the CS, and the main effect of tuning stemmed from increased phase-locking to the CS for NEAR sites. To capture these trends, we performed an ANCOVA, which explicitly models the effect of a grouping factor on the linear relationship between two variables. In our case, the grouping factor was tuning (NEAR, FAR), whereas the two variables were training session and CS-induced change in phase-locking. The ANCOVA recapitulated the results of the ANOVA, with a significant effect for tuning (F(1,730) = 16.4; p < 0.001) and training session (F(1,730) = 22.1; p < 0.001) and no interaction between the two (F(1,730) = 1.9; p = 0.17). The absence of a significant interaction between session and tuning should not be interpreted as a lack of any qualitative difference between the NEAR or FAR pairs. Although both NEAR and FAR sites tended toward decreased phase-locking to the CS during the first session, by the final session NEAR sites enhanced their phase-locking during the CS (one-sample t test; t(113) = 2.6; p = 0.012) whereas the FAR sites did not (t(61) = −1.6; p = 0.12).
CS-induced changes in phase-locking with session and distance from the CS echoes the previous finding for gamma-band activation. Nevertheless, phase-locking to gamma exhibited qualitative differences between NEAR and FAR pairs; across sessions, NEAR pairs developed an increase in phase-locking during the CS whereas FAR pairs did not.
Gamma modulation of coordinated unit activity
It is widely held that the functional basis for behavior emerges from neurons firing in concert. Previous experimental and modeling studies have found that both the phase and power of gamma oscillations modulate the strength of correlated firing between units (Womelsdorf et al., 2007; Buehlmann and Deco, 2010). Based on those findings, the enhanced phase-locking we observed for sites tuned near the CS should increase the coordination of their spiking activity. To address this directly, we analyzed the modulation of covariation in unit activity between sites by the phase and amplitude of gamma. As with the previous analyses, we examined the effects of conditioning session and tuning.
The zero time lag in the CC between two units provides a measure of their coincident firing. Pairs of sites were chosen as illustrated in Figure 1D. To evaluate the effect of gamma, we sorted the spikes from a reference unit site based on the phase and amplitude of gamma at the site containing the other unit and calculated their CC for each gamma phase/amplitude combination. Put another way, we determined whether coincident spiking at sites A and B depended on the gamma oscillations at B. Figure 6A displays examples of phase-/amp-stratified CCs for a NEAR and FAR pair. Although the two sites had very similar overall CCs, their gamma-stratified CCs tell a different story, with the NEAR pair exhibiting a greater dependence on the phase and amplitude of gamma.
We found that both the phase and amplitude of gamma modulated the degree of coincident firing during the CS (Fig. 6B). Pairs across all four sessions were pooled together for this analysis by a three-factor ANOVA with factors pair (NEAR, FAR), gamma power (LOW, MED, HIGH), and phase (10 bins from −π to π). For each pair during each session, the set of coincident firing values was z-score transformed to remove differences between different pairs in the absolute level and variability of coincident firing that was unrelated to their dependence on gamma power and phase (an analysis on the untransformed data returned the same significant effects). Because of this transform, there could only be significant main effects for phase and amplitude, and only significant interaction effects that included either of those factors. There was a significant main effect of phase (F(9,21900) = 83.76; p < 0.001) and amplitude (F(2,21900) = 7.69; p < 0.001). Only the interaction between phase and amplitude was significant (F(18,21900) = 11.77; p < 0.001). The pair by phase interaction approached significance (F(27,21900) = 1.44; p = 0.064).
Given that the phase-locking of unit activity to gamma changed with training and depended on distance from the CS, it should also be the case that gamma modulation of coincident firing was similarly affected. To address this question, we calculated the resultant vector of their coincident firing (0 ms time lag) across gamma phase during HIGH amplitude gamma, when both NEAR and FAR sites exhibited their strongest modulation (Fig. 7A). This calculation was applied separately to data obtained during the pre-CS and CS periods, allowing us to detect any differences in degree of modulation between NEAR and FAR sites that was unrelated to CS delivery. A three-factor ANOVA was run on these modulation values with the factors pair (NEAR, FAR), period (pre-CS, CS), and session (1, 2, 3, 4). There was a significant main effect for pair (F(1,1452) = 21.42; p < 0.001) along with an interaction effect between pair and period (F(1,1452) = 8.58; p = 0.003). To clarify this interaction, the NEAR and FAR pairs were split into separate two-factor ANOVAs with period (pre-CS, CS) and session (1, 2, 3, 4) factors. NEAR pairs had a significant effect for period (F(1,952) = 15.54; p < 0.001), driven by an increase in their modulation by gamma during the CS. On the other hand, FAR pairs did not exhibit any significant effects (all p > 0.46). Thus, sites tuned near the CS showed enhanced dependence on gamma during CS delivery.
Figure 7.
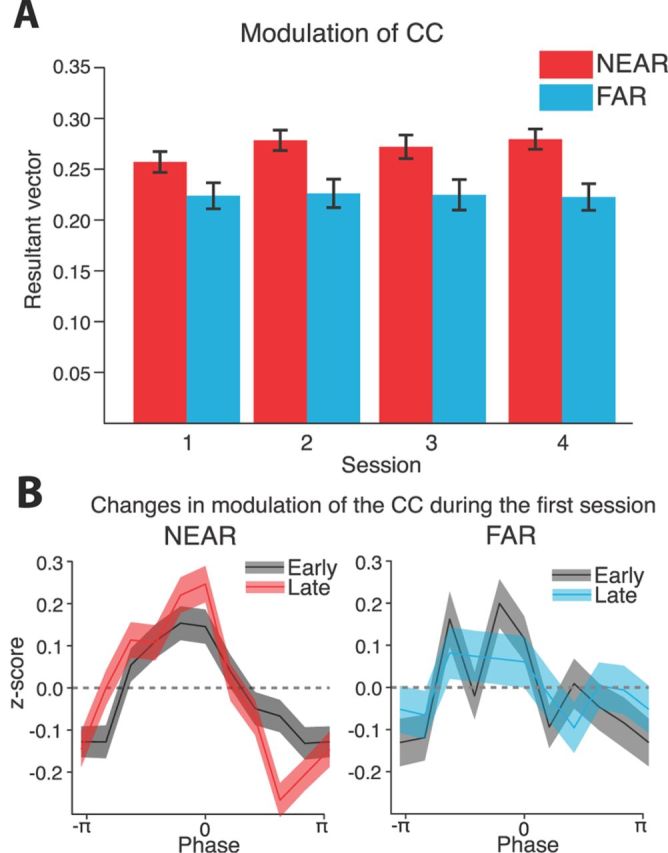
Modulation of the CC by gamma depended on distance from the CS and training. A, To measure the degree of modulation, we calculated the resultant vector of the CC strength across gamma phase during high-amplitude gamma. We have plotted the values during the CS period. On average, NEAR pairs exhibited greater gamma modulation of their CC than FAR pairs. B, Comparing the early and late conditioning trials of session 1 showed that NEAR sites increased the depth of their modulation within the first session, whereas FAR sites did not. Error bars and shaded areas are mean ± SEM.
The lack of an effect for training session on gamma modulation of coincident firing was surprising, especially given that both gamma power and the phase-locking of unit activity increased across training sessions. However, it seemed that on the first session of training NEAR pairs exhibited less gamma modulation of their CC than on subsequent sessions (Fig. 7A). Given that the subjects reached asymptotic behavioral performance within the first session, it is possible that gamma modulation of coincident activity developed within that first training session. A session-by-session analysis might not detect such rapid changes.
To explore whether gamma modulation of covariance in firing changed within the first session, we compared the mean gamma modulation during the CS on trials for the first and last ∼16 min of the session (2 trials for the 10-trial group and 8 trials for the 40-trial group). A three-factor ANOVA was run on session period (EARLY, LATE), tuning (NEAR, FAR), and gamma phase (10 bins from −π to π), with degree of coincident firing being the response variable. To capture just the shape of the relationship between covariance and gamma, we z-score transformed each curve to eliminate between electrode differences in offset and variance. Furthermore, to provide the best chance for FAR pairs to exhibit their modulation by gamma, only the phase modulation derived during high-amplitude gamma was used. However, a similar pattern of significant effects was obtained when we omitted the z-score transform or included all gamma amplitude bins.
In the first training session, coincident firing depended on both the phase of gamma, session period, and tuning (Fig. 7B). There was a significant three-way interaction effect between pair, period, and phase (F(9,14140) = 1.97; p = 0.038). To parse out this effect, separate two-factor ANOVAs (period and gamma phase) were run on the NEAR and FAR pairs. For the NEAR pairs, there was a significant interaction between period and phase (F(9,10840) = 2.76; p = 0.003), driven by increased phase modulation in the late trials. However, for the FAR pairs there was only a significant main effect of phase (F(9,3300) = 3.60; p < 0.001), indicating that there was modulation of coincident firing by gamma phase, but it did not exhibit a significant difference between early and late training trials.
Altogether, these findings indicate that sites tuned near the CS enhance the coordination of their spiking activity by gamma within the first session, whereas those tuned away do not. This difference is also long-lasting, since it persisted across subsequent conditioning sessions.
Behavioral dependence on pair activity
We have uncovered conditioning-induced changes in gamma-band activation, phase-locking, and modulation of coincident firing. Changes in these phenomena potentially support the execution of anticipatory behaviors, by enhancing the coincident firing of neurons tuned near the CS. A direct prediction from this would be that the strength of the CC between those units predicts behavioral performance. To address this, we measured the correlation between the peak of the mean CC function between units tuned near the CS with performance on session 4 (Fig. 8), when both CR behavior and changes in the physiology were maximal (statistically significant results were also obtained pooling across sessions 2–4). To facilitate between subject comparisons, each subject's CC function was z-score transformed with respect to the time lags >100 ms away from the reference spike. Subjects with a stronger mean CC tended to have better performance (Pearson's correlation; r = 0.58; p = 0.02). Notably, the two subjects with the strongest CRs also exhibited a robust oscillatory temporal structure in their CC on the time scale of gamma-band frequencies (<20 ms).
Figure 8.

Mean CC strength at NEAR sites was related to the strength of responding to the tone. The two subjects that exhibited the best performance (red and orange) also showed gamma-band periodicities in their CCs. On the other hand, the worst-performing subject (blue) had the second-weakest CC strength. The two worst-performing subjects (blue and green) lacked any apparent temporal structure in their CCs that suggested gamma modulation. The red line is the least-squares linear regression line.
Discussion
Stimuli associated with aversive events exert a profound influence on behavior, and neocortical sites participate in such learning. Abundant evidence indicates that synchronization between cortical neurons undergirds cortical processing. Determining how these synchronization processes change with fear learning is essential, both for a fuller picture of the neurobiology of fear and other learning, and cortical function in general.
Gamma-band activation changes with fear learning
Gamma oscillations have received little attention in the fear-conditioning literature, but they closely correspond with a phenomenon that has, EEG desynchronization, the hallmark signature of cortical arousal (Moruzzi and Magoun, 1949; Beck et al., 1958). During aversive conditioning, desynchronization develops as an electroencephalographic conditioned response when a CS elicits fear (Beck et al., 1958; Gluck et al., 1966). Desynchronization is typified by a decrease in power for low-frequency components of the LFP, along with increased power for the high-frequency components, especially gamma (Metherate et al., 1992; Harris and Thiele, 2011).
We observed changes in the LFP in agreement with increased desynchronization to the CS after fear conditioning. The spectral composition of the LFP during the CS changed with training. Power in the gamma-band tended to increase, whereas lower-frequency bands decreased. These changes were greatest at sites tuned near the CS and increased across daily conditioning sessions. Since the LFP reflects shared membrane potential oscillations (Okun et al., 2010), an increase in gamma power would be expected to show enhanced entrainment of spiking, although our findings did not fully bear this out (discussed below).
Particular oscillatory modes, such as gamma, operate on time scales that are conducive to synaptic integration (Volgushev et al., 1998; Salinas and Sejnowski, 2000). Furthermore, they can occur without any change in mean firing rate. Instead, a common oscillation entrains an ensemble of neurons, each of which has a low firing rate but when synchronized are able to drive downstream targets effectively. This is a more metabolically efficient solution to neural communication (Levy and Baxter, 1996). It also allows neurons to multiplex their signaling depending on the relative phase of their gamma oscillations with that of downstream targets (Fries, 2005).
Spike phase-locking to gamma changes with fear learning
We assessed the degree of phase-locking between MUA and gamma oscillations for NEAR and FAR sites. In agreement with the increase in gamma power, phase-locking during the CS was enhanced with training and greatest for NEAR sites. Thus, it would seem that an increase in gamma power begets increased synchrony. However, there were two complications to this picture. First, during the first session both NEAR and FAR sites exhibited decreased phase-locking during the CS, despite an increase in gamma power. Second, FAR sites retained their drop in phase-locking across the subsequent training sessions, albeit less so. These results imply a dissociation between gamma power and phase-locking. Despite this, the specificity of increased phase-locking at NEAR sites during the final session suggests that the subpopulation of neurons representing the CS will have an outsized influence on downstream targets (Kuhn et al., 2002), especially over the sites tuned away from the CS that tended toward desynchronization.
The lack of a one-to-one correspondence between gamma power and the entrainment of unit activity may stem from the heterogeneous basis of gamma oscillations. A likely contributor is the nature of extracellular recording itself. The low-frequency components of the LFP (<100 Hz) arise from a larger area of tissue than the unit activity detected on the same electrode. Resolving this problem requires the isolation of local generators (Kajikawa and Schroeder, 2011). Another confound is that multiple cell types compose MUA, and each exhibit a variety of sensitivities to the stimulus and local oscillations (Otte et al., 2010; Rothschild et al., 2010). Given that pyramidal cells are the most easily recorded neuronal subtype in the cortex and typically only fire every 5–10 cycles of the gamma oscillation under controlled conditions in vitro (Burchell et al., 1998; Fisahn et al., 1998), those that are entrained to gamma may be easily masked by spontaneous and stimulus-evoked tonic activity.
Further, cortical gamma oscillations are not monolithic. Distinct afferents likely contribute to their generation. Their differential engagement across training could lead to the dissociation between gamma power and unit phase-locking, especially between initial acquisition and later retrieval. The nucleus basalis (NB) sends cholinergic projections to the auditory cortex. Stimulation of the NB generates auditory cortical gamma oscillations, resulting from a decrease in the K+-mediated afterhyperpolarization potential (Metherate et al., 1992; Klink and Alonso, 1997). Acetylcholine levels in auditory cortex increase across days with acquisition of an association between a noise burst and food delivery (Butt et al., 2009). This shifting of the neurochemical environment should enhance the strength of gamma oscillations and potentially their entrainment of spiking. Alternatively, stimulation of the thalamic reticular nucleus or posterior intralaminar nucleus induces gamma oscillations in auditory cortex (Barth and MacDonald, 1996; MacDonald et al., 1998), but their exact mechanism of action is unclear (but see Steriade et al., 1996; Sukov and Barth, 2001).
Afferents induce and modulate gamma by their action on local cortical circuits (Whittington et al., 2000). Extracellularly recorded gamma reflects the interplay between subpopulations of excitatory and inhibitory neurons. One popular model posits that sparse, but synchronous, firing by pyramidal neurons drives recurrently connected inhibitory parvalbumin interneurons, which then synchronously impose a silent period on the pyramidal neurons. The relative timing of stimulus presentation to this oscillation influences the fidelity of processing and strength of the response (Cardin et al., 2009; Sohal et al., 2009). Possibly explaining our paradoxical decrease in phase-locking during the first session, the parvalbumin interneurons that help pace the gamma oscillation are inhibited by the US during the acquisition of conditioned fear (Letzkus et al., 2011).
Functionally, our results indicate that learning alters gamma-band synchrony, reflecting a new form of cortical plasticity, one that directly affects the circuit-wide processing of stimuli, in contrast to merely increasing responsiveness. Such plasticity may also predicate the widely observed correspondence between attention and gamma-band synchrony in well trained subjects (Fries, 2005).
Correlated firing and its behavioral consequences
A consequence of increasing phase-locking at NEAR sites would be enhanced correlated firing on the time scale of gamma oscillations. If two sets of MUA both phase-lock to a common gamma oscillation, then their cross-correlation should be modulated on the gamma time scale. Correlated firing between neurons can have an even greater propensity for driving downstream targets than independent increases in firing rate (Abeles, 1982, 1991; Kuhn et al., 2002). The behavioral potency of a fear CS may stem from it engaging the populations that represent it in a concerted manner, allowing them to wrest control of their downstream targets from ongoing processes and competing influences (Desimone, 1998; Zeitler et al., 2008).
Modeling studies have demonstrated that gamma's modulation of population activity should display certain signatures (Buehlmann and Deco, 2010). Correlated firing should track the phase of gamma, with periods corresponding to depolarization (or release from inhibition) providing a window for synaptic interaction. In addition, increased gamma amplitude should enhance the depth of this modulation, further compressing these bursts of coactivation. We found exactly this: the degree of coincident firing between units increased during the negative slope of gamma, and this effect had a positive relationship with gamma amplitude. Most importantly, fear conditioning affected gamma modulation of coincident activity. It was greatest between NEAR pairs and persisted across conditioning sessions. Additionally, its development within just the first conditioning session corresponded with the rapid acquisition of conditioned fear.
Viewed through the lens of behavior, increasing the coordination of activity between sites representing the CS allows them to better drive downstream targets involved in the execution of fear behavior. Thus, the correlation in firing between NEAR sites should partly predict the strength of CRs. This is indeed what we found. Subjects with the strongest CC between their NEAR sites showed the most robust fear behavior. Bringing this back to gamma, those top-performing subjects also exhibited damped oscillatory patterns in their CCs matching the time scale of gamma oscillations (60 Hz, with a wavelength of ∼17 ms).
Future directions
The current findings suggest that coordinated spiking across neuronal populations should enhance their effects on target structures. This hypothesis could be tested by recording simultaneously from the auditory cortex and either or both area TE3 and the perirhinal cortex. Both of these regions receive direct projections from auditory cortex, and both project to the amygdala, a subcortical structure that mediates fear behavior (Maren, 2005). Simultaneous recordings from auditory cortex and either of those regions would allow us to test whether spiking in auditory cortex is better able to drive responses in its downstream targets. Despite the ambition of such a series of experiments, they would not directly test a causal role for gamma oscillations in auditory cortex affecting fear behavior. A more direct experiment would be to block gamma-band activation in auditory cortex during fear conditioning. Unfortunately, it would be difficult to perturb gamma oscillations in isolation given the manifold mechanisms underlying their generation. One possibility is to selectively silence parvalbumin neurons during CS presentation with optogenetic inhibition (Sohal et al., 2009), which would provide temporally controlled reductions in gamma strength.
Besides establishing the role that cortical gamma oscillations play in conditioned fear, it also remains to be explored what factors are critical for their enhancement. In our experiment, changes in gamma occurred across multiple conditioning sessions. It may be that time from the first training session is sufficient for producing the changes in CS-induced gamma oscillations. Alternatively, the critical driver may be the repeated training experiences. The present experiment cannot distinguish between these possibilities. To do so, subjects should receive 1 d of training, followed by a subsequent session after either 0, 1, or 2 d of rest. Such an experiment would not only establish whether time is a sufficient driver of plasticity for gamma oscillations, but also address the issue of memory and trace consolidation as well.
Conclusion
Auditory cortical plasticity with aversive conditioning has long been known (Galambos et al., 1956). Systematic changes in evoked potentials and firing rates have remained the primary neural signature for understanding the role sensory cortices play in associative memory (Weinberger, 2007; Brechmann et al., 2011). However, this approach underappreciates the cortex's capacity to dynamically coordinate its activity across regions, a defining property of its operation. Such coordination has been tied to gamma synchronization, which has been linked to cortical function in general, attention, and now fear memory. Thus, the consequences of changes in sensory cortices with fear learning extend beyond local enhancements in firing rate and evoked potentials. These findings point to a new path forward, one that treats associative plasticity for what it very likely is, part of a distributed interactive whole.
Footnotes
The authors declare no competing financial interests.
This work was supported by a research grant from the National Institutes of Health–National Institute on Deafness and Other Communication Disorders (DC-02938 to N.M.W.). We thank Jacquie Weinberger and Gabriel K. Hui for secretarial assistance.
References
- Abeles M. Role of the cortical neuron: integrator or coincidence detector? Isr J Med Sci. 1982;18:83–92. [PubMed] [Google Scholar]
- Abeles M. Corticonics: neural circuits of the cerebral cortex. New York: Cambridge UP; 1991. [Google Scholar]
- Barth DS, MacDonald KD. Thalamic modulation of high-frequency oscillating potentials in auditory cortex. Nature. 1996;383:78–81. doi: 10.1038/383078a0. [DOI] [PubMed] [Google Scholar]
- Bauer EP, Paz R, Paré D. Gamma oscillations coordinate amygdalo-rhinal interactions during learning. J Neurosci. 2007;27:9369–9379. doi: 10.1523/JNEUROSCI.2153-07.2007. [DOI] [PMC free article] [PubMed] [Google Scholar]
- Beck EC, Doty RW, Kooi KA. Electrocortical reactions associated with conditioned flexion reflexes. Electroencephalogr Clin Neurophysiol. 1958;10:279–289. doi: 10.1016/0013-4694(58)90035-x. [DOI] [PubMed] [Google Scholar]
- Bedenbaugh P, Gerstein GL. Multiunit normalized cross correlation differs from the average single-unit normalized correlation. Neural Comput. 1997;9:1265–1275. doi: 10.1162/neco.1997.9.6.1265. [DOI] [PubMed] [Google Scholar]
- Boatman JA, Kim JJ. A thalamo-cortico-amygdala pathway mediates auditory fear conditioning in the intact brain. Eur J Neurosci. 2006;24:894–900. doi: 10.1111/j.1460-9568.2006.04965.x. [DOI] [PubMed] [Google Scholar]
- Bokil H, Andrews P, Kulkarni JE, Mehta S, Mitra PP. Chronux: a platform for analyzing neural signals. J Neurosci Methods. 2010;192:146–151. doi: 10.1016/j.jneumeth.2010.06.020. [DOI] [PMC free article] [PubMed] [Google Scholar]
- Bouton ME. Learning and behavior: a contemporary synthesis. Sunderland, MA: Sinauer Associates; 2007. [Google Scholar]
- Brechmann A, Brosch M, Budinger E, Heil P, König R, Ohl F, Scheich H. Auditory cortex—current concepts in human and animal research. Hear Res. 2011;271:1–2. doi: 10.1016/j.heares.2010.10.016. [DOI] [PubMed] [Google Scholar]
- Brillinger DR, Bryant HL, Jr, Segundo JP. Identification of synaptic interactions. Biol Cybern. 1976;22:213–228. doi: 10.1007/BF00365087. [DOI] [PubMed] [Google Scholar]
- Bröckelmann AK, Steinberg C, Elling L, Zwanzger P, Pantev C, Junghöfer M. Emotion-associated tones attract enhanced attention at early auditory processing: magnetoencephalographic correlates. J Neurosci. 2011;31:7801–7810. doi: 10.1523/JNEUROSCI.6236-10.2011. [DOI] [PMC free article] [PubMed] [Google Scholar]
- Buehlmann A, Deco G. Optimal information transfer in the cortex through synchronization. PLoS Comput Biol. 2010;6:1–10. doi: 10.1371/journal.pcbi.1000934. [DOI] [PMC free article] [PubMed] [Google Scholar]
- Burchell TR, Faulkner HJ, Whittington MA. Gamma frequency oscillations gate temporally coded afferent inputs in the rat hippocampal slice. Neurosci Lett. 1998;255:151–154. doi: 10.1016/s0304-3940(98)00676-4. [DOI] [PubMed] [Google Scholar]
- Butt AE, Chavez CM, Flesher MM, Kinney-Hurd BL, Araujo GC, Miasnikov AA, Weinberger NM. Association learning-dependent increases in acetylcholine release in the rat auditory cortex during auditory classical conditioning. Neurobiol Learn Mem. 2009;92:400–409. doi: 10.1016/j.nlm.2009.05.006. [DOI] [PubMed] [Google Scholar]
- Cardin JA, Carlén M, Meletis K, Knoblich U, Zhang F, Deisseroth K, Tsai LH, Moore CI. Driving fast-spiking cells induces gamma rhythm and controls sensory responses. Nature. 2009;459:663–667. doi: 10.1038/nature08002. [DOI] [PMC free article] [PubMed] [Google Scholar]
- Chrobak JJ, Buzsáki G. Gamma oscillations in the entorhinal cortex of the freely behaving rat. J Neurosci. 1998;18:388–398. doi: 10.1523/JNEUROSCI.18-01-00388.1998. [DOI] [PMC free article] [PubMed] [Google Scholar]
- Desimone R. Visual attention mediated by biased competition in extrastriate visual cortex. Philos Trans R Soc Lond B Biol Sci. 1998;353:1245–1255. doi: 10.1098/rstb.1998.0280. [DOI] [PMC free article] [PubMed] [Google Scholar]
- Fendt M, Fanselow MS. The neuroanatomical and neurochemical basis of conditioned fear. Neurosci Biobehav Rev. 1999;23:743–760. doi: 10.1016/s0149-7634(99)00016-0. [DOI] [PubMed] [Google Scholar]
- Fisahn A, Pike FG, Buhl EH, Paulsen O. Cholinergic induction of network oscillations at 40 Hz in the hippocampus in vitro. Nature. 1998;394:186–189. doi: 10.1038/28179. [DOI] [PubMed] [Google Scholar]
- Fisher NI. Statistical analysis of circular data. Cambridge, UK: Cambridge UP; 1993. [Google Scholar]
- Fries P. A mechanism for cognitive dynamics: neuronal communication through neuronal coherence. Trends Cogn Sci. 2005;9:474–480. doi: 10.1016/j.tics.2005.08.011. [DOI] [PubMed] [Google Scholar]
- Fries P, Reynolds JH, Rorie AE, Desimone R. Modulation of oscillatory neuronal synchronization by selective visual attention. Science. 2001;291:1560–1563. doi: 10.1126/science.1055465. [DOI] [PubMed] [Google Scholar]
- Galambos R, Sheatz G, Vernier VG. Electrophysiological correlates of a conditioned response in cats. Science. 1956;123:376–377. doi: 10.1126/science.123.3192.376. [DOI] [PubMed] [Google Scholar]
- Gluck H, Khachaturian Z, MacIntyre J, Holden F. Quantified levels of electrographic activation during defensive conditioning. Cond Reflex. 1966;1:212–225. [Google Scholar]
- Goldstein MH, Jr, Abeles M, Daly RL, McIntosh J. Functional architecture in cat primary auditory cortex: tonotopic organization. J Neurophysiol. 1970;33:188–197. doi: 10.1152/jn.1970.33.1.188. [DOI] [PubMed] [Google Scholar]
- Gonzalez-Lima F, Scheich H. Classical conditioning of tone-signaled bradycardia modifies 2-deoxyglucose uptake patterns in cortex, thalamus, habenula, caudate–putamen and hippocampal formation. Brain Res. 1986;363:239–256. doi: 10.1016/0006-8993(86)91009-7. [DOI] [PubMed] [Google Scholar]
- Harris KD, Thiele A. Cortical state and attention. Nat Rev Neurosci. 2011;12:509–523. doi: 10.1038/nrn3084. [DOI] [PMC free article] [PubMed] [Google Scholar]
- Headley DB, Weinberger NM. Gamma-band activation predicts both associative memory and cortical plasticity. J Neurosci. 2011;31:12748–12758. doi: 10.1523/JNEUROSCI.2528-11.2011. [DOI] [PMC free article] [PubMed] [Google Scholar]
- Jeschke M, Lenz D, Budinger E, Herrmann CS, Ohl FW. Gamma oscillations in gerbil auditory cortex during a target-discrimination task reflect matches with short-term memory. Brain Res. 2008;1220:70–80. doi: 10.1016/j.brainres.2007.10.047. [DOI] [PubMed] [Google Scholar]
- Kajikawa Y, Schroeder CE. How local is the local field potential? Neuron. 2011;72:847–858. doi: 10.1016/j.neuron.2011.09.029. [DOI] [PMC free article] [PubMed] [Google Scholar]
- Klink R, Alonso A. Muscarinic modulation of the oscillatory and repetitive firing properties of entorhinal cortex layer II neurons. J Neurophysiol. 1997;77:1813–1828. doi: 10.1152/jn.1997.77.4.1813. [DOI] [PubMed] [Google Scholar]
- Kuhn A, Rotter S, Aertsen A. Correlated input spike trains and their effects on the response of the leaky integrate-and-fire neuron. Neurocomputing 44–. 2002;46:121–126. [Google Scholar]
- Letzkus JJ, Wolff SB, Meyer EM, Tovote P, Courtin J, Herry C, Lüthi A. A disinhibitory microcircuit for associative fear learning in the auditory cortex. Nature. 2011;480:331–335. doi: 10.1038/nature10674. [DOI] [PubMed] [Google Scholar]
- Levy WB, Baxter RA. Energy efficient neural codes. Neural Comput. 1996;8:531–543. doi: 10.1162/neco.1996.8.3.531. [DOI] [PubMed] [Google Scholar]
- MacDonald KD, Fifkova E, Jones MS, Barth DS. Focal stimulation of the thalamic reticular nucleus induces focal gamma waves in cortex. J Neurophysiol. 1998;79:474–477. doi: 10.1152/jn.1998.79.1.474. [DOI] [PubMed] [Google Scholar]
- Maren S. Building and burying fear memories in the brain. Neuroscientist. 2005;11:89–99. doi: 10.1177/1073858404269232. [DOI] [PubMed] [Google Scholar]
- Metherate R, Cox CL, Ashe JH. Cellular bases of neocortical activation: modulation of neural oscillations by the nucleus basalis and endogenous acetylcholine. J Neurosci. 1992;12:4701–4711. doi: 10.1523/JNEUROSCI.12-12-04701.1992. [DOI] [PMC free article] [PubMed] [Google Scholar]
- Miltner WH, Braun C, Arnold M, Witte H, Taub E. Coherence of gamma-band EEG activity as a basis for associative learning. Nature. 1999;397:434–436. doi: 10.1038/17126. [DOI] [PubMed] [Google Scholar]
- Miskovic V, Keil A. Acquired fears reflected in cortical sensory processing: a review of electrophysiological studies of human classical conditioning. Psychophysiology. 2012;49:1230–1241. doi: 10.1111/j.1469-8986.2012.01398.x. [DOI] [PMC free article] [PubMed] [Google Scholar]
- Montemurro MA, Rasch MJ, Murayama Y, Logothetis NK, Panzeri S. Phase-of-firing coding of natural visual stimuli in primary visual cortex. Curr Biol. 2008;18:375–380. doi: 10.1016/j.cub.2008.02.023. [DOI] [PubMed] [Google Scholar]
- Moruzzi G, Magoun HW. Brain stem reticular formation and activation of the EEG. Electroencephalogr Clin Neurophysiol. 1949;1:455–473. [PubMed] [Google Scholar]
- Nichols T, Brett M, Andersson J, Wager T, Poline JB. Valid conjunction inference with the minimum statistic. Neuroimage. 2005;25:653–660. doi: 10.1016/j.neuroimage.2004.12.005. [DOI] [PubMed] [Google Scholar]
- Okun M, Naim A, Lampl I. The subthreshold relation between cortical local field potential and neuronal firing unveiled by intracellular recordings in awake rats. J Neurosci. 2010;30:4440–4448. doi: 10.1523/JNEUROSCI.5062-09.2010. [DOI] [PMC free article] [PubMed] [Google Scholar]
- Otte S, Hasenstaub A, Callaway EM. Cell type-specific control of neuronal responsiveness by gamma-band oscillatory inhibition. J Neurosci. 2010;30(6):2150–2159. doi: 10.1523/JNEUROSCI.4818-09.2010. [DOI] [PMC free article] [PubMed] [Google Scholar]
- Reale RA, Imig TJ. Tonotopic organization in auditory cortex of the cat. J Comp Neurol. 1980;192(2):265–291. doi: 10.1002/cne.901920207. [DOI] [PubMed] [Google Scholar]
- Rothschild G, Nelken I, Mizrahi A. Functional organization and population dynamics in the mouse primary auditory cortex. Nat Neurosci. 2010;13:353–360. doi: 10.1038/nn.2484. [DOI] [PubMed] [Google Scholar]
- Rutkowski RG, Miasnikov AA, Weinberger NM. Characterisation of multiple physiological fields within the anatomical core of rat auditory cortex. Hear Res. 2003;181:116–130. doi: 10.1016/s0378-5955(03)00182-5. [DOI] [PubMed] [Google Scholar]
- Sacco T, Sacchetti B. Role of secondary sensory cortices in emotional memory storage and retrieval in rats. Science. 2010;329:649–656. doi: 10.1126/science.1183165. [DOI] [PubMed] [Google Scholar]
- Salinas E, Sejnowski TJ. Impact of correlated synaptic input on output firing rate and variability in simple neuronal models. J Neurosci. 2000;20:6193–6209. doi: 10.1523/JNEUROSCI.20-16-06193.2000. [DOI] [PMC free article] [PubMed] [Google Scholar]
- Sally SL, Kelly JB. Organization of auditory cortex in the albino rat: sound frequency. J Neurophysiol. 1988;59:1627–1638. doi: 10.1152/jn.1988.59.5.1627. [DOI] [PubMed] [Google Scholar]
- Sohal VS, Zhang F, Yizhar O, Deisseroth K. Parvalbumin neurons and gamma rhythms enhance cortical circuit performance. Nature. 2009;459:698–702. doi: 10.1038/nature07991. [DOI] [PMC free article] [PubMed] [Google Scholar]
- Steriade M, Contreras D, Amzica F, Timofeev I. Synchronization of fast (30–40 Hz) spontaneous oscillations in intrathalamic and thalamocortical networks. J Neurosci. 1996;16:2788–2808. doi: 10.1523/JNEUROSCI.16-08-02788.1996. [DOI] [PMC free article] [PubMed] [Google Scholar]
- Sukov W, Barth DS. Cellular mechanisms of thalamically evoked gamma oscillations in auditory cortex. J Neurophysiol. 2001;85:1235–1245. doi: 10.1152/jn.2001.85.3.1235. [DOI] [PubMed] [Google Scholar]
- Teyler TJ. Effects of restraint on heart-rate conditioning in rats as a function of US location. J Comp Physiol Psychol. 1971;77:31–37. doi: 10.1037/h0031579. [DOI] [PubMed] [Google Scholar]
- Thiel CM, Friston KJ, Dolan RJ. Cholinergic modulation of experience-dependent plasticity in human auditory cortex. Neuron. 2002;35:567–574. doi: 10.1016/s0896-6273(02)00801-2. [DOI] [PubMed] [Google Scholar]
- Thomson DJ. Spectrum estimation and harmonic analysis. Proc IEEE. 1982;70:1055–1096. [Google Scholar]
- Vinck M, Lima B, Womelsdorf T, Oostenveld R, Singer W, Neuenschwander S, Fries P. Gamma-phase shifting in awake monkey visual cortex. J Neurosci. 2010;30:1250–1257. doi: 10.1523/JNEUROSCI.1623-09.2010. [DOI] [PMC free article] [PubMed] [Google Scholar]
- Volgushev M, Chistiakova M, Singer W. Modification of discharge patterns of neocortical neurons by induced oscillations of the membrane potential. Neuroscience. 1998;83:15–25. doi: 10.1016/s0306-4522(97)00380-1. [DOI] [PubMed] [Google Scholar]
- Weinberger NM. Specific long-term memory traces in primary auditory cortex. Nat Rev Neurosci. 2004;5:279–290. doi: 10.1038/nrn1366. [DOI] [PMC free article] [PubMed] [Google Scholar]
- Weinberger NM. Auditory associative memory and representational plasticity in the primary auditory cortex. Hear Res. 2007;229:54–68. doi: 10.1016/j.heares.2007.01.004. [DOI] [PMC free article] [PubMed] [Google Scholar]
- Weinberger NM. The medial geniculate, not the amygdala, as the root of auditory fear conditioning. Hear Res. 2011;274:61–74. doi: 10.1016/j.heares.2010.03.093. [DOI] [PMC free article] [PubMed] [Google Scholar]
- Weinberger NM, Diamond DM. Physiological plasticity in auditory cortex: rapid induction by learning. Prog Neurobiol. 1987;29:1–55. doi: 10.1016/0301-0082(87)90014-1. [DOI] [PubMed] [Google Scholar]
- Whittington MA, Traub RD, Kopell N, Ermentrout B, Buhl EH. Inhibition-based rhythms: experimental and mathematical observations on network dynamics. Int J Psychophysiol. 2000;38:315–336. doi: 10.1016/s0167-8760(00)00173-2. [DOI] [PubMed] [Google Scholar]
- Winters RW, McCabe PM, Schneiderman N. Functional utility and neurobiology of conditioned autonomic responses. In: Moore JW, editor. A neuroscientist's guide to classical conditioning. New York: Springer; 2002. pp. 46–85. [Google Scholar]
- Womelsdorf T, Schoffelen JM, Oostenveld R, Singer W, Desimone R, Engel AK, Fries P. Modulation of neuronal interactions through neuronal synchronization. Science. 2007;316:1609–1612. doi: 10.1126/science.1139597. [DOI] [PubMed] [Google Scholar]
- Zeitler M, Fries P, Gielen S. Biased competition through variations in amplitude of gamma-oscillations. J Comput Neurosci. 2008;25:89–107. doi: 10.1007/s10827-007-0066-2. [DOI] [PMC free article] [PubMed] [Google Scholar]