Abstract
The countermanding saccade task has been used in many studies to investigate the neural mechanisms that underlie the decision to execute or restrain rapid eye movements. In this task, the presentation of a saccade target is sometimes followed by the appearance of a stop cue that indicates that the subject should cancel the planned movement. Performance has been modeled as a race between motor preparation and cancellation processes. The signal that reaches its activation threshold first determines whether a saccade is generated or cancelled. In these studies, an important parameter is the time required to process the stop cue, referred to as the stop signal reaction time (SSRT). The SSRT is estimated using statistical approaches, the validity of which has not been unequivocally established. A more direct measure of this parameter might be obtainable if a method was available to “unmask” the developing motor command. This can be accomplished by air-puff-evoked blinks, which inhibit pontine omnipause neurons that serve as an inhibitory gate for the saccadic system. In the present study, brief puffs of air were used to elicit blinks at various times while rhesus monkeys performed a countermanding saccade task. If the developing motor command has not yet been cancelled, this should trigger a saccade. When blinks occurred between ~50 and 200 ms after target onset, saccades were often evoked. Saccades were rarely evoked more than ~70 ms after stop cue onset; this value represents a behavioral evaluation of SSRT and was comparable to the estimates obtained using standard statistical approaches. When saccades occurred near the SSRT on blink trials, they were often hypometric. Furthermore, Monte Carlo simulations were performed to model the effects of blink time on the race model. Overall, the study supports the validity of the statistical methods currently in use.
INTRODUCTION
It is sometimes necessary to restrain an intended movement in response to an unexpected event. Investigation of the neural basis for the cancellation of planned movements has the potential to reveal much about mechanisms mediating voluntary behavior (Hanes and Schall 1996; Paré and Hanes 2003) and performance monitoring (Ito et al. 2003; Stuphorn et al. 2000). To this end, countermanding tasks have been developed, for a variety of motor systems, as laboratory models of these real life situations (Hanes and Carpenter 1999; Hanes and Schall 1995; Lappin and Eriksen 1966; Logan and Cowan 1984; Osman et al. 1986; White et al. 1962). In Fig 1, for the eye movement task shown, the subject performs a movement in response to the presentation of a cue. On a subset of trials, a second cue is presented, indicating that the subject should cancel the planned movement. Manipulating the timing of the stop cue affects the probability that the subject will successfully cancel the movement. It has been proposed that the results of these experiments are best explained by a model that posits a race between independent go and stop processes (Fig. 2) (Lappin and Eriksen 1966; Logan 1994; Logan and Cowan 1984; Osman et al. 1986; White et al. 1962). If the go process crosses its threshold first, the saccade occurs; if the stop process reaches its threshold first, the movement is successfully cancelled. Manipulation of the timing of the stop cue is believed to affect the outcome of this race by determining when the stop process can begin to develop. If the stop cue is presented soon after the appearance of the visual target, the stop process crosses threshold first, and saccades rarely occur (cancelled trials; Fig. 2B). On the other hand, if the stop cue is presented too late, the go process finishes first, and the saccade almost always occurs (noncancelled trials; Fig. 2A). At intermediate times, the movement may or may not occur. If a movement is successfully cancelled, there is no way to know when the stop process reached threshold (for cancelled trials). Thus the time required to cancel a planned movement, also referred to as the saccade stop reaction time (SSRT), has only been inferred using statistical techniques, and its validity has not been unequivocally established. Nevertheless, studies using the countermanding task have relied on the SSRT estimate to form conclusions regarding the neural bases of movement initiation (Curtis et al. 2005; Hanes and Schall 1996; Hanes et al. 1998; Paré and Hanes 2003) and performance monitoring (Ito et al. 2003; Stuphorn et al. 2000). Other experiments have investigated performance in this task when the target and stop cues are of different modalities (Cabel et al. 2000; Colonius et al. 2001; Morein-Zamir et al. 2004; Özyurt et al. 2003) or at different spatial locations (Asrress and Carpenter 2001) and when the action requires more than one type of motor output (Corneil and Elsley 2005; Jarrett and Barnes 2003; Kornylo et al. 2003; Logan and Irwin 2000). Thus a behavioral evaluation of the movement cancellation process is required to test the validity of the SSRT values estimated using statistical techniques.
FIG. 1.
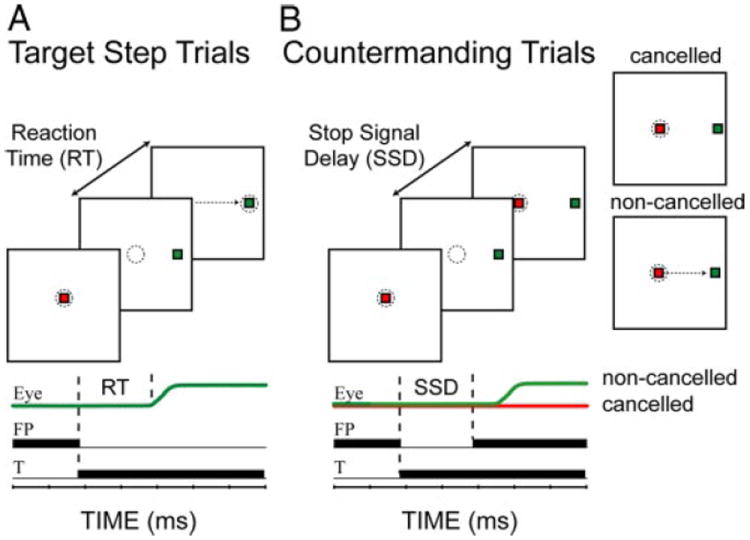
Schematic of the target step (A) and countermanding (B) trial types. Top: visual display is schematically illustrated. - - -, imaginary windows within which the monkey is required to maintain gaze. To the right of B, 2 potential outcomes are shown. For the noncancelled trial, →,erroneous saccade to the green target. Bottom: sequence of events is schematized as black bars plotted against time. Modified from Paré and Hanes (2003).
FIG. 2.

Schematic of the race model showing the expected effects of blinks. The stop and go processes race toward their respective thresholds (dashed red and solid green lines, respectively). If the go process finishes first, the movement is generated (noncancelled trial). If the stop process finishes first, the saccade is successfully cancelled. An eye blink effectively lowers the threshold for saccade initiation by turning off the omnipause neurons (OPNs, right). In some cases, this allows the go process to “win” the race when it would otherwise have “lost.”
Knowledge of one potential threshold substrate for saccades made this eye movement the ideal motor system to use with the countermanding task in our study. For the go process, reaching the activation threshold level results in inhibition of the pontine omnipause neurons (OPNs) (Hanes and Schall 1996), which discharge at a tonic rate during fixation and are quiescent during saccades. Transiently ceasing OPN activity before it normally stops, such as during blinks (Cohen and Henn 1972; Fuchs et al. 1991; Mays and Morrisse 1994), is arguably equivalent to lowering the activation threshold (Fig. 2C) (Gandhi and Bonadonna 2005). Indeed, blinks evoked by an air-puff to the eye shortly after target onset in a visually guided saccade task drastically reduced the latency (Evinger et al. 1994; Gandhi and Bonadonna 2005; Goossens and Van Opstal 2000). Neurons in the superior colliculus (Paré and Hanes 2003), frontal eye fields (Hanes and Schall 1996), and other oculomotor structures may also contribute to the determination of the threshold level.
We reasoned that for countermanding trials, blinks should trigger saccades if they occur shortly after the onset of the target and before the appearance of the stop cue. In contrast, when the blink occurs after the presentation of the stop cue, saccades should be triggered only until the stop process reaches its threshold. Beyond this point, blinks should no longer trigger saccades. We predicted, therefore, that the estimated SSRT should approximately correspond to the upper bound latency (with respect to the onset of the stop cue) of these blink triggered saccades. In addition, because the blink prolongs saccade duration, the effect of the stop process reaching its threshold may be to increase the proportion of hypometric saccades.
A preliminary version of this study has been published previously in abstract form (Walton and Gandhi 2005).
METHODS
Surgical procedures
All experimental and surgical procedures were approved by the Institutional Animal Care and Use Committee at the University of Pittsburgh and complied with the guidelines of the Public Health Service Policy on Humane Care and Use of Laboratory Animals. Two rhesus monkeys (Macacca mulatta) underwent sterile surgery under isoflurane anesthesia for implantation of a Teflon-coated stainless steel coil for eye movement measurements using the magnetic search coil technique and an acrylic fixture on the skull to permit head restraint. These procedures have been described in detail previously (Gandhi and Bonadonna 2005).
Behavioral tasks
During experiments, the animals sat in a primate chair in a dimly lit room. Targets were presented on a light-emitting diode (LED) screen located ~70 cm away from the animal. The LEDs were spaced at 2° intervals over a range of 96° horizontally and 80° vertically. Target presentation and data acquisition were controlled by custom software written in LabView RT (Bryant and Gandhi 2005). The vertical position of the eyelid was recorded (in arbitrary units) by taping a ~5-mm diameter coil of Teflon-coated stainless steel wire to the outer surface of the lid. Care was taken to ensure that the coil and tape were placed such that they would not interfere with blinks or vision. The air-puff used to evoke blinks was monitored by a flow meter that was placed ~10 cm away from the eye. Eye position, eyelid position, and air flow were sampled at 1 kHz.
Monkeys were trained to perform randomly interleaved visually guided target step and countermanding (or stop) saccade tasks for a liquid reward. In the target-step task (Fig. 1A), the monkey first fixated a red LED illuminated at the straight-ahead position. After a variable time (generally 400 – 800 ms), the red LED was extinguished and, simultaneously, a green LED was presented at one of two eccentricities (±16°, monkey TY; ±20°, monkey WL; no vertical displacement). Additional details are available elsewhere (Gandhi and Bonadonna 2005). In a randomly selected 25–30% of trials (countermanding task), the central red LED was reilluminated at various intervals (Fig. 1B), and it served as a stop cue, signaling the animal to cancel the planned saccade. The interval between the onset of the green target and reappearance of the red target is referred to as the stop signal delay (SSD) and was set to range from 10 to 500 ms for monkey WL and 35–335 ms for monkey TY. In this task, reward was contingent on the maintenance of fixation on the red target throughout the trial. To ensure that the animals did not adopt a wait-and-see strategy, they were given a maximum of 500 ms to look to the green target in target step trials.
On a randomly chosen 25–30% of all trials, a TTL-triggered, solenoid valve was used to deliver an air puff to one eye to activate the trigeminal blink reflex (Gandhi and Bonadonna 2005). The timing of the puff was randomized to occur at any point during a target step or countermanding trial. Thus the database contained four types of trials: step and countermanding trials each with and without blinks. In general, however, the percentage of step-blink trials was small (<5%) to collect a higher percentage of countermanding trials with blinks.
Based on pilot experiments presented elsewhere (Gandhi and Bonadonna 2005), we determined that blink onset occurred 24.3 ± 7.4 ms after the air-puff reached the eye, implying a tight coupling between the two events. Analyses were limited to trials in which the blink was triggered by the air-puff. There was a slight tendency for one animal (WL) to produce a blink associated with the saccade on no-blink trials. Such trials were excluded from analyses. To counter the generation of this conditioned response, we reduced the percentage of air-puff trials.
Data analysis
Data were analyzed off-line using custom and commercial software. Saccade onset and offset were defined based on velocity criteria of 50 and 30°/s, respectively. These velocity criteria were found to reliably measure saccades while rarely measuring blink-associated eye movements (Gandhi and Bonadonna 2005). Dynamical approaches, such as subtraction of averaged eye position for blinks not associated with saccades from position traces on saccade trials, were rejected because blink-associated eye movements and saccades do not sum linearly when they occur together (Goossens and Van Opstal 2000). Eyelid position was measured in arbitrary units. To determine the optimal blink onset and offset thresholds, a lid “velocity” (i.e., change in arbitrary units/time) was computed. Because eye blinks are characterized by an extremely high eyelid velocity (VanderWerf et al. 2003), the measured times of blink onset and offset were relatively insensitive to changes in thresholds. Thus the thresholds could easily be set to a high enough value to exclude most eyelid movements that were not blinks. Puff onset was easily detected as a deflection in the air flow trace. For analyses pertinent to the blink condition, only trials with puff-evoked blinks—that is, blink onset was within 100 ms of the puff onset—were included in the analysis. An experimenter verified the accuracy of these measurements for each trial.
Conventionally, saccade latency and blink time are referenced to onset of the green, eccentric target. For some analyses associated with countermanding trials, these parameters are referenced with respect to the appearance of the stop cue. Positive values of these parameters indicate that the stop cue was presented before the event. When saccades occurred before the appearance of the stop cue, the trial was immediately aborted. In this case, the time that the stop cue would have appeared if the trial had continued was used, and the computed measure was negative.
For countermanding trials without blinks, the SSRT was estimated using the integration, mean, and median methods (Hanes and Schall 1995; Logan and Cowan 1984). Behavioral evaluation of the equivalent measure for countermanding trials with blinks was obtained by computing the upper bound of saccade latency with respect to stop cue onset. The distribution of data points was fitted with an extreme value function (“evfit” command in Matlab). The number corresponding to a cumulative probability of 0.975 was taken as the upper bound value. This extreme value function was preferred over a normal distribution because the upper end of the distribution was expected to be bounded. A nonparametric measure, the 97.5 percentile of the distribution of interest, was also computed for comparison. In all cases, the upper bound values returned by the two analyses were similar.
RESULTS
Performance during target step and countermanding saccade trials, with and without blinks, was recorded across several days, and the data are pooled together for each animal. In all, the analyzed database contained 8,985 (monkey WL) and 21,818 (monkey TY) target-step and 2,086 (WL) and 2,581 (TY) countermanding trials without blinks and 357 (WL) and 513 (TY) target-step and 2,202 (WL) and 1,785 (TY) countermanding trials with blinks.
Saccade-blink latency interactions
The effects of blinks on saccade latency in the countermanding trials can be assessed from single trial examples when the stop cue was presented ~150 ms after target onset (Fig. 3) and from summarized data across all trials and all SSDs (Fig. 4; magenta circles). Trials were classified into three groups. 1) Noncancelled trials in which the saccade was temporally dissociated from the blink (Fig. 3, dark blue traces). This was a typical observation when the blink was evoked before or shortly after target onset. 2) Noncancelled trials in which the blink and saccade onset occur within 50 ms of each other (data approximately within the dotted ellipses in Fig. 4A). Such blink-triggered saccades were normally observed for blinks induced more than ~50 ms after target onset and generally no more than ~70 ms after the onset of the stop cue (Fig. 3, green traces). In certain cases, the eye movement was hypometric (cyan). 3) Cancelled trials, in which no saccade was generated (red). Examination of Fig. 4A also shows that the relationship between blink time and saccade latency for countermanding trials (magenta circles) is similar to that observed during target step trials (blue squares) (also see Gandhi and Bonadonna 2005) with the exception that saccades are not cancelled in the latter condition, denoted by an absence of blue histogram in Fig. 4B.
FIG. 3.
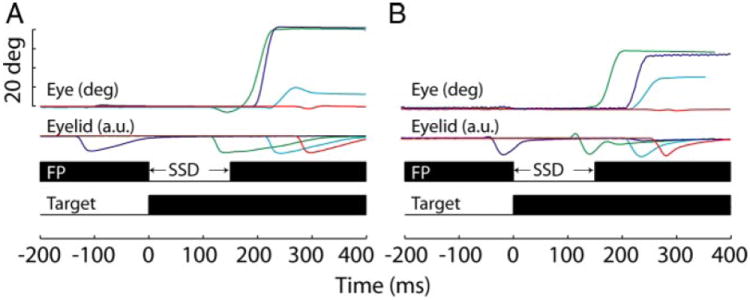
Single-trial examples of countermanding trials with blinks. Each eye position trace corresponds to the eyelid position trace of the same color below. Stop signal delays (SSDs) are the same for all trials within a panel (left, 150 for monkey WL; right, 160 for monkey TY). The effect of the blink on saccade generation depends on its timing (see text). The bottom portion of each panel shows the time course of the countermanding trial. In this and subsequent figures, data from the 2 monkeys are shown in the 2 columns.
FIG. 4.
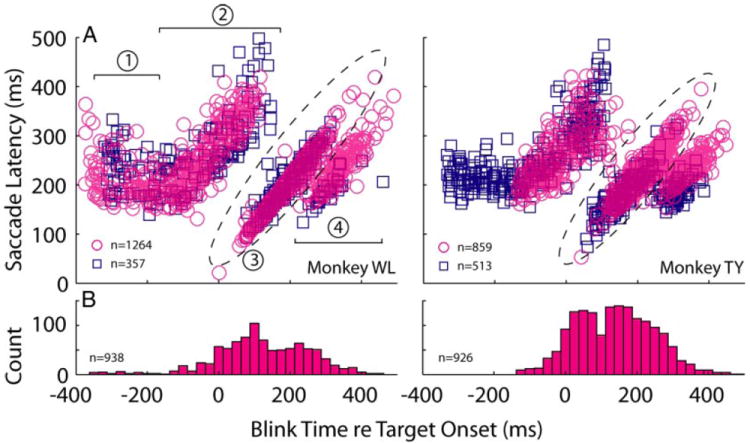
Effect of blink time on saccade latency. A: saccade latency is plotted as a function of blink time across all SSDs for all noncancelled trials, i.e., a saccade was generated. For monkey TY, the air-puff timing in the countermanding task was constrained to not evoke blinks >200 ms before target onset. The relationship between blink time and saccade latency is similar for target step (blue squares) and noncancelled countermanding trials (magenta circles). The effect of blink on saccade latency can be parsed into four clusters (Gandhi and Bonadonna 2005). Cluster 1, blinks occur long before target onset and have no effect on saccade latency; cluster 2, blinks occur around target onset and increase saccade latency, most likely because the eyes are closed or closing when the visual target is presented; cluster 3 (points covered in the dotted ellipse), blinks evoked after the saccade target is processed reduces saccade latency by triggering the eye movement during the blink itself; cluster 4, the blink is evoked after the saccade reaction time. This cluster categorization is referenced by the text describing Monte Carlo simulations of the race model. B: histograms of blink time for cancelled trials, i.e., no saccade generated. Binwidth = 25 ms.
To determine the effective interval over which blinks triggered saccades, blink times were referenced with respect to the presentation of the stop cue. The upward histogram in Fig. 5A plots the distribution of blink times associated with blink-triggered saccades (magenta circles enclosed by the dotted ellipses in Fig. 4A). Blinks evoked as late as 74 ms (monkey WL) and 63 ms (monkey TY) after stop cue onset, determined using the extreme value distribution fit (see METHODS), triggered saccades. Overall, the probability of observing blink-evoked saccades is high before and shortly after the stop cue, but then drops to near zero by 100 ms after the onset of the stop cue (Fig. 5B). Blinks induced later failed to initiate movements (downward histogram). The downward histogram also reveals cancelled movements associated with blink times that should trigger saccades (i.e., for abscissa values less than ~100 ms). These trials were generally associated with small SSD values or with blinks timed to interfere with the processing of the saccade target, which results in increased reaction time and therefore a high probability of saccade cancellation (Fig. 3A) (see Gandhi and Bonadonna 2005 for details).
FIG. 5.
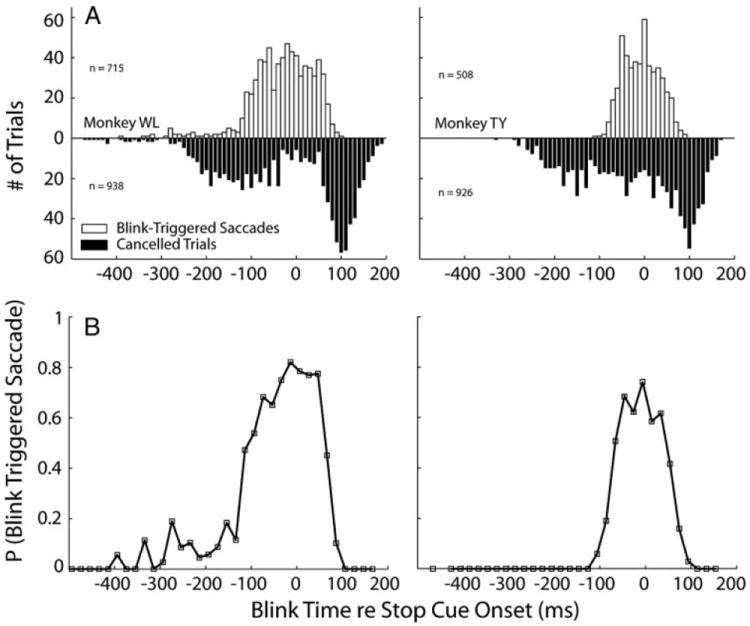
The effective interval of blink times for triggering saccades. A: histograms of blink time relative to stop cue onset for trials with blink-triggered saccades (□) and cancelled (■) trials. Note that blinks can evoke saccades only up to a particular point in time after the appearance of the stop cue. Bin width = 10 ms. B: panels plot the probability of the blink triggering a saccade, given that no saccade had yet occurred at the time of the blink. Bin width = 20 ms.
Behavioral evaluation of SSRT
Statistical techniques for computing the SSRT first derive an inhibition function that relates the probability of making a saccade for each SSD as a function of SSD. For our data, a third parameter, the time of the blink, also contributes to the likelihood of evoking a saccade. Figure 6A illustrates the relationship between these three parameters. Each countermanding-blink trial is depicted as a dot if the animal successfully cancelled the planned movement or as an open circle if the animal generated a saccade; the color of the circle indicates the reaction time. From this representation, the relative density of dots and circles within a local region can be converted into the likelihood of observing a saccade. Binning the data across blink times then permits an examination of this likelihood as a function of SSD and blink time. Figure 6B shows these data along with logistic function fits for various ranges of blink times. Blinks that occur well before target onset do not alter saccade latency (see Fig. 4) and, therefore the inhibition function (blue diamonds) is similar to that obtained from countermanding trials without blinks (black stars). When blinks were timed to occur around target onset, saccade onset was delayed perhaps because the target was not processed before eye closure. As a result, the animals were more likely to be successful in canceling the movement. This tendency caused the inhibition function to shift to the right (green circles). Blinks evoked after the target is processed reduced saccade reaction time, which shifted the inhibition function to the left (red squares). As blink onset was further delayed, saccade reaction time was reduced by lesser amounts until it became similar to control saccades without blinks. This caused the inhibition function (magenta triangles) to shift closer to the inhibition function obtained for countermanding saccades without blinks (black stars).
FIG. 6.
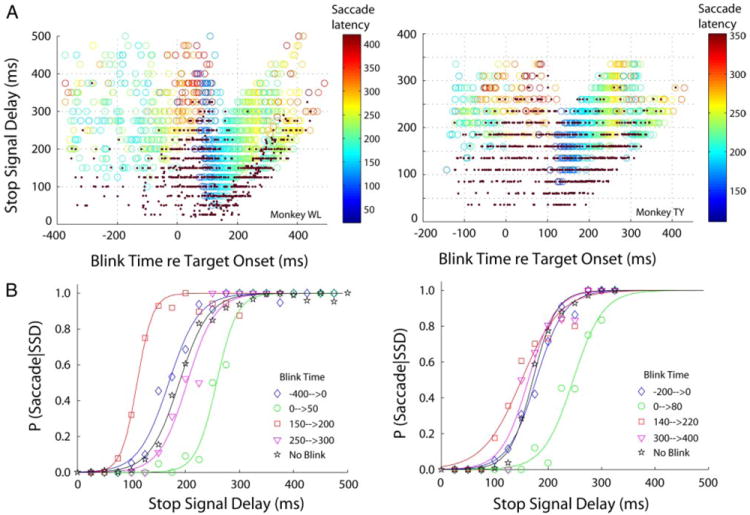
Inhibition functions. A: panels illustrate the relationship between blink time re target onset, SSD, and saccade latency re target onset. Dots indicate trials in which the animal successfully cancelled the movement; circles show trials with saccades. The color of the circles indicates the saccade reaction time. B: inhibition functions for countermanding trials without blinks (black curve with stars) and for countermanding trials with blinks for various ranges of blink times. SSRT parameters were estimated for the nonblink trials only (see text).
The next step in estimating SSRT is to determine, using one of several methods, the temporal shift between the inhibition function and the cumulative latency distribution of target-step trials without blinks. This validity of this approach depends critically on three assumptions about the go and stop processes of the race model (Colonius et al. 2001; Logan and Cowan 1984; Logan et al. 1984). One, the go process behaves similarly in the absence and presence of a stop signal (context independence). In other words, the distributions of reaction times of noncancelled saccades during countermanding trials, and all movements in the target step trials, must be similar. Previous studies have verified this assumption in paradigms not employing blinks, and the corresponding subset of our data are in agreement as well (not shown). That this observation also holds for the blink condition can be ascertained from Fig. 4A, which plots saccade reactions time as a function of blink time for target step and countermanding trials. The two distributions overlap considerably, implying that the blink-induced changes in reaction times result primarily from modification of the go process. Two, the rates of rise, and therefore the times required to reach threshold by the go and stop processes, are independent (stochastic independence). Fulfillment of the context independence criterion suggests that the go process is not influenced by introducing a stop signal on a subset of the trials. However, the perturbation effect of the blink on the go process, as assessed from Figs. 4 and 6, produces a mathematical equivalent of a violation of the stochastic independence assumption. For example, saccade latencies increase when blinks are induced around target onset, most likely because the saccade target is not processed until the eyes reopen. If a stop signal is presented during the blink, the visual system will process both the saccade target and the stop cue simultaneously after the eyes reopen, thereby decreasing the probability of a saccade and shifting the inhibition function to the right (green circles, Fig. 6B). Thus the blink delays the time required for the go process to reach threshold while leaving the stop process relatively unperturbed. Conversely, if the visual information is processed and/or motor preparation has developed sufficiently before blink onset, a saccade is triggered with the blink (points in the dotted ellipse in Fig. 3A). This scenario increases the likelihood of observing a saccade for a given stop signal delay and shifts the inhibition function to the left (red squares, Fig. 6B). Hence, this blink effect is equivalent to reducing the time required to reach threshold for the go process. Thus the nonlinear effect of blink time on the go process produces an illusory dependence on the motor preparation and cancellation mechanisms. Three, the distribution of SSRT is relatively insensitive to stop cue presentation time (SSD invariance). Violation of this condition is revealed from the inhibition functions plotted in Fig. 6B. Note that the curves shift drastically for different blink times, which translates into a highly variable SSRT distribution. Given that several assumptions of the race model are mathematically violated in the blink condition, computing SSRT estimates using standard statistical methods is not justified.
The effects of blinks on performance in the countermanding task were also studied quantitatively with the inequality tests formulated by Colonius and colleagues (2001). The lower boundary condition states that for any SSD, the cumulative latency distribution of noncancelled trials is bounded below by the cumulative reaction time distribution of target step trials. This is indeed what’s observed in the no-blink condition (Fig. 7A). Note that cumulative distributions for the noncancelled trials (each color trace represents 1 SSD condition) are to the left of (or bounded below by) the cumulative distribution in target step trials (solid black trace). This lower boundary condition, however, does not hold in the blink condition (Fig. 7B). Numerous distributions of noncancelled trials are to the right of (and, therefore not bounded below by) the distribution of target step trials with blinks (dashed, black curve) or without blinks (solid, black curve). The upper boundary condition requires that the cumulative latency distribution of noncancelled trials for each SSD be bounded above by the cumulative reaction time distribution of target step trials divided by the probability of evoking a saccade at that SSD. Unfortunately, this analysis cannot be applied in a straightforward way for countermanding trials with blinks because the probability of saccade for a given SSD varies as a function of blink time (see Fig. 6). For performance in the no blink condition, in contrast, there is only one inhibition function (black curve, Fig. 6B) and only one probability measure for each SSD.
FIG. 7.
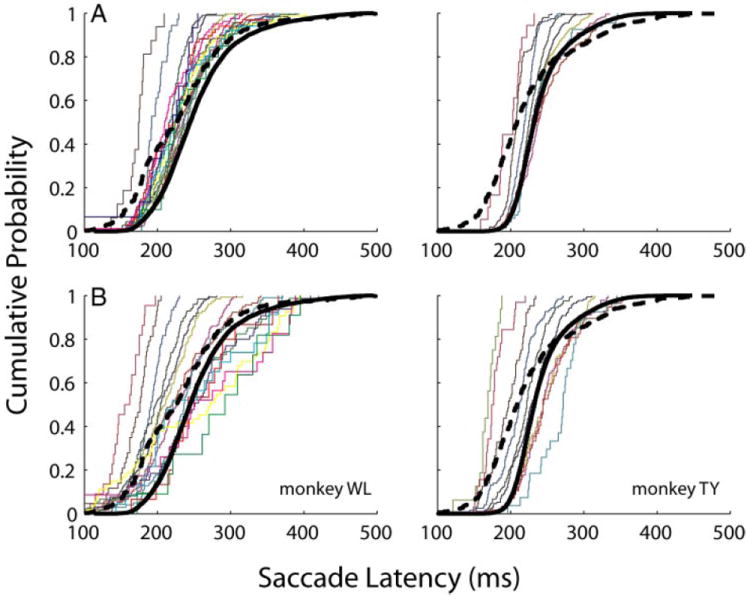
Lower boundary condition of the inequality test. It constrains, the cumulative density function (cdf) of saccade latency of non-cancelled trials for each SSD to be bounded below by the cdf of saccade latency of target-step trials. Each color trace is a cdf for 1 SSD, in increments of 25 ms. The thick, dashed (solid) black trace is the cdf plot from target-step trials with (without) blinks. This criterion is met for performance in countermanding trials without blinks (A) but violated for countermanding trials with blinks (B).
Although the analysis figure is not shown, the upper boundary condition was fulfilled for performance in countermanding trials without blinks. Thus, as demonstrated by various previous studies, the assumptions were met for performance in the countermanding task without blinks. The SSRTs obtained using the integration, mean, and median methods were 57 ± 8 (SD) ms, 60 ms, and 73 ms, respectively, for monkey WL and 62 ± 4 ms, 65 ms, and 70 ms, respectively, for monkey TY (Table 1). If one were to use these statistical methods on the blink data (and use target step trials with blinks as control trials), the SSRT estimates would be physiologically unrealistic (i.e., 35, 37, and 53 ms for the integration, mean, and median methods, respectively, for monkey TY, see DISCUSSION for more detail). Therefore, the conclusions drawn from the qualitative and quantitative treatments of the assumptions of the race model is that one cannot use the established statistical approaches to estimate SSRT for countermanding trials with blinks.
TABLE 1.
SSRT estimates obtained with statistical and blink methods
| Monkey | Countermanding Trials Without Blinks
|
Countermanding Trials With Blinks
|
|||
|---|---|---|---|---|---|
| Integration | Mean | Median | Upper bounda | Upper boundb | |
| WL | 57 ± 8 | 60 | 73 | 72 ± 9c,d | 77 ± 3c,d,e |
| TY | 62 ± 4 | 65 | 70 | 64 ± 13 | 64 ± 3 |
All values are expressed in ms. The measures for integration and upper bound methods are represented as means ± SD. The upper bound values were determined by fitting the distribution of saccade latency (with respect to stop signal cue onset, or SSD) in each 50-ms bin of blink time with an extreme value distribution function (see METHODS).
The mean is computed across all bins.
The mean is computed over blink times associated with a high density of points (blink times: 50–300 ms, WL. 150–300 ms, TY). A signed rank test was used to determine whether the median upper bound value was statistically significantly different from SSRT estimates obtained using
integration.
mean, and
median methods (P < 0.01).
A more appropriate approach (Fig. 8) is to plot saccade latency with respect to stop cue onset as a function of blink time relative to target onset and compare the distribution with SSRT estimates for countermanding trials without blinks (horizontal lines). Note that saccades rarely occurred after this SSRT estimate but were frequent right up to that point. This observation was verified quantitatively by binning the data in 50-ms increments according to blink time re target onset and determining each bin’s upper bound value from an extreme value distribution fit (filled black squares; see METHODS). The mean upper bound across all bins was 72 ± 9 ms (median: 74 ms) for monkey WL and 64 ± 13 ms (median: 63 ms) for monkey TY (Table 1). For monkey WL, the median upper bound was significantly different from SSRT estimates obtained using mean and integration methods only (signed-rank test, P < 0.01). For monkey TY, the median upper bound was not significantly different from SSRT values of any of the three estimation methods (signed-rank test, P > 0.2). The analysis was also repeated across the abscissa axis with the highest density of points (blink times: 50–300 ms, monkey WL; and blink times 150–300 ms, monkey TY). Across this limited time span, the mean upper bound values were 77 ± 3 ms (median: 77.5 ms) and 64 ± 3 ms (median: 63.5 ms) for monkeys WL and TY, respectively. For monkey WL, this median upper bound was significantly different from all three methods of SSRT estimation (signed-rank test, P < 0.05). For monkey TY, in contrast, the median upper bound was not significantly different from any of the SSRT estimates (signed-rank test, P > 0.1).
FIG. 8.
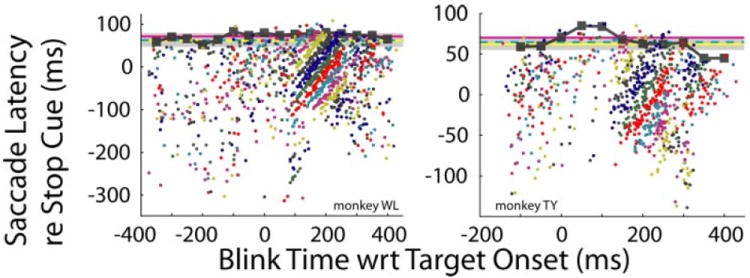
Saccade latency relative to the stop cue is plotted as a function of blink time relative to target onset. Filled squares show upper bound values derived from an extreme value distribution fit to data binned in 50-ms increments according to blink time. Changes in color represent changes in SSD, in increments of 25 ms. Horizontal lines show statistical estimates of SSRT (see text) derived from nonblink trials: red, median method; dashed cyan, mean method; yellow line and shaded area, means ± SD of integration method.
In another analysis (Fig. 9), the distributions of saccade latency relative to stop cue onset for countermanding trials with (gray squares) and without (gray circles) blinks were compared as a function of SSD. Red and blue filled squares indicate the medians, and red and blue filled circles denote the upper bound of trials with and without blinks. Significant differences in the medians (filled squares) are indicated by stars. The insets compare, for each SSD, the upper bounds of countermanding trials with and without blinks. For both monkeys, the Wilcoxon rank-sum test indicated no significant difference in the medians (P > 0.05).
FIG. 9.
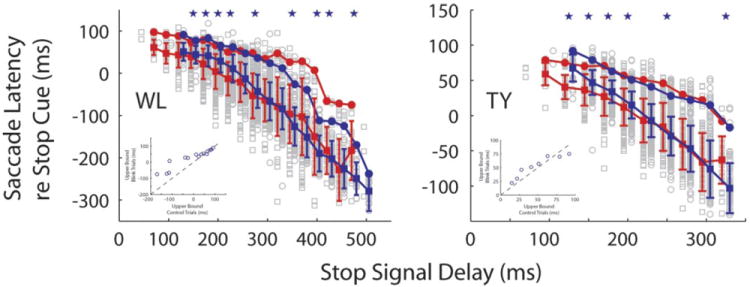
Saccade latency plotted as a function of stop cue onset for all blink times. Gray squares and circles are individual data points for countermanding trials with and without blinks, respectively. Red and blue filled squares indicate the medians of trials with and without blinks, respectively. Red and blue filled circles denote the upper bound of trials with and without blinks, respectively. For each SSD, the data have been offset slightly in x axis to facilitate visual comparison. Blue stars denote the SSDs for which the medians were significantly different (Wilcoxon test, P < 0.05). Insets: upper bound values for the two conditions are plotted against each other.
Thus these analyses collectively show that the upper bounds estimated using an extreme value function fit can be significantly different from SSRT estimates obtained using the mean, median, and integration methods. However, the significance isn’t consistent across animals and conditions. Furthermore, even when there is a statistically significant difference, the discrepancy between the two values is too small, on the order of 5 ms, to be argued as physiologically significant.
Saccade accuracy
Finally, a metrics analysis was performed on the observed saccades. The majority of blink-evoked saccades were normometric (Fig. 10A). In both monkeys, however, if the saccade was executed shortly after the appearance of the stop cue, the saccade was often hypometric. To quantify this observation, a saccade was considered hypometric if the horizontal amplitude was <75% of the target eccentricity but greater than an overestimation of the blink-induced eye perturbation (set to 4°). The timing of hypometria was further analyzed by binning the data according to saccade latency relative to stop cue onset (25-ms increments). Only trials with saccades were included in this analysis. Within each bin, the proportion of saccades that were hypometric was computed, and the resulting data are shown in Fig. 10B. Although small-amplitude saccades sometimes occurred before the stop cue, the probability of a saccade being hypometric was dramatically higher if the blink occurred between 50 and 100 ms after the stop cue appeared. This can also be appreciated in Fig. 11, which compares distributions of saccade latency relative to stop cue onset for normometric and hypometric saccades. The median saccade latencies relative to stop cue onset for hypometric saccades were 61 ms and 45 ms for monkeys WL and TY, respectively. Both medians were significantly greater than the upper bound values of the normometric distributions (signed-rank test, P < 1e-05). In contrast to countermanding trials with blinks, those without blinks were rarely hypometric (blue squares, Fig. 10).
FIG. 10.
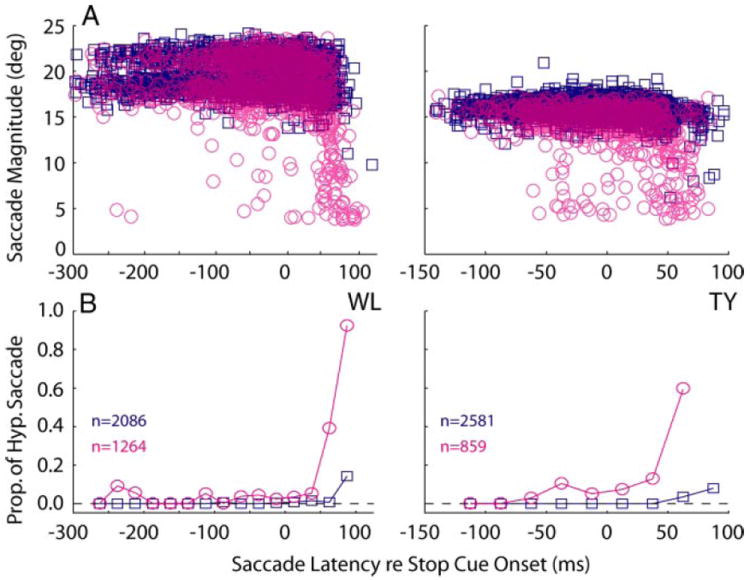
Hypometria. Saccade amplitude (A) and probability (B) of observing a hypometric saccade, given that a saccade was generated, are plotted against saccade latency relative to stop cue onset. Data are from countermanding trials with (magenta circles) and without (blue squares) blinks. For both monkeys, hypometria was rare on trials without blinks, regardless of when the saccade occurred, but more prevalent after the onset of the stop cue in the blink trials.
FIG. 11.
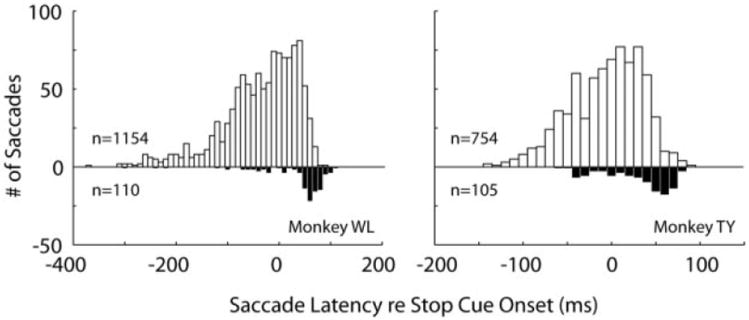
Saccade latency distributions for normometric (top) and hypometric (bottom) saccades show that the blinks induced dysmetria around the SSRT. Monkey WL: normometric saccades, −36 ± 74 (SD) ms; median, −22 ms. Extreme value distribution (EV) upper bound = 68 ms; EV mean = −3 ms. Hypometric saccades, 36 ± 69 ms; median = 61 ms. EV upper bound = 108 ms; EV mean = 61 ms. Medians of 2 distributions are significantly different (Wilcoxon test, P = 0). Median of hypometric distribution is also significantly different from upper bound of normometric saccades (signed-rank test, P = 8.2e-6). Monkey TY: normometric saccades, −6 ± 41 ms; median = −1 ms. EV upper bound = 59 ms; EV mean = 14 ms. Hypometric saccades: 31 ± 37 ms; median = 45 ms. EV upper bound = 83 ms; EV mean = 48 ms. Medians of 2 distributions are significantly different (Wilcoxon test, P = 0). Median of hypometric distribution is also significantly different from upper bound of normometric saccades (signed-rank test, P = 6.4e-10).
The temporal association between the hypometric saccades and the SSRT suggests the possibility that these are movements that are truncated by the stop process. Based on this idea, one might suppose that the peak velocities of these movements would be higher than normometric saccades of comparable amplitude. To investigate this possibility, we compared the peak velocities of hypometric saccades to amplitude-matched normometric saccades from no-blink control trials in the same animals. We found that the peak velocities of the hypometric saccades were less than half of normal. For example, in both monkeys, 10° hypometric saccades typically had peak velocities of ~200°/s. In contrast, for normometric 10° saccades, this value was generally ~500°/s and was never <400°/s (data not shown). The 95% prediction intervals for the two distributions did not overlap.
Unfortunately, this result is uninterpretable. Blinks are known to cause saccade velocities to be lower, and much more variable (Gandhi and Bonadonna 2005). The variability of main sequence relationships for blink-evoked saccades makes it impossible to perform a valid comparison between, say, hypometric 10° saccades and blink-evoked, normometric 10° saccades (i.e., visual target eccentricity of 10°). The relative timing of OPN shutdown and the development of the go process might affect the peak velocity of the movement, might differ between normometric and hypometric saccades, and cannot be experimentally controlled.
Monte Carlo simulations
Within the framework of the race model, the go and stop processes rise linearly toward a threshold, which is set to unity for both rates. The go and stop rates are treated as normally distributed random variables with means μGO and μSTOP, and SDs σGO and σSTOP. For countermanding trials without blinks, the rates of these processes have been estimated in previous studies using Monte Carlo simulations (Colonius et al. 2001; Hanes and Carpenter 1999) as well as maximum likelihood estimation (Corneil and Elsley 2005; Kornylo et al. 2003). To estimate the go and stop rates during countermanding trials with and without blinks, we used Monte Carlo simulations following the descriptions provided by previous studies (Colonius et al. 2001; Hanes and Carpenter 1999). For the parameters presented in this manuscript, a visual processing delay of 60 ms was implemented for all simulations (with and without blinks), but the optimal rates for both go and stop processes were minimally modified by the amount of delay (not shown; Hanes and Carpenter 1999).
For trials without blinks, a rate of rise variable was selected randomly from a normal distribution characterized by parameters μGO and σGO (1,000 simulation trials). The time to reach threshold was then computed as the reciprocal of the rate, and it represented the reaction time of the simulated saccade. The rate parameters were varied to minimize the Kolmogorov-Smirnov (KS) statistic between the simulated and observed latency distributions. This analysis was first performed for target-step trials. The estimated parameters are listed in Table 2, and a comparison of simulated and observed reaction times can be gauged from reciprobit plots in Fig. 12A. The procedure was also repeated for noncancelled movements generated during countermanding trials (Table 3), and, as expected, the optimal parameters of the go process were similar in the two types of trials. To estimate the parameters of the stop process, a rate of rise variable was also selected randomly from a normal distribution characterized by μSTOP and σSTOP. The onset of the stop rate was postponed by an amount equal to the SSD, and its time to reach threshold was computed. For each simulation, the process that reached threshold first won the race, resulting in either an eye movement (noncancelled trial) or maintained fixation (cancelled trial). The simulations were performed 1,000 times for each SSD, and the probability of saccade generation was computed for each SSD, which in turn yielded a simulated inhibition function. The stop rate parameters were varied to minimize the absolute deviation between the observed and simulated inhibition functions (Table 3; Fig. 12B).
TABLE 2.
Estimation of parameters for target-step trials
| μGO, s−1 | σGO, s−1 | μSHIFT, ms | σSHIFT, ms | |
|---|---|---|---|---|
| Without blinks | ||||
| Monkey WL | 5.47 | 1.48 | — | — |
| Monkey TY | 5.79 | 0.99 | — | — |
| With blinks | ||||
| Cluster 1 | ||||
| Monkey WL | 6.01 | 1.75 | — | — |
| Monkey TY | 6.85 | 1.14 | — | — |
| Cluster 2 | ||||
| Monkey WL | 9.13 | 1.80 | — | — |
| Monkey TY | 11.29 | 2.40 | — | — |
| Clusters 3 and 4 | ||||
| Monkey WL | 5.47 | 1.48 | 25 | 18 |
| Monkey TY | 5.79 | 0.99 | 20 | 14 |
FIG. 12.
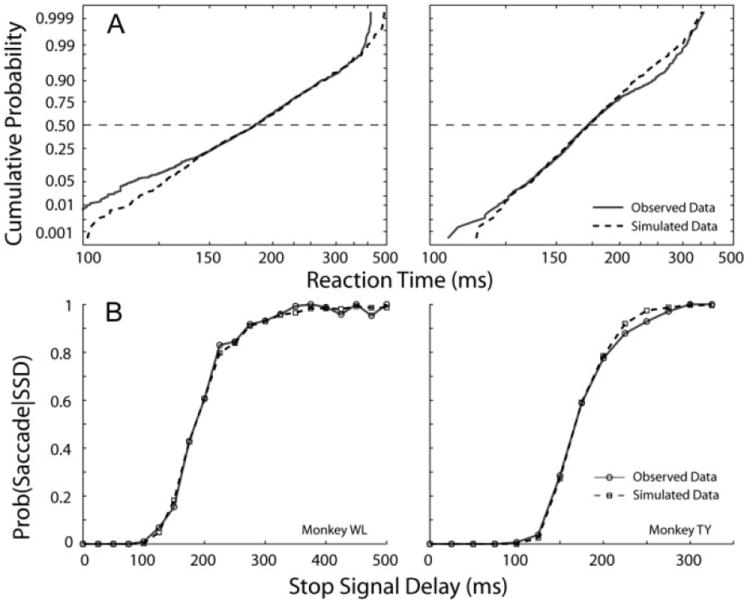
Results of Monte Carlo simulations on trials without blinks. A: reciprobit plots (Carpenter 1981) illustrating both observed (—) and simulated (- - -) reaction time distributions are shown for the 2 animals. B: observed (—, ○) and simulated (- - -, □) inhibition functions are plotted in the 2 panels.
TABLE 3.
Estimation of parameters for countermand trials
| μGO, s−1 | σGO, s−1 | μSHIFT, ms | σSHIFT, ms | μSTOP, s−1 | σSTOP, s−1 | |
|---|---|---|---|---|---|---|
| Without blinks | ||||||
| Monkey WL | 6.18 | 1.45 | — | — | 17.12 | 1.48 |
| Monkey TY | 6.06 | 0.86 | — | — | 15.40 | 1.63 |
| With blinks | ||||||
| Cluster 1 | ||||||
| Monkey WL | 7.19 | 1.75 | — | — | 13.38 | 2.73 |
| Monkey TY* | — | — | — | — | — | — |
| Cluster 2 | ||||||
| Monkey WL | 7.96 | 1.08 | — | — | 17.18 | 2.83 |
| Monkey TY | 11.93 | 1.88 | — | — | 26.37 | 2.15 |
| Clusters 3 and 4 | ||||||
| Monkey WL | 6.18 | 1.45 | 24 | 12 | 14.88 | 3.65 |
| Monkey TY | 6.06 | 0.86 | 24 | 18 | 16.13 | 3.61 |
Data corresponding to cluster 1 were not collected for monkey TY in the countermanding task because blinks evoked long before target onset produce no noticable effects on saccade reaction time (Gandhi and Bonadonna 2005).
For trials with blinks, the effects of the eyelid closure must be accounted for to estimate rates of the go process. First, consider only the target-step trials. As mentioned previously (see text pertaining to Fig. 4) and detailed elsewhere (Gandhi and Bonadonna 2005), the time of the blink relative to target onset dictates whether and how the saccade reaction time is altered. For blinks that occurred more than ~100 ms before target onset (cluster 1, Fig. 4), the saccade reaction time was constant, suggesting that blink did not perturb the go process. The parameters μGO and σGO for this range of blink times were simulated as in the no-blink condition by minimizing the KS statistic between the simulated and observed latency distributions. For blinks that occurred around target onset (~100 ms before to approximately 100 ms after) (see Gandhi and Bonadonna 2005 for a quantitative treatment of range limits), saccade latency increased linearly with blink time (cluster 2). For this subset of data, the activity representing the go response was reset to zero at the time of a blink, which was drawn from a uniform distribution with lower and upper limits defined by the range of blink times in cluster 2. Once reinitialized, the linear rise in activity did not begin to increment until 100 ms later, which represents a rough estimate of visual suppression induced by the pupil closure (Rambold et al. 2004). The time to reach threshold was computed after accounting for this blink-induced perturbation. The parameters μGO and σGO were varied to minimize the KS statistic between observed and simulated reaction times. For blink-triggered saccades (cluster 3), the blink is evoked after the eccentric target is visually processed but before the go rate reaches threshold. If the time of the blink is further delayed, the go signal reaches threshold and initiates a saccade before blink onset (cluster 4). For the data in these two clusters, the go rate was simulated from a normal distribution of mean μGO and SD σGO, and the time to reach threshold was computed. Because the effect of the blink is modeled as a decrease in the activation threshold, the rate of rise is not altered and, therefore set equal to the parameters estimated for noncancelled countermanding trials. The blink time was generated from a uniform distribution bounded by the lower blink time limit of cluster 3 and upper blink time limit of cluster 4. To model the saccade-blink interaction, the simulated threshold time was compared with the blink time. If the go process reached threshold first (cluster 4), the threshold time was treated as the reaction time. If the blink occurred before the threshold time (cluster 3), the saccade latency equaled the blink time plus a “shift” parameter, which was simulated from a normal distribution of mean μSHIFT and SD σSHIFT. A shift parameter was invoked because the observed data showed that for blink-triggered saccades (cluster 3), saccade latency and blink time exhibited some jitter relative to each other. The parameters μSHIFT and σSHIFT were varied to minimize the KS statistic between observed and simulated reaction times. Thus five parameters were used to model the saccade-blink interactions in clusters 3 and 4, but only two parameters (μSHIFT and σSHIFT) were varied to optimize the simulations. A comparison of observed and simulated reaction times for the target-step trials with blinks is illustrated in Fig. 13A for both animals, and the estimated parameters are listed in Table 2.
FIG. 13.
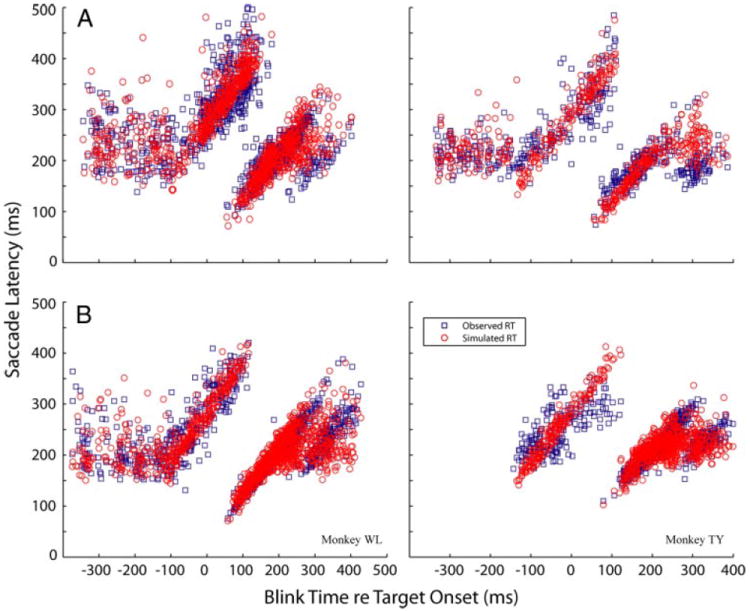
Monte Carlo simulations of the motor preparation process during blinks. Distributions of observed saccade latency (blue squares) and simulated reaction times (red circles) are plotted as a function of blink time relative to target onset for target-step trials (A) and for noncancelled subset of countermanding trials (B). The blink-induced modification of the go process depends on the timing of the blink. See text for details.
Using the same procedure described for the target-step trials with blinks, the same parameters were also estimated for the go process when the animals failed to cancel a saccade during countermanding trials with blinks. The model and simulated data are displayed in Fig. 13B and the parameters are listed in Table 3. These parameters were comparable for target-step and countermanding trials, which can also be judged from the plot in Fig. 4.
The stop process parameters (μSTOP and σSTOP) during blinks were estimated separately for the clusters 1 and 2 but combined as above for clusters 3 and 4. Using the saccade-blink interactions that apply for each cluster of data, the time to reach threshold for the go process was simulated. For each SSD, a time to reach threshold was similarly simulated for the stop process, and the values were compared to determine whether the planned movement was cancelled (stop process wins) or executed (go process wins). Repeating these simulations 1,000 times for each SSD allowed computation of probability of saccade generation for each SSD as a function of SSD (inhibition function). The parameters of the stop process were varied until the difference between the observed and simulated inhibition functions was minimized. The estimated parameters, listed in Table 3, are within the range of those obtained for performance in the countermanding task not invoking blinks (e.g., Colonius et al. 2001; Corneil and Elsley 2005; Hanes and Carpenter 1999; Kornylo et al. 2003; Mays and Morrisse 1994). This evaluation can also be assessed graphically (Fig. 14). The squares represent observed probability of saccade as a function of SSD for a limited range of blink times (represented in different colors), and the dashed traces are the logistic function fits to each subset of data; these plots are the same as those shown in Fig. 6B. The circles connected by solid lines in Fig. 14 are the simulated inhibition functions. Thus the shifts in the inhibition functions with blink times are well accounted for by a race model in which the blink affects only the go process, mainly by lowering the activation threshold, while leaving the stop process unaltered.
FIG. 14.
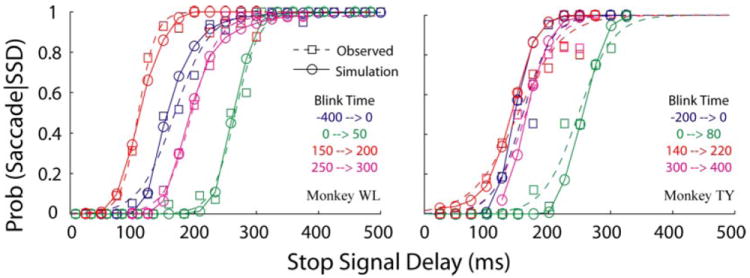
Results of Monte Carlo simulations on trials with blinks. Each panel plots 4 computed (“observed”) inhibition functions (dashed line, squares) from performance in countermanding trials. Each inhibition function, shown in a different color, was computed for a limited range of blink times, as indicated in the figure legend. These traces are the same as those plotted in Fig. 6B. The simulated inhibition function for each span of blink times is shown in the same color as circles connected by a solid line. This illustration shows that shifts in the inhibition functions can be simulated despite relatively similar stop rates across different blink times and suggests that blinks mainly modify the motor preparation process.
DISCUSSION
A depiction of the neural control of voluntary movement requires understanding how the brain cancels planned movements. The countermanding task has been used as a model paradigm to investigate both behavioral performance and the underlying neural bases (e.g., Hanes and Carpenter 1999; Hanes and Schall 1995; Lappin and Eriksen 1966; Logan and Cowan 1984; Osman et al. 1986; White et al. 1962). Performance in this paradigm is typically modeled as a race between motor preparation (go) and cancellation (stop) mechanisms, and the process that reaches its threshold first determines whether the planned movement is initiated or inhibited (Hanes and Carpenter 1999; Hanes and Schall 1995; Lappin and Eriksen 1966; Logan et al. 1984; Osman et al. 1986). The amount of time required to cancel a planned movement (SSRT) is an important psychometric parameter used to describe the role of various oculomotor structures in voluntary movement control. It represents the time taken by the stop process to reach its threshold. A caveat, however, is that the SSRT is unobservable because if the movement is successfully cancelled, there is no way to determine when the stop threshold was reached. Consequently, the SSRT value is estimated using several statistical methods that depend on numerous assumptions.
In the present study, we used a novel behavioral test, namely an eye blink, to reveal the time course of the movement cancellation process for the saccadic eye movement system. Activation of the trigeminal blink reflex can be thought of as an experimental manipulation of the finishing time of the go process. It causes OPNs to turn off (Mays and Morrisse 1994), which effectively “unmasks” the developing go process by decreasing or eliminating the threshold (Fig. 2C). Because saccades do not obligatorily follow blinks, it seems safe to say that OPN pauses result in saccades only if a motor command is present. Once the stop process reaches its threshold, saccadic preparatory activity in the superior colliculus (Paré and Hanes 2003) and the frontal eye fields (Hanes and Schall 1996; Hanes et al. 1998;), but not the lateral intraparietal eye fields (Brunamonti and Paré 2005), ceases to build toward threshold and begins to decline. Once this happens, the movement is effectively cancelled. Thus the latest epoch after stop cue presentation that a blink is able to trigger a saccade is considered representative of SSRT. Our behavioral evaluation of SSRT from trials with blinks is within the range of SSRT values estimated using statistical measures on trials without blinks (Table 1).
Our estimates of SSRT were noticeably shorter than those reported for monkeys in some previous papers (Hanes and Schall 1995; Hanes et al. 1998; Kornylo et al. 2003; Paré and Hanes 2003). It should be noted that, in each of these previous papers, visual stimuli were presented on computer monitors, whereas our stimuli were presented on an LED board. Monitor refresh rates could account for some of the discrepancy. For example, if the refresh rate is 60 Hz, the actual appearance of the stop cue will lag the signal to turn it on by an average of ~8 ms, a delay that does not exist for our LED board. Taking this into account reduces the differences between our estimates and those of Hanes and Schall (1995) to <10 ms.
Nonetheless, such short SSRTs raise questions about the possible neural substrates of the stop process. Fixation neurons have been identified in the FEF (Hanes et al. 1998) and SC (Munoz and Guitton 1989; Munoz and Wurtz 1992) that discharge tonically during periods of steady fixation and pause for saccades, attributes that suggest that they may be involved in the stop process. For example, Hanes et al. (1998) reported that the firing rate of fixation neurons in FEF declines steadily after the appearance of the peripheral target. On countermanding trials, these cells displayed a burst of spikes shortly before the estimated SSRT. Fixation neurons in superior colliculus also show evidence that they receive signals related to the stop process before the estimated SSRT (Paré and Hanes 2003). Although our SSRTs are short, they are not so short as to be inconsistent with the hypothesis that fixation neurons in FEF and/or SC are involved in the stop process. For example, visual signals can reach FEF in as little as 50 ms (Hanes et al. 1998; Schall 1991), signals from FEF can potentially reach SC within 2 ms (Segraves and Goldberg 1987) and SC can affect eye movements within 8 ms (Miyashita and Hikosaka 1996).
Blink timing effects on the race model
When not confounded by additional parameters, such as blinks, performance in the countermanding task can be modeled as a race between motor preparation (go) and cancellation (stop) mechanisms (Logan 1994; Logan and Cowan 1984; Logan et al. 1984). If the go process reaches its threshold first, a saccade is generated. If the stop process reaches its threshold first, it inhibits the go signal and cancels the planned movement. The rate of rise of each signal is characterized by a normal distribution, and implementing this stochastic trait in the model simulates very well the observed variability. Based on this formulation, the SSRT is comparable to the amount of time required by the stop mechanism to reach its threshold, and estimation of this parameter depends on three assumptions (context independence, stochastic independence, and SSD invariance), which can be verified quantitatively with the inequality tests of Colonius et al. (2001). These assumptions are fulfilled for standard countermanding tasks when the go and stop processes are not perturbed.
In contrast, introduction of a blink during the countermanding task clearly perturbs the race as evident by obvious effects of blink time on saccade latency (Fig. 4A) and inhibition functions (Fig. 6B). This perturbation results in a failure of the lower boundary condition of the inequality test (Fig. 7B). Therefore it is inappropriate to use the established statistical approaches to estimate SSRT on countermanding trials with blink, and doing so just for the sake of exercise yields physiologically unrealistic estimates (<30 ms).
Figure 4 shows that the effect of blink time on saccade latency is comparable for all target-step trials and the noncancelled subset of countermanding trials. This observation strongly implicates a profound effect of the blink on motor preparation (Gandhi and Bonadonna 2005). Hence, we performed Monte Carlo simulations of a race model in which the go rate was modified based on blink time (Fig. 13). For blink times spanned by clusters 1 and 2 (Fig. 4A), the blink resets the go activity to zero. It reinitiates integration when the visual target is processed after the duration of the blink, which was set to 100 ms as a rough estimate of pupil coverage time (Rambold et al. 2004). For blink times spanned by clusters 3 and 4, the go process is assumed to have initiated its accumulation, and the effect of the blink is modeled as elimination of the threshold. Thus if the blink occurs before the go rate reaches its threshold, the time of the blink plus a “shift” term equals the saccade reaction time. This go response, modified by the blink, was raced against a stop process to determine execution or cancellation of the planned movement. The parameters that best simulated the observed behavioral performance are comparable to the parameters obtained when there was no blink perturbation (Tables 2 and 3), lending credence to our hypothesis that the blink acts to eliminate or decrease the threshold for the motor preparation mechanism.
While we have modeled the effect of blink as a perturbation of the motor-preparation process, it is worthwhile to address whether the movement cancellation mechanism is modified in any meaningful way. Blinks, of course, involve the closing of the eyes, during which visual signals are unavailable. At a minimum, if the stop cue appears during the blink, the development of the stop process will be delayed by the eyelid closure. However, if SSD is long enough to permit the go process to begin to develop and the blink coincides with the appearance of the stop cue, the saccade will be triggered and the movement cancellation process will never initiate. For the blink to interact with the stop process, the eye perturbation must be evoked after the stop cue signal is presented and processed. The effective interval and the likelihood of evoking a saccade after the stop cue presentation was comparable in countermanding trials with and without blinks (Fig. 9) and, furthermore, the behavioral evaluation and statistical estimate of SSRT are comparable. Thus it appears that the blink did not compromise movement cancellation mechanisms.
One may also ask whether collicular and frontal eye field fixation neurons, the reactivation of which precedes the SSRT (Hanes and Schall 1996; Hanes et al. 1998; Paré and Hanes 2003), turn off for blinks and, if so, whether this means that blinks interfere with the stop process. To date, no published studies have involved recording from these neurons during puff-evoked blinks. If fixation cells do turn off for blinks, this would co-occur with the shutoff of OPNs, which should trigger a saccade if a motor command is actively developing. In any case, it seems unlikely that blinks significantly affect the stop process, given the fact that the upper bound saccade latency for countermand-blink trials is highly similar to the upper bound latency for countermanding trials without blinks, and also approximately corresponds to the time at which hypometric saccades are likely to occur.
One should also consider potential violations of key assumptions of the race model in the blink condition. The race model and the existing statistical approaches for estimation of SSRT make the assumption that the go and stop processes are essentially independent—a premise that has been tested in several previous studies. On one hand, some studies have supported the independence of the go and stop processes (for example, see Hanes et al. 1998). On the other hand, Öyzurt et al. (2003) reported violations of this assumption in humans when auditory stop cues were used. Despite the importance of this issue for the race model, the present results should be relatively insensitive to violations of this assumption. Suppose, for example, that the stop process actively inhibits the go process during the race. In that event, the go process might develop more slowly. However, this would not change the fact that turning off the OPNs should trigger saccades as long as the go process is building up toward its threshold, and saccades should not be triggered once the stop process has reached its threshold. Thus the blink paradigm permits the estimation of SSRT without making an assumption that has been challenged in recent published work.
Hypometric saccades
On countermanding trials, when a blink occurred between 50 and 100 ms after the onset of the stop cue, grossly hypometric saccades were often triggered. Hypometric saccades have been previously reported in association with countermanding tasks (Colonius et al. 2001; Özyurt et al. 2003). In the present study, this phenomenon was found to be far more common on countermanding-blink trials than any other trial type, suggesting that the stop cue and the blinks interact in some way to produce hypometria.
Although blinks are associated with small amplitude eye movements (Mays and Morrisse 1994), several lines of evidence strongly imply that the dysmetric saccades observed in the present study are actual saccades that are falling short of the target. First, the hypometric saccades were always in the direction of the target, whereas blink-associated eye movements were often in the wrong direction. Second, blink-associated eye movements were consistently <4°, whereas hypometric saccades were found across a wide range of amplitudes. Finally, blink-associated eye movements displayed no relationship with blink timing, but hypometric saccades rarely occurred unless the blink was between 50 and 100 ms after the onset of the stop cue, similar to the behavioral estimate of SSRT on countermanding trials without blinks. These dysmetric saccades were relatively rare for countermanding trials without blinks, as well as for target step trials (with or without blinks).
It may be suggested that hypometric saccades occur simply because the blink triggers a movement that is only partially developed. If the issue was this simple, however, hypometric saccades should have occurred at shorter latencies than normometric ones, but the opposite was found. Dysmetric movements tended to begin later in time and were usually temporally near the estimated SSRT. Furthermore, the fact that blinks triggered shortened movements far more frequently on countermanding trials than on target step trials implicates the stop command as an important causative factor.
These observations suggest the possibility that both the blink and the completion of the stop process may contribute to the occurrence of hypometria on countermanding trials. This could occur through at least two mechanisms. First, saccades are prolonged if they are triggered by a blink, (Goossens and Van Opstal 2000; Rambold et al. 2004) presumably due to lower firing rates of saccade-related neurons at the onset of the movement. A longer duration would provide more opportunity for the stop process to cut the movement short. Second, because blinks effectively lower the threshold for saccade initiation, a saccade could be triggered after the stop process has reached threshold when saccade related activity is declining but has yet to cease. In this case, hypometria might occur if saccade-related activity is rapidly suppressed before the feedback loop would have normally ended the movement. This situation is quite different from a saccade that is triggered early while motor activity is still developing. In this latter case, saccade-related activity develops normally and the movement is stopped by the feedback loop. As a result, these early saccades are normometric. These possibilities are not mutually exclusive, and it could be that both mechanisms contribute to the occurrence of hypometria on countermanding trials with blinks.
Acknowledgments
The authors are grateful to C. Bryant and K. Pearson for computer programming, Drs. C. Balaban and B. Corneil for discussions on parameter estimation techniques, G. Duffy and S. Greene for general assistance, and B. Hughes and T. Wheeler for machining services.
GRANTS
This study was supported by National Eye Institute Grants EY-015485 to N. J. Gandhi and EY-015060 to M.M.G. Walton and the University of Pittsburgh Eye and Ear Foundation.
References
- Asrress KN, Carpenter RH. Saccadic countermanding: a comparison of central and peripheral stop signals. Vision Res. 2001;41:2645–2651. doi: 10.1016/s0042-6989(01)00107-9. [DOI] [PubMed] [Google Scholar]
- Brunamonti E, Paré M. Neural control of saccade production studied with the countermanding paradigm: parietal cortex area LIP. Soc Neurosci Abstr. 2005 166.118. [Google Scholar]
- Bryant CL, Gandhi NJ. Real-time data acquisition and control system for the measurement of motor and neural data. J Neurosci Methods. 2005;142:193–200. doi: 10.1016/j.jneumeth.2004.08.019. [DOI] [PMC free article] [PubMed] [Google Scholar]
- Cabel DW, Armstrong IT, Reingold E, Munoz DP. Control of saccade initiation in a countermanding task using visual and auditory stop signals. Exp Brain Res. 2000;133:431–441. doi: 10.1007/s002210000440. [DOI] [PubMed] [Google Scholar]
- Carpenter RHS. Oculomotor procrastination. In: Fischer DF, Monty RA, editors. Eye Movements: Cognition and Visual Perception. Hillsdale, NJ: Erlbaum; 1981. pp. 237–246. [Google Scholar]
- Cohen B, Henn V. Unit activity in the pontine reticular formation associated with eye movements. Brain Res. 1972;46:403–410. doi: 10.1016/0006-8993(72)90030-3. [DOI] [PubMed] [Google Scholar]
- Colonius H, Özyurt J, Arndt PA. Countermanding saccades with auditory stop signals: testing the race model. Vision Res. 2001;41:1951–1968. doi: 10.1016/s0042-6989(01)00084-0. [DOI] [PubMed] [Google Scholar]
- Corneil BD, Elsley JK. Countermanding eye-head gaze shifts in humans: marching orders are delivered to the head first. J Neurophysiol. 2005;94:883–895. doi: 10.1152/jn.01171.2004. [DOI] [PubMed] [Google Scholar]
- Curtis CE, Cole MW, Rao VY, D’Esposito M. Canceling planned action: an FMRI study of countermanding saccades. Cereb Cortex. 2005;15:1281–1289. doi: 10.1093/cercor/bhi011. [DOI] [PubMed] [Google Scholar]
- Evinger C, Manning KA, Pellegrini JJ, Basso MA, Powers AS, Sibony PA. Not looking while leaping: the linkage of blinking and saccadic gaze shifts. Exp Brain Res. 1994;100:337–344. doi: 10.1007/BF00227203. [DOI] [PubMed] [Google Scholar]
- Fuchs AF, Ling L, Kaneko CRS, King WM, Usher SD. The timing of the response of brain stem omni-pause neurons relative to saccadic eye movements in rhesus monkeys. Soc Neurosci Abstr. 1991;17:462. [Google Scholar]
- Gandhi NJ, Bonadonna DK. Temporal interactions of air-puff evoked blinks and saccadic eye movements: Insights into motor preparation. J Neurophysiol. 2005;93:1718–1729. doi: 10.1152/jn.00854.2004. [DOI] [PMC free article] [PubMed] [Google Scholar]
- Goossens HH, Van Opstal AJ. Blink-perturbed saccades in monkey. I Behavioral analysis. J Neurophysiol. 2000;83:3411–3429. doi: 10.1152/jn.2000.83.6.3411. [DOI] [PubMed] [Google Scholar]
- Hanes DP, Carpenter RH. Countermanding saccades in humans. Vision Res. 1999;39:2777–2791. doi: 10.1016/s0042-6989(99)00011-5. [DOI] [PubMed] [Google Scholar]
- Hanes DP, Patterson WF, 2nd, Schall JD. Role of frontal eye fields in countermanding saccades: visual, movement, and fixation activity. J Neurophysiol. 1998;79:817–834. doi: 10.1152/jn.1998.79.2.817. [DOI] [PubMed] [Google Scholar]
- Hanes DP, Schall JD. Countermanding saccades in macaque. Vis Neurosci. 1995;12:929–937. doi: 10.1017/s0952523800009482. [DOI] [PubMed] [Google Scholar]
- Hanes DP, Schall JD. Neural control of voluntary movement initiation. Science. 1996;274:427–430. doi: 10.1126/science.274.5286.427. [DOI] [PubMed] [Google Scholar]
- Ito S, Stuphorn V, Brown JW, Schall JD. Performance monitoring by the anterior cingulate cortex during saccade countermanding. Science. 2003;302:120–122. doi: 10.1126/science.1087847. [DOI] [PubMed] [Google Scholar]
- Jarrett CB, Barnes GR. The volitional inhibition of anticipatory ocular pursuit using a stop signal. Brain Res Cogn Brain Res. 2003;17:759–769. doi: 10.1016/s0926-6410(03)00200-3. [DOI] [PubMed] [Google Scholar]
- Kornylo K, Dill N, Saenz M, Krauzlis RJ. Canceling of pursuit and saccadic eye movements in humans and monkeys. J Neurophysiol. 2003;89:2984–2999. doi: 10.1152/jn.00859.2002. [DOI] [PubMed] [Google Scholar]
- Lappin JS, Eriksen CW. Use of a delayed signal to stop a visual reaction-time response. J Exp Psychol. 1966;72:805–811. [Google Scholar]
- Logan GD. On the ability to inhibit thought and action: a user’s guide to the stop signal paradigm. In: Dagenbach D, Carr TH, editors. Inhibitory Processes in Attention, Memory and Language. San Diego, CA: Academic; 1994. pp. 189–239. [Google Scholar]
- Logan GD, Cowan WB. On the ability to inhibit thought and action: a theory of an act of control. Psychol Rev. 1984;91:295–327. doi: 10.1037/a0035230. [DOI] [PubMed] [Google Scholar]
- Logan GD, Cowan WB, Davis KA. On the ability to inhibit simple and choice reaction time responses: a model and a method. J Exp Psychol Hum Percept Perform. 1984;10:276–291. doi: 10.1037//0096-1523.10.2.276. [DOI] [PubMed] [Google Scholar]
- Logan GD, Irwin DE. Don’t look! Don’t touch! Inhibitory control of eye and hand movements. Psychon Bull Rev. 2000;7:107–112. doi: 10.3758/bf03210728. [DOI] [PubMed] [Google Scholar]
- Mays LE, Morrisse DW. Activity of pontine omnipause neurons during eye blinks. Soc Neurosci Abstr. 1994;20:1404. [Google Scholar]
- Miyashita N, Hikosaka O. Minimal synaptic delay in the saccadic output pathway of the superior colliculus studied in awake monkey. Exp Brain Res. 1996;112:187–196. doi: 10.1007/BF00227637. [DOI] [PubMed] [Google Scholar]
- Morein-Zamir S, Nagelkerke P, Chua R, Franks I, Kingstone A. Inhibiting prepared and ongoing responses: is there more than one kind of stopping? Psychon Bull Rev. 2004;11:1034–1040. doi: 10.3758/bf03196733. [DOI] [PubMed] [Google Scholar]
- Munoz DP, Guitton D. Fixation and orientation control by the tectoreticulo-spinal system in the cat whose head is unrestrained. Rev Neurol. 1989;145:567–579. [PubMed] [Google Scholar]
- Munoz DP, Wurtz RH. Role of the rostral superior colliculus in active visual fixation and execution of express saccades. J Neurophysiol. 1992;67:1000–1002. doi: 10.1152/jn.1992.67.4.1000. [DOI] [PubMed] [Google Scholar]
- Osman A, Kornblum S, Meyer DE. The point of no return in choice reaction time: controlled and ballistic stages of response preparation. J Exp Psychol Hum Percept Perform. 1986;12:243–258. doi: 10.1037//0096-1523.12.3.243. [DOI] [PubMed] [Google Scholar]
- Özyurt J, Colonius H, Arndt PA. Countermanding saccades: evidence against independent processing of go and stop signals. Percept Psychophys. 2003;65:420–428. doi: 10.3758/bf03194573. [DOI] [PubMed] [Google Scholar]
- Paré M, Hanes DP. Controlled movement processing: superior colliculus activity associated with countermanded saccades. J Neurosci. 2003;23:6480–6489. doi: 10.1523/JNEUROSCI.23-16-06480.2003. [DOI] [PMC free article] [PubMed] [Google Scholar]
- Rambold H, El Baz I, Helmchen C. Differential effects of blinks on horizontal saccade and smooth pursuit initiation in humans. Exp Brain Res. 2004;156:314–324. doi: 10.1007/s00221-003-1791-z. [DOI] [PubMed] [Google Scholar]
- Schall JD. Neuronal activity related to visually guided saccades in the frontal eye fields of rhesus monkeys: comparison with supplementary eye fields. J Neurophysiol. 1991;66:559–579. doi: 10.1152/jn.1991.66.2.559. [DOI] [PubMed] [Google Scholar]
- Segraves MA, Goldberg ME. Functional properties of corticotectal neurons in the monkey’s frontal eye field. J Neurophysiol. 1987;58:1387–1419. doi: 10.1152/jn.1987.58.6.1387. [DOI] [PubMed] [Google Scholar]
- Stuphorn V, Taylor TL, Schall JD. Performance monitoring by the supplementary eye field. Nature. 2000;408:857–860. doi: 10.1038/35048576. [DOI] [PubMed] [Google Scholar]
- VanderWerf F, Brassinga P, Reits D, Aramideh M, Ongerboer de Visser B. Eyelid movements: behavioral studies of blinking in humans under different stimulus conditions. J Neurophysiol. 2003;89:2784–2796. doi: 10.1152/jn.00557.2002. [DOI] [PubMed] [Google Scholar]
- Walton MM, Gandhi NJ. Blink-evoked saccades in a countermanding saccade task. Soc Neurosci Abstr. 2005 859.810. [Google Scholar]
- White CT, Eason RG, Bartlett NR. Latency and duration of eye movements in the horizontal plane. J Opt Soc Am. 1962;52:210–213. doi: 10.1364/josa.52.000210. [DOI] [PubMed] [Google Scholar]


