

Abstract
N-methyl-D-aspartate glutamate receptor (NMDA-R) antagonists produce schizophrenia-like positive and negative symptoms in healthy human subjects. Preclinical research suggests that NMDA-R antagonists interfere with the function of gamma-aminobutyric acid (GABA) neurons and alter brain oscillations. These changes have been hypothesized to contribute to psychosis. In this investigation, we evaluated the hypothesis that the NMDA-R antagonist ketamine produces alterations in cortical functional connectivity during rest that are related to symptoms. We administered ketamine to a primary sample of twenty-two subjects and to an additional, partially overlapping, sample of twelve subjects. Symptoms before and after the experimental session were rated with the Positive and Negative Symptom Scale (PANSS). In the primary sample, functional connectivity was measured via functional magnetic resonance imaging almost immediately after infusion began. In the additional sample, this assessment was repeated after 45 minutes of continuous ketamine infusion. Global, enhanced functional connectivity was observed at both timepoints and this hyperconnectivity was related to symptoms in a region-specific manner. This study supports the hypothesis that pathological increases in resting brain functional connectivity contribute to the emergence of positive and negative symptoms associated with schizophrenia.
Keywords: N-methyl-D-aspartate, gamma-aminobutyric acid, ketamine, functional connectivity, psychosis, schizophrenia
N-methyl-D-aspartate glutamate receptor (NMDA-R) antagonist drugs induce psychosis in healthy humans.1–6 NMDA-R antagonists produce symptoms more closely resembling the positive and negative symptoms of schizophrenia than do amphetamine or serotonergic hallucinogens.1, 4–7 The degree to which ketamine produces negative symptoms is related to the degree of its occupancy of NMDA-R receptors.8 Other neuroimaging data suggest that the production of schizophrenia-like symptoms by ketamine is associated with frontal cortical activation, as suggested by increased frontal cortical perfusion, 9–11 cortical glucose metabolism, 12, 13 and glutamate levels. 14
NMDA-R antagonists increase cortical activation and alter brain functional connectivity by inhibiting NMDA-Rs on GABA interneurons within local circuits. 15–18 NMDA-R inhibition of GABA interneurons and disinhibition of pyramidal neurons are consistent with reductions of extracellular GABA levels and elevations of extracellular glutamate levels. 19–21 Further, cognitive and behavioral effects of NMDA-R antagonists may be reduced by facilitating GABA neurotransmission 22 or by reducing glutamatergic hyperactivation. 23–25 NMDA-R antagonists also increase cortical high frequency or gamma oscillations in animals, an effect hypothesized to contribute to psychosis. 26, 27 Recent pharmacogenetic and optogenetic studies of the hippocampus elegantly show that inactivation of somatostatin but not parvalbumin GABA neurons increases cortical gamma oscillations. 28, 29 Thus, NMDA-R antagonists may produce a pathological increase in cortical oscillations by inhibiting activation of subpopulations of GABA interneurons.
In this study, we test the hypothesis that positive and negative symptoms produced by NMDA-R antagonists emerge in the context of altered brain functional connectivity as measured by functional magnetic resonance imaging (fMRI). In searching for connectivity alterations, we collected fMRI data during resting on and off ketamine and analyzed it using a relatively new technique called “global-based connectivity” [GBC]. 30–32 It assesses the correlational strength of each voxel with all the other voxels in the brain. Though GBC represents a global measure of each voxel’s connectivity, particular cortical regions can have greater global connectivity than others. Thus, GBC was originally developed to detect areas of high connectivity or “hubs” in the brain.30 In this investigation, we used GBC to assess whether ketamine induces region-specific or overall changes in connectivity and whether these changes would relate to ketamine-evoked psychiatric symptoms.
Methods
Participants
Our primary sample was composed of 22 right-handed healthy volunteers (14 male) between 21–44 years old. In addition, we report data after 45 minutes of ketamine infusion from an additional sample of 12 healthy volunteers (6 male, ages 22 to 45, all right-handed). This second sample included four individuals from the initial sample. All subjects in both samples denied a history of neurological disorder, substance abuse or dependence, or other psychiatric illness, and did not have a first degree relative with substance abuse or psychiatric history. The protocol was approved by the Yale Human Investigations Committee and the Western Institutional Review Board. All subjects provided written informed consent.
Procedures
Screening
Subjects were assessed using a structured interview for diagnosing psychiatric disorder, SCID-NP. 33 Psychotic-like symptoms were assessed with the Perceptual-Aberration – Magical Ideation and the Revised Social Anhedonia Scale. 34–36 Descriptive statistics are displayed in Table 1. First degree family history of psychiatric disorder was assessed with the Family History Assessment Module. 37 An outside informant (typically a spouse, parent, or close relative) was asked to verify psychiatric, substance abuse and medical history. Participants received a physical exam including urine drug screen, breathalyzer test, full blood count, and clinical chemistry. They were eliminated if they were not in good physical health, had an Axis I psychiatric disorder or a first degree relative with an Axis I psychiatric disorder or scored higher than 2 standard deviations above the norm on the tests of psychotic-like symptoms.
Table 1.
Scales of Psychosis-Proneness: Descriptive Statistics
| Sample | Measure | Perceptual Aberration-Magical Ideation | Revised Social Anhedonia |
|---|---|---|---|
| Primary Sample (n = 22) | Mean (SD) | 4.1 (3.1) | 4.8 (3.9) |
| Range | 0–9 | 0–15 | |
| Additional Sample (n = 12) | Mean (SD) | 1.5 (1.4) | 5.5 (4.8) |
| Range | 0–4 | 0–16 |
Imaging Day
Participants who passed screening were scheduled for an experimental session. Female subjects were scheduled so they were in the follicular phase, if at all possible. On the morning of the scan, participants were assessed with the Positive and Negative Syndrome Scale [PANSS]. 38 Two intravenous catheters were placed: one for infusing saline and later ketamine, and another for drawing blood samples. Participants were placed in a 3 Tesla Trio scanner. The subjects in the primary sample were scanned with a volume coil and the additional sample was scanned after a TIMS upgrade. Each subject’s pulse, respiration, oxygen saturation and heart rate were monitored throughout the scanning session.
After acquisition of structural images, functional imaging commenced with a visual fixation scan during which participants looked at a projected cross. Stimuli were back-projected onto a mirror. Seventy-five seconds into the scan, participants received a saline bolus. They then received a constant saline infusion and completed eight task scans lasting approximately 40 minutes. Results related to task will be reported elsewhere.
Following these saline infusion scans, the visual fixation scan and eight task scans were repeated with ketamine infusion. The initial ketamine bolus was 0.23 mg/kg over 1 min and the subsequent constant infusion was 0.58 mg/kg/hour. The total ketamine infusion time was approximately 45 minutes and the volume of the saline bolus and infusion were comparable to that of the ketamine bolus and infusion. Blood samples were taken approximately 5, 25 and 45 minutes after the start of each bolus. Ketamine levels were later determined by a previously published method. 39 The entire scanning session lasted approximately 2–2.5 hours. The additional sample of 12 subjects received, after the final task scan, an extra resting scan with continued constant ketamine infusion. Afterwards, participants were removed from the scanner and reassessed with the PANSS. Ratings considered their entire ketamine experience.
Scan Parameters
Scanning began with acquiring structural images. We obtained a high-resolution three-dimensional anatomic image sequence (1 slab of 160 1mm slices, field of view 200 × 200, TI = 800, TR1500, TE 2.83, NEX = 1, FA = 15, matrix 256 × 256 voxels). Twenty-four axial-oblique slices (5 mm) were prescribed parallel to the anterior-posterior commissural line with a 300 ms repetition time, 200 × 200 field of view and matrix size of 256 × 256. FMRI images were acquired with the same slice selection and a repetition time of 1500 ms, echo time of 30 ms, flip angle of 80 degrees, matrix size of 64 × 64 and a field of view 200 × 200 mm using T2*-sensitive gradient-recalled single shot echo-planar pulse sequence. Each subject completed 18 scans of 166 image volumes including six initial images that were later discarded. The same acquisition sequence was used for task and resting runs.
Imaging Analysis
Preprocessing and primary analyses were conducted with the FMRIB Software Library (FSL, http://www.fmrib.ox.ac.uk/fsl). Global connectivity was computed in Analysis of Functional Images (AFNI).40 The maps correlating performance and PANSS symptoms with connectivity alterations were computed with custom software written for this purpose. All maps were corrected for multiple comparisons with 3dClustSim, a cluster correction procedure available in AFNI. The program determined a minimum cluster size with Monte Carlo simulation so as to achieve a corrected significance of p <0.05 with a voxelwise threshold of p < 0.05.
Pre-processing
In brief, data were converted into NIFTI (Neuroimaging Informatics Technology Initiative) format and brain extraction was performed to delete non-brain elements.41 Then images were corrected to the middle image of the run for motion using MCFLIRT, 42 corrected for slice-timing, smoothed with a Gaussian kernel of FWHM 5mm and normalized with a single multiplicative factor. Voxelwise temporal auto-correlation was estimated and corrected using FMRIB’s Improved Linear Model (FILM). 43 Images used in the analyses reported here were low-pass filtered with a cut-off frequency of 0.08 Hz. Registration was achieved by co-registering each individual’s co-planar image to their high-resolution structural scan. Then the high-resolution structural scan was co-registered to the MNI standard brain supplied with FSL.
Runs with motion > 2 mm in the z, y or z direction or > 3 degrees of pitch, yaw or roll were eliminated. In the entire sample, a total of two runs were eliminated. Motion correction parameters derived on an individual basis were converted to measures of absolute distance from the center of the brain. These measures were analyzed and no statistically significant differences related to drug were found.
Connectivity Analyses
To examine global changes in connectivity under ketamine, we conducted a whole-brain connectivity analysis using the AFNI (http://afni.nimh.nih.gov/afni) instacorr function that computes the correlation between each voxel and all the other voxels in the brain and returns an average correlation for each voxel. To compare the global connectivity score distributions under saline and ketamine, we first created a statistical map at the group level representing their difference. We then computed a one-sample t-test on all the brain voxels. Because of the very large sample (> 220,000 voxels), the test statistic is reported as a z and effect sizes are included. In order to achieve a relatively stable ketamine level, we used the last 50 images of the saline and ketamine bolus scans (primary subject sample). Since ketamine levels were stable throughout the entire scan, the entire ketamine scan was compared to the entire saline bolus scan for the analysis of resting data collected after 45 minutes of ketamine infusion (additional sample). The effect sizes for the initial and repeat resting periods are not directly comparable because they were computed on 50 and 160 images per condition, respectively.
We performed analyses relating GBC to the positive, negative and cognitive factors44 of the PANSS. “Positive” refers to psychotic-like symptoms, “negative” to social withdrawal and blunted affect, and “cognitive” to thought disorder and poor concentration. We chose these three factors because they have most consistently emerged in factor analyses. 45–48 To assess whether overall changes in GBC were related to PANSS factor scores, we counted the number of voxels in an individuals’ saline and ketamine maps whose z score was higher than 1.96 and subtracted the saline voxel count from the ketamine voxel count. This connectivity measure was then correlated with each of the PANSS factors scores.
To assess whether region-specific changes in GBC were related to PANSS factors scores, we created statistical maps depicting the correlation between change in an outcome variable (positive, negative or cognitive factor score) and each voxel’s GBC change. The resulting correlation maps were then converted to p-maps and cluster-corrected. All clusters were screened for outliers by graphing individual’s average connectivity change score for a cluster against their outcome variable score. No outliers were found.
Results
Mean blood plasma ketamine levels were stable in the participants (n = 22) throughout the scanning session (+5 minutes 140.9 ±58 ng/ml, +25 minutes 133.5 ±30 ng/ml, +45 minutes 161.7 ±33 ng/ml). Group maps depicting the mean difference between saline and ketamine GBC revealed a marked overall increase in GBC (z = 3.76, p < 0.0001, d′ = 0.79) as shown in Fig. 1A. This increase occurred across all voxels in the brain, and further examination indicated no discrete clusters of increased GBC within this overall pattern (Fig. 1, B–C). This overall hyperconnectivity was also observed in an additional fMRI rest acquisition obtained after 45 minutes of ketamine infusion in a supplemental sample of twelve individuals (Fig 1D, z = 4.03, p < 0.0001, d′ = 0.85).
Fig. 1.
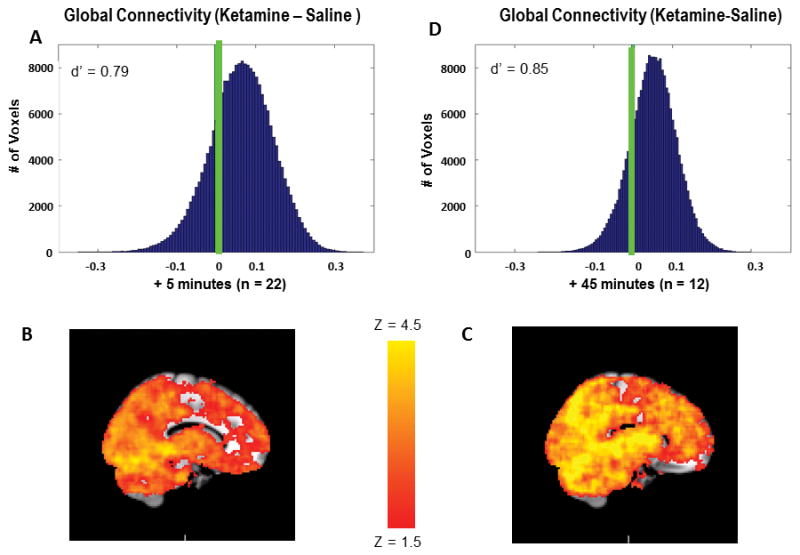
Ketamine increases GBC in the brain. A) Distribution of GBC change scores for all voxels in the group connectivity map (ketamine-saline) immediately after the bolus (primary sample). Green line indicates 0, the predicted mean under the null hypothesis. B) Mean group connectivity map under saline immediately after bolus. C) Mean group connectivity map under ketamine immediately after bolus D) Distribution of GBC change scores for all voxels in the group connectivity map (ketamine-saline) after 45 minutes of continuous ketamine infusion (additional sample). Green line indicates 0, the predicted mean under the null hypothesis.
Ketamine increased negative, positive and cognitive symptoms as measured by the PANSS (Fig 2). There was no statistically significant relationship between the number of voxels with increased GBC under ketamine and ketamine blood plasma levels measured after the bolus scan nor was there a relationship with PANSS factor scores. However, analysis of the statistical maps in which the individual voxel’s GBCs were correlated with symptom scores revealed region-specific relationships between GBC and positive and negative, but not cognitive, symptoms
Fig 2.
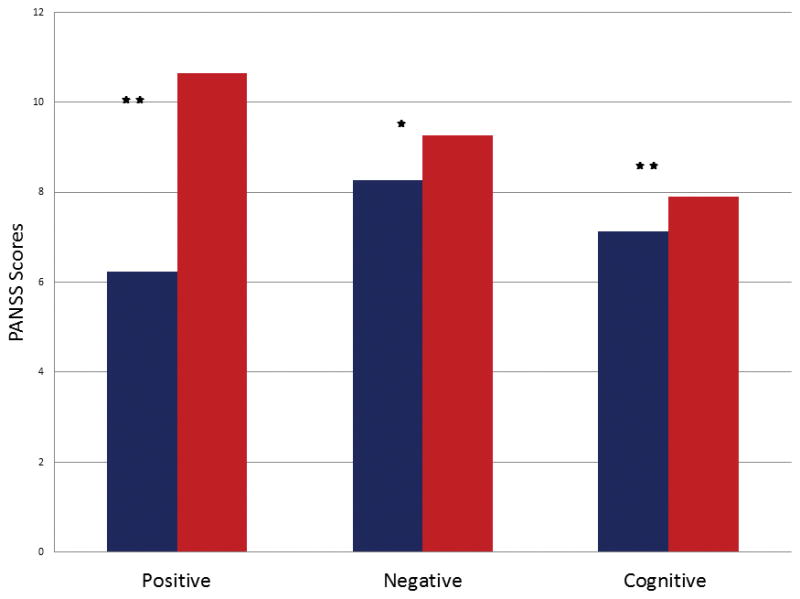
PANSS factor scores during saline (blue) and ketamine (red). * = <0.05, * * = <0.001.
Region-specific areas in which GBC changes predicted symptoms consisted of six clusters related to positive symptoms and one cluster related to negative symptoms. Many regions identified by GBC predicted positive symptoms (r = 0.56 – 0.65; Table 2, Fig. 3). The most extensive cluster ranged from orbital frontal cortex to anterior cerebellar vermis. Within this cluster, the structures whose change in GBC was most closely associated with positive symptoms (p < 0.01) were the right insula, right planum temporale, bilateral pulvinar nuclei, left lingual gyrus and anterior cerebellar vermis. In all clusters, increases in GBC were associated with increased positive symptoms. In contrast to the extensive brain areas correlated with positive symptoms, areas related to negative symptoms were quite circumscribed. Individuals who, under ketamine, increased GBC in the dorsal and medial anterior striatum and the thalamus (area of the ventral lateral nucleus) were less likely to experience negative symptoms than individuals who had stable or decreased GBC in these regions (r = −0.63, Fig 4).
Table 2.
Descriptive Statistics on Clusters in which Change in Global Connectivity (Ketamine-Saline) is Significantly Correlated with Increase in Positive Symptoms
| Center of Mass | |||||||
|---|---|---|---|---|---|---|---|
| Area | Cluster # | # of Voxels | Volume (mm3) | X | Y | Z | r |
| Middle occipital gyrus, L | 1 | 243 | 1944 | −33 | −79 | 13 | 0.61 |
| Parietal operculum, L | 2 | 257 | 2056 | −46 | −25 | 17 | 0.56 |
| Insula, L | 3 | 294 | 2352 | −43 | 5 | −5 | 0.57 |
| Pre-central gyrus, L | 4 | 314 | 2512 | −47 | −11 | 38 | 0.57 |
| Medial frontal gyrus, L | 5 | 346 | 2768 | −9 | 45 | 20 | 0.63 |
| Middle frontal gyrus, R | 6 | 619 | 4952 | 38 | 39 | 24 | 0.63 |
| Paracentral lobule, bilateral | 7 | 2059 | 16472 | 0 | −21 | 49 | 0.58 |
| Posterior areas, bilateral | 8 | 8980 | 71840 | 12 | −33 | −3 | 0.65 |
Note. L = left, R = right
Fig. 3.
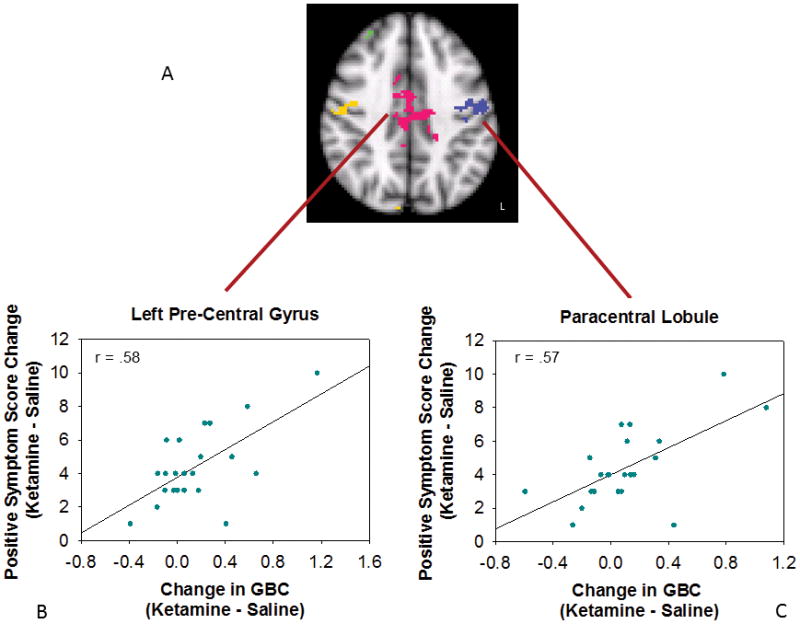
Areas in which increased global connectivity during ketamine was associated with greater increases in positive symptoms. A) Cluster map, axial slice. Each cluster is shown in a different color. Relationship between change in positive symptoms and GBC change in B) paracentral lobule and C) left precentral gyrus.
Fig. 4.
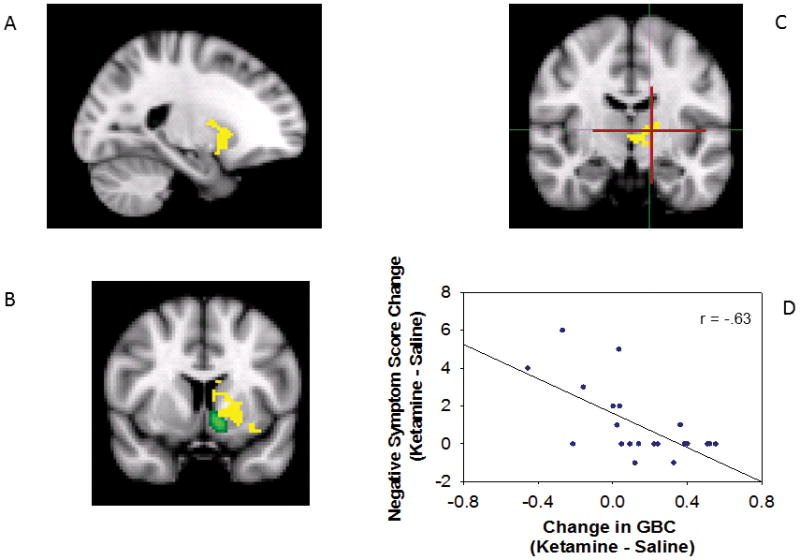
Areas in which increased global connectivity during ketamine was associated with greater increases in negative symptoms, all voxels are in a single cluster with volume of 440 voxels, 3520 mm3, center-of-mass −18, 4, 1. A) saggital view, B) coronal view at the level of the anterior commissure, anterior-posterior (A-P) = 8. Nucleus accumbens shown in green [Harvard-Oxford Subcortical Atlas supplied in FSL], C) coronal view caudal to the anterior commissure, A-P = −12. Ventral lateral nucleus shown in cross-hairs [Talairach Daemon Labels supplied in FSL].
Discussion
The primary finding from this study is that ketamine increased overall brain GBC. The finding that ketamine increased GBC at rest may be consistent with other evidence that NMDA-R antagonists increase gamma oscillations 26, 27, 49, 50 The increase in resting GBC was a relatively stable feature of ketamine effects on the brain, as it was observed when sampled almost immediately after ketamine infusion began and was present after 45 minutes of ketamine infusion.
Also, regionally-specific increases in GBC produced by ketamine were linked to positive and negative, but not cognitive, symptoms. However, the negative finding regarding cognitive symptoms is best considered equivocal because we lacked a detailed, neurocognitive assessment during ketamine infusion. Overall, the findings in this paper illustrate the complexity of the relationship between GBC and symptoms. Had there been a uniform relationship between GBC and symptom changes, this study would have supported the hypothesis that GBC was a simple biomarker for symptoms. But this was not the case. In the current study, some increases in GBC produced by ketamine were markers of network dysfunction, psychosis in this case, perhaps reflecting pathological synchrony in networks that are normally more functionally distinct. In the current study, many of the hypersynchronous regions are implicated in interoceptive and/or exteroceptive sensory processing, suggesting a link between psychosis and abnormal sensory processing 51–55.
In contrast, increased GBC in a few, circumscribed areas was associated with reduced negative symptoms, suggesting that increased GBC under ketamine was related to enhanced cortical function rather than pathology. These areas were in the thalamus and striatum and were closely associated with frontal cortex, specifically middle frontal gyrus, the frontal eye fields, premotor areas and the anterior cingulate 56–58 Increased GBC in these areas may have reflected enhanced functional connectivity within cortico-striatal-thalamic circuits. Thus, inferences about the functional significance of changes in GBC must consider both spatial localization and functional correlates.
This study has limitations that influence interpretation of the study results. First, ketamine has secondary sites of action unrelated to blockade of NMDA glutamate receptors. 59–61 However, its effects of interest are attributed to occupancy of NMDA receptors8 and persist despite blockade of dopamine D2 62 and opiate 63 receptors. For this reason, ketamine produces effects on cortical networks closely resembling more selective NMDA-R antagonists. 27 Second, we did not include a detailed, neurocognitive assessment under ketamine. This may have precluded our detecting a relationship between cognitive symptoms and GBC. Third, in seeking to understand ketamine’s effects, we interrogated connectivity alterations in large areas of the brain and related them to symptoms, raising the possibility of false positives. To counteract this, we used a relatively new technique, GBC, that is designed to allow consideration of all brain voxels and complemented it with well-validated PANSS factor solutions and cluster correction of all statistical maps to the highest of current standards.
In conclusion, the NMDA-R antagonist ketamine increased global brain functional connectivity (GBC) in healthy human subjects. In many circuits, increased GBC was positively correlated with psychosis. However, in a cortical-striatial-thalamic circuit related to prefrontal cortex, increased GBC was correlated with reduced negative symptoms during ketamine. Thus, GBC is a sensitive measure of functional changes in glutamate synaptic connectivity, supporting its potential utility as a biomarker of glutamatergic synaptic dysfunction.
Acknowledgments
Dr. Driesen wishes to thank the following individuals: Drs. Michelle Hampson and Pawel Skudlarski provided many interesting discussions of connectivity, in general, and of her project, specifically. Cheryl Lacadie helped informally with a number of image processing and software issues. Kathleen Maloney, Julie Holub, Cara Cordeaux and Nikia McFadden served as research assistants. Nursing care was provided by the Yale Center for Clinical Investigation and the Biostudies Unit, Neurobiological Diagnostic Studies Unit of the VA CT Healthcare System, West Haven, CT. MRI technologists Hedy Sarofin and Karen A. Martin supplied expert assistance for this complex MRI protocol.
Sources of financial support include: Yale-Pfizer Alliance (NRD); National Alliance for Research on Schizophrenia and Depression-Distinguished Investigator Award (JHK) and Young Investigator Award (ZB); Conte Center Calcium Signaling and Prefrontal Deficits in Schizophrenia, NIMH; National Center Post Traumatic Stress Disorder, Clinical Neurosciences Division, West Haven, CT, National Institute on Alcohol Abuse and Alcoholism, 2P50 AA 012870; U.S. Department of Veterans Affairs Alcohol Research Center; NIH National Center for Research Resources CTSA Grant Number UL1 RR024139; NIH Grant Number K23-MH077914, and the State of CT Department of Mental Health and Addiction Services.
Footnotes
Conflict of Interest
Dr. Krystal consults for several pharmaceutical and biotechnology companies with compensation less than $10,000 per year. All other authors declare that they have no conflict of interest.
References
- 1.Krystal J, Abi-Dargham A, Laruelle M, Moghaddam B. Pharmacologic model psychoses. In: Charney D, Nestler E, Bunney B, editors. Neurobiology of Mental Illness. Oxford University Press; New York: 1999. pp. 214–224. [Google Scholar]
- 2.Krystal JH, Karper LP, Seibyl JP, Freeman GK, Delaney R, Bremner JD, et al. Subanesthetic effects of the noncompetitive NMDA antagonist, ketamine, in humans: psychotomimetic, perceptual, cognitive, and neuroendocrine responses. Arch Gen Psychiatry. 1994;51(3):199–214. doi: 10.1001/archpsyc.1994.03950030035004. [DOI] [PubMed] [Google Scholar]
- 3.Domino E, ChodoffF P, Corsenn G. Pharmacologic Effects of CI-581, a New Dissociative Anesthetic, in Man. Clinical Pharmacology & Therapeutics. 1965;6:279–291. doi: 10.1002/cpt196563279. [DOI] [PubMed] [Google Scholar]
- 4.Cohen B, Rosenbaum G, Luby E, Gottlieb J. Comparison of phencyclidine hydrochloride (sernyl) with other drugs: Simulation of schizophrenic performance with phencyclidine hydrochloride (sernyl), lysergic acid diethylamide (lsd-25), and amobarbital (amytal) sodium; ii. symbolic and sequential thinking. Archives of General Psychiatry. 1962;6(5):395–401. doi: 10.1001/archpsyc.1962.01710230063007. [DOI] [PubMed] [Google Scholar]
- 5.Rosenbaum G, Cohen B, Luby E, Gottlieb J, Yelen D. Comparison of sernyl with other drugs: Simulation of schizophrenic performance with sernyl, lsd-25, and amobarbital (amytal) sodium; i. attention, motor function, and proprioception. Archives of General Psychiatry. 1959;1(6):651–656. doi: 10.1001/archpsyc.1959.03590060113013. [DOI] [PubMed] [Google Scholar]
- 6.Krystal JH, Perry EB, Jr, Gueorguieva R, Belger A, Madonick SH, Abi-Dargham A, et al. Comparative and Interactive Human Psychopharmacologic Effects of Ketamine and Amphetamine: Implications for Glutamatergic and Dopaminergic Model Psychoses and Cognitive Function. Arch Gen Psychiatry. 2005;62(9):985–994. doi: 10.1001/archpsyc.62.9.985. [DOI] [PubMed] [Google Scholar]
- 7.Volenweider F. Advances and pathophysiological model of hallucinogenic drug action in humans: a preamble to schizophrenia research. Pharmacopsychiatry. 1998;31(Supplement):92–103. doi: 10.1055/s-2007-979353. [DOI] [PubMed] [Google Scholar]
- 8.Stone J, Erlandsson K, Arstad E, Squassante L, Teneggi V, Bressan R, et al. Relationship between ketamine-induced psychotic symptoms and NMDA receptor occupancy: a [(123)I]CNS-1261 SPET study. Psychopharmacology. 2008;197(3):401–408. doi: 10.1007/s00213-007-1047-x. [DOI] [PubMed] [Google Scholar]
- 9.Holcomb H, Lahti A, Medoff D, Cullen T, Tamminga C. Effects of noncompetitive NMDA receptor blockade on anterior cingulate cerebral blood flow in volunteers with schizophrenia. Neuropsychopharmacology. 2005;30(12):2275–2282. doi: 10.1038/sj.npp.1300824. [DOI] [PubMed] [Google Scholar]
- 10.Holcomb HH, Lahti AC, Medoff DR, Weiler M, Tamminga CA. Sequential regional cerebral blood flow brain scans using PET with H2(15)O demonstrate ketamine actions in CNS dynamically. Neuropsychopharmacology. 2001;25(2):165–172. doi: 10.1016/S0893-133X(01)00229-9. [DOI] [PubMed] [Google Scholar]
- 11.Lahti AC, Holcomb HH, Medoff DR, Tamminga CA. Ketamine activates psychosis and alters limbic blood flow in schizophrenia. Neuroreport. 1995;6(6):869–872. doi: 10.1097/00001756-199504190-00011. [DOI] [PubMed] [Google Scholar]
- 12.Vollenweider F, Leenders K, Scharfetter C, Antonini A, Maguire P, Missimer J, et al. Metabolic hyperfrontality and psychopathology in the ketamine model of psychosis using positron emission tomography (PET) and [18F]fluorodeoxyglucose (FDG) European Neuropsychopharmacology. 1997;7 (1):9–24. doi: 10.1016/s0924-977x(96)00039-9. [DOI] [PubMed] [Google Scholar]
- 13.Breier A, Malhotra A, Pinals D, Weisenfeld N, Pickar D. Association of ketamine-induced psychosis with focal activation of the prefrontal cortex in healthy volunteers. American Journal of Psychiatry. 1997;154(6):805–811. doi: 10.1176/ajp.154.6.805. [DOI] [PubMed] [Google Scholar]
- 14.Stone JM, Dietrich C, Edden R, Mehta MA, De Simoni S, Reed LJ, et al. Ketamine effects on brain GABA and glutamate levels with 1H-MRS: relationship to ketamine-induced psychopathology. Mol Psychiatry. 2012 doi: 10.1038/mp.2011.171. [DOI] [PMC free article] [PubMed] [Google Scholar]
- 15.Grunze HC, Rainnie DG, Hasselmo ME, Barkai E, Hearn EF, McCarley RW, et al. NMDA-dependent modulation of CA1 local circuit inhibition. Journal of Neuroscience. 1996;16:2034–2043. doi: 10.1523/JNEUROSCI.16-06-02034.1996. [DOI] [PMC free article] [PubMed] [Google Scholar]
- 16.Maccaferri G, Dingledine R. Control of feedforward dendritic inhibition by NMDA receptor-dependent spike timing in hippocampal interneurons. J Neurosci. 2002;22(13):5462–5472. doi: 10.1523/JNEUROSCI.22-13-05462.2002. [DOI] [PMC free article] [PubMed] [Google Scholar]
- 17.Jackson ME, Homayoun H, Moghaddam B. NMDA receptor hypofunction produces concommitant firing rate potentiation and burst activity reduction in the prefrontal cortex. Neuroscience. 2004;101:8467–8472. doi: 10.1073/pnas.0308455101. [DOI] [PMC free article] [PubMed] [Google Scholar]
- 18.Homayoun H, Moghaddam B. NMDA receptor hypofunction produces opposite effects on prefrontal cortex interneurons and pyramidal neurons. The Journal of Neuroscience. 2007;27(43):11496–11500. doi: 10.1523/JNEUROSCI.2213-07.2007. [DOI] [PMC free article] [PubMed] [Google Scholar]
- 19.Yonezawa Y, Kuroki T, Kawahara T, Tashiro N, Uchimura H. Involvement of γ-aminobutyric acid neurotransmission in phencyclidine-induced dopamine release in the medial prefrontal cortex. European Journal of Pharmacology. 1998;341(1):45–56. doi: 10.1016/s0014-2999(97)01435-0. [DOI] [PubMed] [Google Scholar]
- 20.Moghaddam B, Adams B, Verma A, Daly D. Activation of glutamatergic neurotransmission by ketamine: a novel step in the pathway from NMDA receptor blockade to dopaminergic and cognitive disruptions associated with the prefrontal cortex. The Journal of Neuroscience. 1997;17(8):2921–2927. doi: 10.1523/JNEUROSCI.17-08-02921.1997. [DOI] [PMC free article] [PubMed] [Google Scholar]
- 21.Amitai N, Kuczenski R, Behrens MM, Markou A. Repeated phencyclidine administration alters glutamate release and decreases GABA markers in the prefrontal cortex of rats. Neuropharmacology. 2012;62(3):1422–1431. doi: 10.1016/j.neuropharm.2011.01.008. [DOI] [PMC free article] [PubMed] [Google Scholar]
- 22.Castner SA, Arriza JL, Roberts JC, Mrzljak L, Christian EP, Williams GV. Reversal of Ketamine-Induced Working Memory Impairments by the GABAA[alpha]2/3 Agonist TPA023. Biological Psychiatry. 2010;67(10):998–1001. doi: 10.1016/j.biopsych.2010.01.001. [DOI] [PubMed] [Google Scholar]
- 23.Homayoun H, Jackson M, Moghaddam B. Activation of metabotropic glutamate 2/3 receptors reverses the effects of NMDA receptor hypofunction on prefrontal cortex unit activity in awake rats. Journal of neurophysiology. 2005;93(4):1989–2001. doi: 10.1152/jn.00875.2004. [DOI] [PubMed] [Google Scholar]
- 24.Moghaddam B, Adams BW. Reversal of phencyclidine effects by a group II metabotropic glutamate receptor agonist in rats. Science. 1998;281(5381):1349–1352. doi: 10.1126/science.281.5381.1349. [DOI] [PubMed] [Google Scholar]
- 25.Krystal JH, Abi-Saab W, Perry E, D’Souza DC, Liu N, Gueorguieva R, et al. Preliminary evidence of attenuation of the disruptive effects of the NMDA glutamate receptor antagonist, ketamine, on working memory by pretreatment with the group II metabotropic glutamate receptor agonist, LY354740, in healthy human subjects. Psychopharmacology. 2005;179(1):303–309. doi: 10.1007/s00213-004-1982-8. [DOI] [PubMed] [Google Scholar]
- 26.Pinault D. N-Methyl d-Aspartate receptor antagonists ketamine and MK-801 induce wake-related aberrant [gamma] oscillations in the rat neocortex. Biological Psychiatry. 2008;63(8):730–735. doi: 10.1016/j.biopsych.2007.10.006. [DOI] [PubMed] [Google Scholar]
- 27.Wood J, Kim Y, Moghaddam B. Disruption of prefrontal cortex large scale neuronal activity by different classes of psychotomimetic drugs. The Journal of Neuroscience. 2012;32(9):3022–3031. doi: 10.1523/JNEUROSCI.6377-11.2012. [DOI] [PMC free article] [PubMed] [Google Scholar]
- 28.Lovett-Barron M, Turi GF, Kaifosh P, Lee PH, Bolze F, Sun X-H, et al. Regulation of neuronal input transformations by tunable dendritic inhibition. Nat Neurosci. 2012;15(3):423–430. doi: 10.1038/nn.3024. [DOI] [PubMed] [Google Scholar]
- 29.Royer S, Zemelman B, Losonczy A, Kim J, Chance F, Magee J, et al. Control of timing, rate and bursts of hippocampal place cells by dendritic and somatic inhibition. Nature Neuroscience. 2012;15(5):769–775. doi: 10.1038/nn.3077. [DOI] [PMC free article] [PubMed] [Google Scholar]
- 30.Cole MW, Pathak S, Schneider W. Identifying the brain’s most globally connected regions. NeuroImage. 2010;49(4):3132–3148. doi: 10.1016/j.neuroimage.2009.11.001. [DOI] [PubMed] [Google Scholar]
- 31.Cole MW, Yarkoni T, Repovš G, Anticevic A, Braver TS. Global Connectivity of Prefrontal Cortex Predicts Cognitive Control and Intelligence. The Journal of Neuroscience. 2012;32(26):8988–8999. doi: 10.1523/JNEUROSCI.0536-12.2012. [DOI] [PMC free article] [PubMed] [Google Scholar]
- 32.Cole MW, Anticevic A, Repovs G, Barch D. Variable Global Dysconnectivity and Individual Differences in Schizophrenia. Biological Psychiatry. 2011;70(1):43–50. doi: 10.1016/j.biopsych.2011.02.010. [DOI] [PMC free article] [PubMed] [Google Scholar]
- 33.First M, Spitzer R, Gibbon M, Williams J. Structured Clinical Interview for DSM-IV Axis I Disorders, Research Version, Non-patient Edition. Biometrics Research, New York State Psychiatric Institute; New York: 2002. [Google Scholar]
- 34.Eckblad MJ, Chapman LJ, Chapman JP, Mishlove M. The revised social anhedonia scale. unpublished. [Google Scholar]
- 35.Chapman LJ, Chapman JP, Raulin ML. Body image aberration in schizophrenia. Journal of Abnormal Psychology. 1978;87:399–407. doi: 10.1037//0021-843x.87.4.399. [DOI] [PubMed] [Google Scholar]
- 36.Eckblad ML, Chapman LJ, Chapman JP. Magical ideation as an indicator of schizotypy. Journal of Consulting and Clinical Psychology. 1983;51:215–222. doi: 10.1037//0022-006x.51.2.215. [DOI] [PubMed] [Google Scholar]
- 37.Janca A, Bucholz K, Janca I. Family history assessment module Version 5. Washington University School of Medicine; St Louis: 1997. [Google Scholar]
- 38.Kaye S, Opler L, Fiszbein A. Positive and Negative Syndrome Scale. Multi-Health Systems, Inc; Toronto, Ontario: 1986. [Google Scholar]
- 39.Krystal JH, Karper LP, Bennett A, D’Souza DC, Abi Dargham A, Morrissey K, et al. Interactive effects of subanesthetic ketamine and subhypnotic lorazepam in humans. Psychopharmacology. 1998;135(3):213–229. doi: 10.1007/s002130050503. [DOI] [PubMed] [Google Scholar]
- 40.Cox RW. AFNI: software for analysis and visualization of functional magnetic resonance neuroimages. Computers and biomedical research. 1996;29(3):162–173. doi: 10.1006/cbmr.1996.0014. [DOI] [PubMed] [Google Scholar]
- 41.Smith S. Fast robust automated brain extraction. Human Brain Mapping. 2002 doi: 10.1002/hbm.10062. [DOI] [PMC free article] [PubMed] [Google Scholar]
- 42.Jenkinson M, Bannister P, Brandy M, Smith S. Improved optimization for the robust and accurate linear registration and motion correction of brain images. Neuroimage. 2002;17:825–841. doi: 10.1016/s1053-8119(02)91132-8. [DOI] [PubMed] [Google Scholar]
- 43.Woolrich M, Ripley B, Brady M, Smith S. Temporal autocorrelation in univariate linear modeling of FMRI data. NeuroImage. 2001;14:1370–1386. doi: 10.1006/nimg.2001.0931. [DOI] [PubMed] [Google Scholar]
- 44.Bell M, Lysaker P, Beam-Goulet J, Milstein R, Lindemayer J. Five-component model of schizophrenia: assessing the factorial invariance of the positive and negative syndrome scale. Psychiatry Research. 1994;52:295–303. doi: 10.1016/0165-1781(94)90075-2. [DOI] [PubMed] [Google Scholar]
- 45.Bryson G, Bell M, Greig T, Kaplan E. Internal consistency, temporal stability and neuropsychological correlates of three cognitive components of the Positive and Negative Syndrome Scale (PANSS) Schizophrenia Research. 1999;38(1):27–35. doi: 10.1016/s0920-9964(99)00004-3. [DOI] [PubMed] [Google Scholar]
- 46.Peralta V, Cuesta MJ. Psychometric properties of the Positive and Negative Syndrome Scale (PANSS) in schizophrenia. Psychiatry Research. 1994;53(1):31–40. doi: 10.1016/0165-1781(94)90093-0. [DOI] [PubMed] [Google Scholar]
- 47.Lindenmayer JP, Bernstein Hyman R, Grochowski S. Five-factor model of schizophrenia. Initial validation. The journal of nervous and mental disease. 1994;182(11):631–638. doi: 10.1097/00005053-199411000-00006. [DOI] [PubMed] [Google Scholar]
- 48.Dollfus S, Petit M, Lesieur P, Mendard JF. Principal-component analysis of PANSS and SANS-SAPS global ratings in schizophrenia patients. European Psychiatry. 1991;6(5):251–259. doi: 10.1016/0924-9338(96)80320-8. [DOI] [PubMed] [Google Scholar]
- 49.Hakami T, Jones N, Tolmacheva E, Gaudias J, Chaumont J, Salzberg M, et al. NMDA receptor hypofunction leads to generalized and persistent aberrant gamma oscillations independent of hyperlocomotion and the state of consciousness. PLoS ONE. 2009;4(8):e6755–e6755. doi: 10.1371/journal.pone.0006755. [DOI] [PMC free article] [PubMed] [Google Scholar]
- 50.Ehrlichman RS, Gandal MJ, Maxwell CR, Lazarewicz MT, Finkel LH, Contreras D, et al. N-methyl-d-aspartic acid receptor antagonist-induced frequency oscillations in mice recreate pattern of electrophysiological deficits in schizophrenia. Neuroscience. 2009;158(2):705–712. doi: 10.1016/j.neuroscience.2008.10.031. [DOI] [PubMed] [Google Scholar]
- 51.Corlett PR, Taylor JR, Wang XJ, Fletcher PC, Krystal JH. Toward a neurobiology of delusions. Progress in Neurobiology. 2010;92(3):345–369. doi: 10.1016/j.pneurobio.2010.06.007. [DOI] [PMC free article] [PubMed] [Google Scholar]
- 52.Yoon JH, Rokem AS, Silver MA, Minzenberg MJ, Ursu S, Ragland JD, et al. Diminished Orientation-Specific Surround Suppression of Visual Processing in Schizophrenia. Schizophrenia Bulletin. 2009;35(6):1078–1084. doi: 10.1093/schbul/sbp064. [DOI] [PMC free article] [PubMed] [Google Scholar]
- 53.Carlsson A, Hansson LO, Waters N, Carlsson ML. Neurotransmitter aberrations in schizophrenia: New perspectives and therapeutic implications. Life Sciences. 1997;61(2):75–94. doi: 10.1016/s0024-3205(97)00228-2. [DOI] [PubMed] [Google Scholar]
- 54.Hoffman RE, Hampson M. Functional Connectivity Studies Of Patients With Auditory Verbal Hallucinations. Frontiers in Human Neuroscience. 2012:6. doi: 10.3389/fnhum.2012.00006. [DOI] [PMC free article] [PubMed] [Google Scholar]
- 55.Hoffman RE, Hampson M, Wu K, Anderson AW, Gore JC, Buchanan RJ, et al. Probing the Pathophysiology of Auditory/Verbal Hallucinations by Combining Functional Magnetic Resonance Imaging and Transcranial Magnetic Stimulation. Cerebral Cortex. 2007;17(11):2733–2743. doi: 10.1093/cercor/bhl183. [DOI] [PMC free article] [PubMed] [Google Scholar]
- 56.Haber SN, Calzavara R. The cortico-basal ganglia integrative network: The role of the thalamus. Brain Research Bulletin. 2009;78(2–3):69–74. doi: 10.1016/j.brainresbull.2008.09.013. [DOI] [PMC free article] [PubMed] [Google Scholar]
- 57.Calzavara R, Mailly P, Haber S. Relationship between the corticostriatal terminals from areas 9 and 46, and those from area 8A, dorsal and rostral premotor cortex and area 24c: an anatomical substrate for cognition to action. European Journal of Neuroscience. 2007;26(7):2005–2024. doi: 10.1111/j.1460-9568.2007.05825.x. [DOI] [PMC free article] [PubMed] [Google Scholar]
- 58.Haber S. The primate basal ganglia: parallel and integrative networks. Journal of Chemical Neuroanatomy. 2003;26(4):317–330. doi: 10.1016/j.jchemneu.2003.10.003. [DOI] [PubMed] [Google Scholar]
- 59.Oye N, Hustvelt O, Moberg ER, Pausen O, Skoglund LS. The chiral forms of ketamine as probed for NMDA receptor function in humans. In: Kameyama T, Nabeshima T, Domino E, editors. NMDA Receptor Related Agents: Biochemistry, Pharmacology, and Behavior. NPP Books; Ann Arbor, MI: 1991. pp. 381–389. [Google Scholar]
- 60.Smith DJ, Westfall DP, Adams JD. Ketamine interacts with opiate receptors as an agonist. Anesthesiology. 1980;53:S5. [Google Scholar]
- 61.Cohen ML, Chan SL, Bhargava HN, Trevor AJ. Inhibition of mammalian brain acetylcholinesterase by ketamine. Biochemical Pharmacology. 1974;23:1647–1652. doi: 10.1016/0006-2952(74)90377-3. [DOI] [PubMed] [Google Scholar]
- 62.Krystal JH, D’Souza DC, Karper LP, Bennett A, Abi-Dargham A, Abi-Saab D, et al. Interactive effects of subanesthetic ketamine and haloperidol in healthy humans. Psychopharmacology. 1999;145(2):193–204. doi: 10.1007/s002130051049. [DOI] [PubMed] [Google Scholar]
- 63.Krystal JH, Madonick S, Perry E, Gueorguieva R, Brush L, Wray Y, et al. Potentiation of low dose ketamine effects by naltrexone: potential implications for the pharmacotherapy of alcoholism. Neuropsychopharmacology. 2006;31:1793–1800. doi: 10.1038/sj.npp.1300994. [DOI] [PubMed] [Google Scholar]