Abstract
Altered pressure in the developing left ventricle (LV) results in altered morphology and tissue material properties. Mechanical stress and strain may play a role in the regulating process. This study showed that confocal microscopy, three-dimensional reconstruction, and finite element analysis can provide a detailed model of stress and strain in the trabeculated embryonic heart. The method was used to test the hypothesis that end-diastolic strains are normalized after altered loading of the LV during the stages of trabecular compaction and chamber formation. Stage-29 chick LVs subjected to pressure overload and underload at stage 21 were reconstructed with full trabecular morphology from confocal images and analyzed with finite element techniques. Measured material properties and intraventricular pressures were specified in the models. The results show volume-weighted end-diastolic von Mises stress and strain averaging 50–82% higher in the trabecular tissue than in the compact wall. The volume-weighted-average stresses for the entire LV were 115, 64, and 147 Pa in control, underloaded, and overloaded models, while strains were 11, 7, and 4%; thus, neither was normalized in a volume-weighted sense. Localized epicardial strains at mid-longitudinal level were similar among the three groups and to strains measured from high-resolution ultrasound images. Sensitivity analysis showed changes in material properties are more significant than changes in geometry in the overloaded strain adaptation, although resulting stress was similar in both types of adaptation. These results emphasize the importance of appropriate metrics and the role of trabecular tissue in evaluating the evolution of stress and strain in relation to pressure-induced adaptation.
Keywords: chick embryo, heart development, finite element analysis, left ventricle
1 Introduction
The heart develops in a mechanically active environment, supplying blood to the developing embryo while simultaneously undergoing growth, morphogenesis, and functional maturation. In the early embryonic period, the heart changes from a smooth-walled, muscle-wrapped tube through a trabeculated phase to the mature four-chambered form. Both genetic and epigenetic factors regulate this process; one of the principal epigenetic factors is mechanical load (Taber, 2001).
The chick embryo is a well-established model for studying the effects of altered mechanical load on the developing heart. The model enables direct intervention and visualization and its developmental process is comparable to that of mammalian embryos. Experimental paradigms altering regional embryonic left ventricular (LV) pressure in the trabecular compaction/chamber formation period have demonstrated that load regulates cardiac development. Conotruncal banding (CTB) increases both diastolic and systolic intraventricular pressure (Clark et al. 1989; Keller et al. 1997). Chick hearts subjected to CTB at Hamburger and Hamilton stage 21 (Hamburger and Hamilton 1992), or embryonic-day (ED) 3.5, show myocyte hyperplasia (Clark et al. 1989) and ventricular chamber dilatation, thickening of the compact myocardium and trabeculae, and spiraling of the trabecular course (Sedmera et al. 1999). Other changes are acceleration of the developmental change in transmural myofiber angle distribution (Tobita et al. 2005); significantly stiffer stress-strain properties (Miller et al. 2003); and precocious development of the His-Purkinje system (Reckova et al. 2003).
Decreased hemodynamic load produced by chronic verapamil suffusion to the extraembryonic vascular bed from stage 21 decreases diastolic and systolic LV pressure, dorsal aortic blood flow, stroke volume, and ventricular mass (Clark et al. 1991). These hearts develop thinner compact myocardium and a higher proportion of trabeculae (Sedmera et al. 1998). Decreased hemodynamic pressure produced by left atrial ligation (LAL) (Rychter et al. 1979) at stage 21 or 24 results in altered strain relationships (Tobita and Keller 2000; Tobita et al. 2002), delay in His-Purkinje development (Reckova et al. 2003), and hypoplastic left heart syndrome (HLHS) (deAlmeida et al. 2007; Sedmera et al. 1999).
Abundant evidence thus suggests that in these developmental stages, myocardial tissue senses mechanical loads and translates them into some nature of biochemical signals resulting in modified cellular and/or extracellular structure. The passive stiffening and hyperplasia with increased mechanical load suggest that mechanical strain might be a controlling factor, since a thicker and stiffer myocardium would tend to compensate for the increased pressure. A first step in testing this hypothesis is comparison of LV strain between normal hearts and those subjected to altered loading. Strain has been measured in the interior of the mature heart by methods such as cine-radiography of implanted metal beads (Douglas et al. 1991) and high-resolution MRI tagging (O’Dell et al. 1994). The resolution of these techniques is not sufficient to measure interior strain in the early embryonic heart. In the embryo, estimation of epicardial strains by video tracing of surface markers (Tobita et al. 2002), optical coherence tomography of surface markers (Filas et al. 2007), and 2D echocardiography (Damon et al. 2009) is possible, but none measure strain throughout the volume. Numerical methods can be an important supplement to these limited techniques by calculating stress and strain throughout the volume, if estimates of local tissue material properties and a detailed three-dimensional model of the geometry are available.
One goal of this work is to show that confocal microscopy, three-dimensional reconstruction, and finite element analysis can provide a detailed model of stress and strain in the trabeculated embryonic heart. Finite element models of the embryonic heart with full trabecular geometry do not currently exist. We then use this method to test the hypothesis that the changes in morphology and mechanical properties produced by altered internal pressure in the embryonic chick heart normalize tissue strain to control levels. Both increased pressure, created by conotruncal banding, and decreased pressure, created by verapamil suffusion, are studied to test whether the mechanism is bidirectional. Confocal images of the LV in the passive unloaded state are digitally reconstructed and subjected to nonlinear finite element stress-strain analysis using experimentally measured end-diastolic pressure and passive hyperelastic stress-strain relationships. The resulting magnitude and distribution of stress and strain are then compared between experimental and control groups.
2 Methods
2.1 Animal Preparation
Fertilized white Leghorn chicken eggs were incubated blunt end upward at 38.5° C and 62% humidity in a forced-downdraft incubator to stage 21. To create pressure overload, access to the embryo was obtained by opening the shell and a small region of the outer and inner shell membranes was incised under dissecting microscopic view. A loop of 10/0 nylon suture was tied in a secure but non-binding manner around the outflow tract of the developing heart (Clark et al. 1989). Embryos with signs of malformation or bleeding were discarded. The opening in the shell was sealed with parafilm and the egg reincubated until stage 29. The shell was opened and resealed with parafilm in matched controls.
Pressure underload was created by chronic verapamil suffusion (Clark et al. 1991; Sedmera et al. 1998). Eggs were incubated to stage 21, when the embryo was exposed by opening the shell and removing the adjacent inner shell membrane. One end of primed PE-60 polyethylene tubing was positioned on the surface of the extraembryonic vascular bed and the other attached to the flow modulator of an Alzet miniosmotic pump (200 μl reservoir, Alza, Palo Alto, CA). The pump suffused the vascular bed with a 1 ng/μl solution of verapamil at a constant flow rate of 1 μl/h; the verapamil delivery was 1 ng/h. The window in the shell was covered with parafilm, and the eggs were returned to the incubator. The vascular bed was suffused with saline in matched controls.
2.2 Pressure measurement
LV pressure was measured with a servo-null pressure system (model 900A, World Precision Instruments, Sarasota, FL) on a group of stage-29 embryos prepared as described above. A 7-μm, fluid-filled, glass pipette positioned by micromanipulator (Leitz, Wetzlar, Germany) punctured the LV. Accuracy, linearity, and frequency response of the system have been previously determined (Clark and Hu 1982). A custom LABVIEW software program (National Instruments, Houston, TX) recorded 10–30 pressure cycles per heart. Intraventricular pressure was the difference between measured pressure and pressure recorded from immersing the tip in the extraembryonic fluid at the same level as the ventricle. Study size for the pressure measurement population was n=14 control, n=10 overloaded, n=13 underloaded, and n=12 saline control.
2.3 Confocal imaging and 3D reconstruction
For confocal imaging, a population of embryos (n=9 control, n=7 pressure overloaded, n=6 pressure underloaded, and n=7 saline control) were harvested at stage 29; heparin was administered to inhibit clotting. Ice-cold chick cardioplegia solution (Taber et al. 1993) perfused through the atria arrested the ventricle in the passive, unloaded state and removed blood. Hearts were then perfused with 4% paraformaldehyde for fixation (one week at 4 °C) and enhancement of tissue autofluorescence. After PBS washing, hearts were dissected out and pinned dorsal side up in a Sylgard imaging chamber on the microscope stage. Two changes of a 50%/50% mixture of benzyl alcohol:benzyl benzoate dehydrated and rendered the specimens transparent (Miller et al. 2005). This process allows laser penetration through the LV depth to resolve trabecular geometry without physical sectioning.
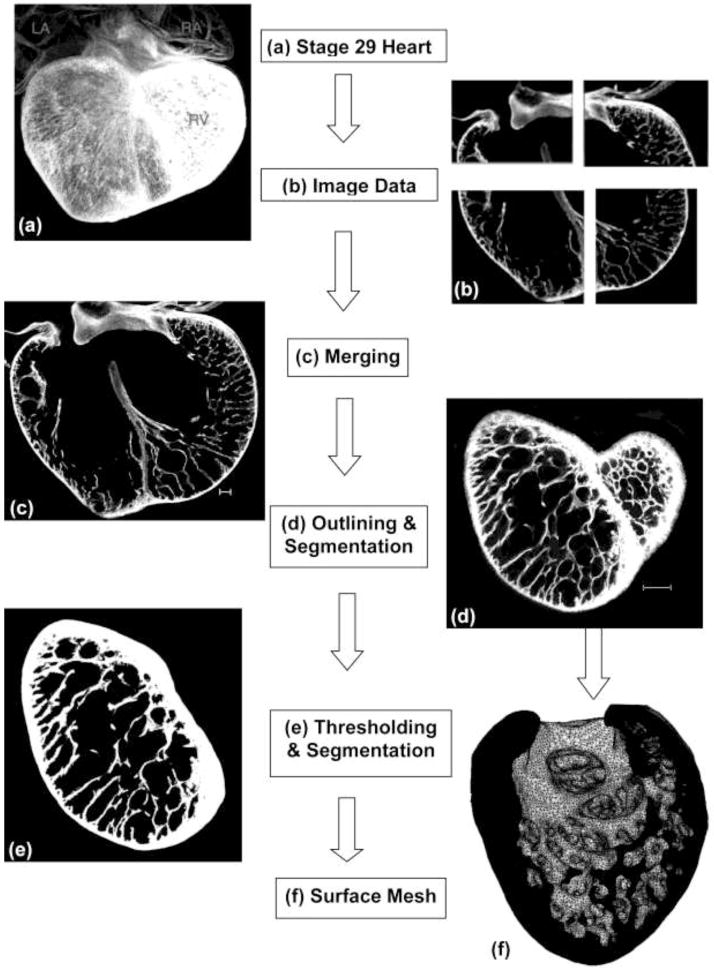
The hearts (Fig. 1a) were imaged whole-mount on a Leica SP2 TCS AOBS upright confocal microscope in 3-μm steps in the dorsoventral direction (z). The field of view of the 10X 0.3 NA dry objective necessitated 3 or 4 stacks in the xy directions (Fig. 1b). Images were saved as uncompressed TIFF files at 8 bits per channel.
Figure 1.
Image-Processing Flowchart. This chart shows the major steps in the three-dimensional reconstruction, segmentation, and volumetric meshing of confocal microscopic section. (a) Stage-29 chick heart. Hearts were imaged by confocal microscopy without physical sectioning. (b) The raw images from confocal microscopy contained three or four sections in the xy direction and up to 600 sections in the z direction. Each section contained 512×512 three-micron pixels. (c) Sections were imported into the Amira software program and merged. Scale bar = 100 μm. (d) The left ventricle was outlined on each section and remaining tissue removed. Scale bar = 100 μm. (e) Voxel intensities of tissue were mapped to pure white so the image could be segmented into tissue and background, and the background removed. (f) Amira generated a tetrahedral mesh to define the surface. This surface mesh was imported into Hyperworks, which produced a volumetric mesh.
Raw images containing 512×512 pixels in z-stacks of 500–600 slices were imported into the Amira program (Visage Imaging GmbH, Berlin). Images were merged in the x-y directions to create a single stack (Fig. 1c). Correction was made for isotropic shrinkage from the ethanol dehydration, as determined previously (Miller et al. 2005).
Since a model including only the LV was desired, the LV was traced with interactive pen in each slice to remove the atria, right ventricle, and valves (Fig. 1d, e). The entire interventricular septum remained. To insure that omission of the valves did not affect the mechanical behavior of the remaining LV structure, finite element models of the LV were generated in truncated ellipsoidal thin-walled shapes matching the average longitudinal and circumferential dimensions of the control hearts. Models with and without valve structures were analyzed. The results showed that removal of the valves changed the von Mises stress in the adjacent wall tissue by only 1–2% and thus it was deemed accurate enough to omit the valves from the LV models.
The grayscale images contained intensity values from 0 (pure black) to 255 (pure white). Thresholding segmented the grayscale images into background and tissue. The lower limit was chosen by a combination of a study of the percentage change in tissue volume by varying the lower threshold from 20 to 60 and manual scanning through the image stacks. The threshold was independently adjusted for each specimen and image. All pixels below the lower threshold were segmented as background (Fig. 1e).
Total tissue volume and cavity volume were calculated for the reconstructions for each of the models using the Amira Segmentation Editor and Tissue Statistics module. Volumes were compared with one-way ANOVA and Tukey post-hoc test.
A small sliver of material at the cranial edge of the ventricle was removed to create a smooth surface for later application of boundary conditions in HyperMesh. Finally, Amira builtin functions reconstructed the surface with triangular surface elements (Fig. 1f).
2.4 Finite element analysis
The surface meshes produced by Amira were imported into HyperMesh software (part of the HyperWorks suite, Altair Engineering, Inc., Troy, MI) for pre-processing. HyperMesh created solid meshes averaging 450,000 four-node tetrahedral elements. There were on average 5–8 elements throughout the wall and 4–10 elements in the cross-section of the trabeculae. Mesh quality was insured by using a HyperMesh quality index feature that set bounds on element minimum and maximum size, aspect ratio, warpage, skew, and Jacobian.
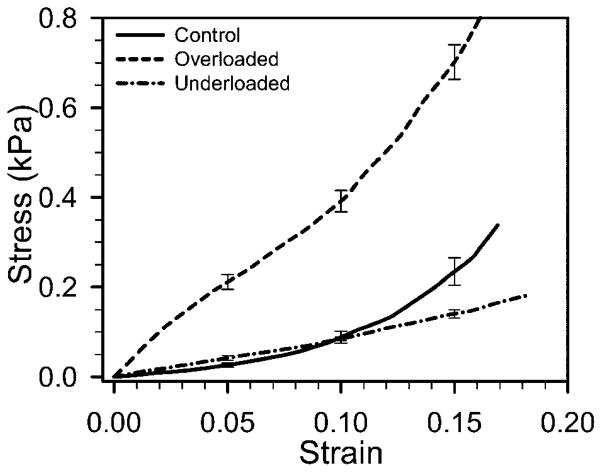
The material description was obtained from an LS-DYNA feature that optimizes material parameters for a best match of finite element results to user-specified experimental stress-strain measurements. The material-test model was a 10×10×20-μm bar meshed with 1000 elements and loaded in uniaxial tension. Poisson’s ratio was 0.49. Experimental results for control and pressure-overloaded LV tissue were from results of Miller et al. (2003). Stress-strain results for pressure-underloaded and saline control ventricles were measured by an identical procedure from embryos treated at stage 21 as described here (Fig. 2). An isotropic Mooney-Rivlin material gave a less-than-optimal match, but a 4th-order isotropic Ogden model gave excellent agreement. The strain energy per unit volume W for the Ogden model is
Figure 2.
Piola-Kirchhoff stress versus Green’s strain measured from excised tissue strips of stage 29 chick left ventricle. Results for control and pressure-overloaded are from Miller et al. (2003); results from underloaded are new here. Sample sizes were n=19 control, n=18 overloaded, and n=13 underloaded. Data is shown as mean ± S.E. Differences are significant at all strain levels between overloaded and both control and underloaded. Differences are significant between control and underloaded beyond 10% strain.
where λi are the principal stretch ratios and μj and αj are material parameters. J is the relative volume, and K is the bulk modulus, representing the ratio of the hydrostatic component of stress to the relative volume change. The material density was 103 kg/m3. With a nonlinear least-squares fit, the calculated material parameters had an L2 norm of the residuals on the order of 10−11.
Three parameter-sensitivity studies were also done to assess the importance of geometry and stress-strain relationship (stiffness) in the comparison of the control and overloaded models. These studies examined the effect of increased pressure on tissue stress and strain in the control models with (1) No Adaptation: the control geometry was loaded by the overloaded pressure; (2) Stiffness Adaptation: the control geometry was assigned the overloaded stiffness and loaded by the overloaded pressure; and (3) Geometry Adaptation: the overloaded geometry, with overloaded pressure, was assigned the control stiffness.
Models were loaded by the measured internal end-diastolic pressure (62.5 Pa control, 93.3 Pa overloaded, 41.3 Pa underloaded) of their treatment group and assigned the stress-strain relationship measured for their treatment group in the Ogden model. Additional boundary conditions included load-free outer (epicardial) surfaces; thus no contact with adjacent tissue was assumed. Nodes on the leveled portion of the upper surface of the LV models were fixed in 3 translational degrees of freedom. This was deemed to be the most natural place to restrain the model to prevent rigid-body motion. The model could not be restrained on the outer or septal walls as substantial stress may have been introduced. The upper border with the atrium was a relatively thick, solid region which was low in stress and relatively constrained by the atrioventricular junction. A surface-to-surface contact algorithm was enabled in LS-DYNA to allow for the case of trabecular contact under the applied load, thus prohibiting any part of the meshed LV from overlapping itself.
The LV models were solved with an implicit scheme on both a desktop Windows-based computer and a 128-processor Linux-based Dell computer cluster. A time of 0 to 5 sec was used to accommodate the nonlinearity with increments chosen automatically by LS-DYNA to insure numerical stability.
A four-node tetrahedral element, tet4, was used in the LS-DYNA solution. In convergence studies through successive mesh refinement with an average of 120K, 280K, 350K, and 450K solid tetrahedral elements, run time increased approximately exponentially with number of elements. Exact doubling of the number of elements was not possible because of the need to reface in Amira. Strains converged to within 2% at the finest mesh refinement. The resulting LS-DYNA explicit analysis required from one to 21h of elapsed time on desktop computer, with a mean of approximately 8 h.
Three principal stresses and von Mises (VM) stresses were displayed graphically on the 3D volume in HyperView (HyperWorks suite, Altair Engineering Inc., Troy MI). To enable quantitative comparison, we used HyperView to read the LS-DYNA results and create tables of element number, volume, stress, and strain (principal and VM) for each of the models. These tables were then input to a custom MATLAB program which calculated histograms of LV volume, both percentage and absolute, versus stress and strain levels. Stress was binned in 50 Pa increments and strain in 1% increments. The program also calculated a volume-weighted average (VWA) of both stress and strain for each model. This volume-weighted average was the sum of the products of the stress or strain in each element of the model with the volume of that element divided by the total volume, as illustrated by the following formula for VWA stress:
Here n_els is the total number of elements in the finite element model, σk is the stress in the k-th element, and Vk is the volume of the k-th element. The result for both VWA stress and strain is thus a single number. All statistical comparisons were made with one-way ANOVA and Tukey post-hoc tests.
Stress and strain histograms for independent compact and trabeculated regions were also created. To calculate these, color-contoured images of VM stress and strain over the entire volume of each model were generated in HyperView. In these images, stress was contoured in 50 Pa increments and strain in 1% increments. Each three-dimensional color-contoured LV model was then digitally sectioned in 40-μm increments to produce a series of digital color-contoured images of two-dimensional sections through the LV model. Each two-dimensional section was analyzed with ImageMagick (+* LLC, Landenburg, PA), which produced a table of the number of pixels of each contoured color in the section; thus the percentage by volume of each level of stress or strain in the entire LV model could be obtained by summing the counts over all the sections and dividing by the total number of pixels. Each digital image showing the color contour of stress or strain was then edited to remove central trabeculae whose width in cross-section was less than 20 μm, and the edited sections, thus representing the region of non-trabeculated LV, were analyzed as before. The trabecular histogram was created as the difference of total area and non-trabeculated area in each section.
2.5 Ultrasonic Imaging
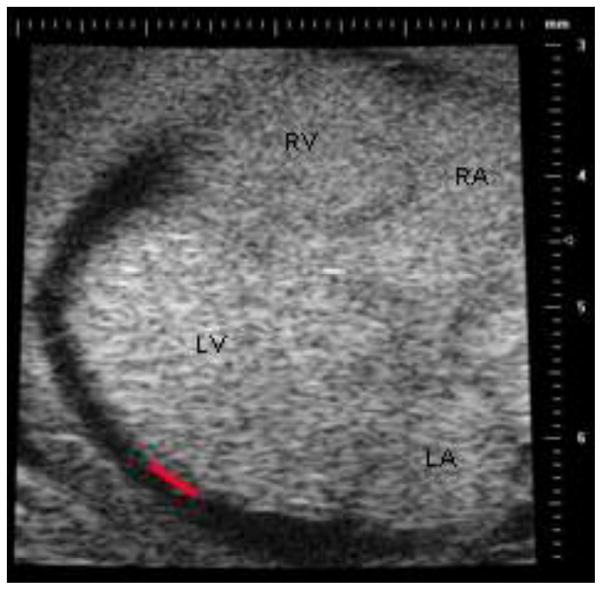
To provide epicardial strain measurements for comparison with calculated values, ultrasonic B-mode and M-mode images of control and overloaded stage-29 hearts were obtained with a Vevo 660 ultrasound biomicroscopy system with RM708 scanhead (VisualSonics, Toronto, Canada) by the method of McQuinn et al. (2007). As in ovo imaging is limited by the fairly large probe footprint and short fixed focal distance, an ex ovo culture setup (Auerbach et al. 1974; Tuan 1983) allowed freer positioning of the scanhead and closer positioning of the embryo to the scanhead. Both a two-chamber view (short axis) showing both ventricles at an a level approximately midway between the base and apex of the LV, and a four-chamber view (long axis), showing both atria and ventricles in frontal section approximately midway through the LV depth, were obtained (Fig. 3). Resolution was 30 μm. Irfanview software (Irfan Skiljan, www.irfanview.com) extracted sequential tiff images from the ultrasound videos.
Figure 3.
Illustrative frame from a four-chamber (long axis) scan of a stage-29 control heart. The red line on the left ventricle represents the approximate location and length of edge used for measurement of epicardial strain. LV: left ventricle; RV: right ventricle; LA: left atrium; RA: right atrium.
End-diastolic strain was calculated from image analysis of the sequential tiff sections. First, the image representing the reference state prior to diastolic filling was identified in both the two-chamber and four-chamber views. Next, a region with approximately 400 μm of edge length, or approximately 10–12% of the edge length of the LV in four-chamber view, was identified by landmarks and speckle pattern on the reference images. This region was chosen approximately midway between the base and apex of the LV on the freewall opposite the ventricular septum (Fig. 3). The length of this edge was traced with Amira border-tracking tools on the reference image and also in the image of the end-diastolic state. Strain was calculated as the change in edge length divided by the reference length. Strain in the four-chamber view was designated as longitudinal strain; strain in the two-chamber view was designated as circumferential strain. In addition, the change in wall thickness at end-diastole relative to reference was measured in the two-chamber view in the same region of the wall used for the circumferential strain measurements. Von Mises strain was calculated from these three principal strains using the standard formula.
3 Results
3.1 Left Ventricular Pressures
LV pressures were significantly higher after CTB and significantly lower after verapamil administration. Peak systolic pressures were 631 ± 21 Pa in control (mean ± SE), 493 ± 11 (p<0.001) in underloaded, and 976 ± 38 (p<0.001) in overloaded. End diastolic pressures were 62.7 ± 6.7 in control, 41.3 ± 6.7 in underloaded, and 93.3 ± 9.3 Pa in overloaded.
3.2 Left ventricular tissue and cavity volumes
Mean LV tissue volume of the pressure-overloaded group was 51% larger than the control group (p<0.01), while that of the pressure-underloaded group was not significantly different from control (Table 1). Similarly, the mean LV cavity volume of pressure-overloaded models was significantly larger, 49%, than controls (p<0.05 vs control and underloaded) (Table 1).
Table 1.
Left ventricular tissue and cavity volumes calculated for the Amira reconstructions of the confocal images of the three treatment groups.
| Treatment Group | Left Ventricular Tissue Volume (mm3) | Left Ventricular Cavity Volume (mm3) |
|---|---|---|
| Control | 0.88 ± 0.05 | 0.61 ± 0.06 |
| Underloaded | 1.00 ± 0.11 | 0.55 ± 0.09 |
| Overloaded | 1.33 ± 0.08* | 0.91 ± 0.10+ |
p<0.01 vs control;
p<0.05 vs control and underloaded
3.3 Stress calculations
In all models, the color contour plots of stress over the 3D volume showed that the end-diastolic VM stress was less than 100 Pa in many regions of the compact wall, with the lowest stresses in the apex (Fig. 4). Stresses were larger in the trabeculae and adjoining regions of wall. Compared with control models, pressure-underloaded models had more of both the wall and trabeculae at lower stress (Fig. 4b), while overloaded models had more of the compact wall and trabeculae at higher stress (Fig. 4c).
Figure 4.
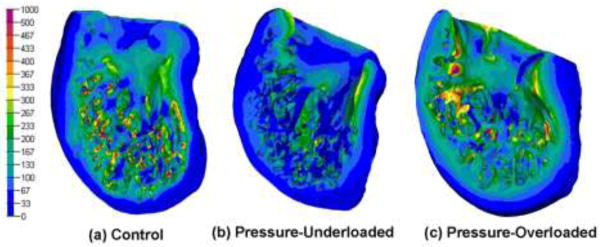
Color contour plots of calculated von Mises stress for a characteristic model in each of the three groups. Bar scale shows stress in Pa. Scaling is not necessarily equivalent on all models and cutting planes were chosen to show maximal interior view.
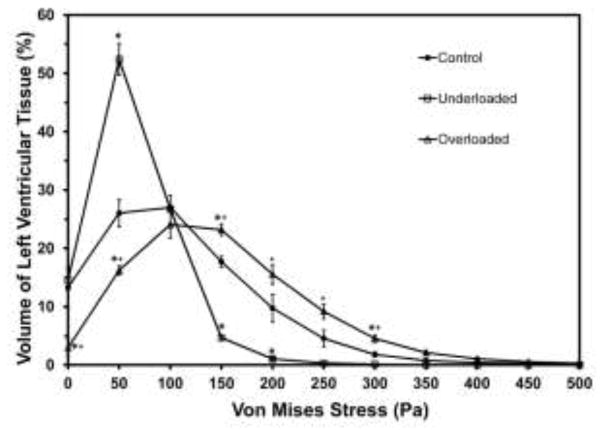
In all three treatment-groups, the histograms of both absolute-volume and percentage-volume versus stress showed exactly the same trends, so only the percentage-volume histograms are shown here. The control group has a broad peak between 50 and 200 Pa and falls monotonically to negligible volume by 350 Pa (Fig. 5). The overloaded histogram is shifted to slightly more volume at lower stress, while the underloaded histogram peaks very sharply at a much lower stress, 50 Pa.
Figure 5.
Histogram of percentage of left ventricular tissue volume versus von Mises stress. For clarity, results are shown as bin height plotted versus the bin center and points are connected. Values are mean ± SE of all models in the group. * denotes percentage volume of the overloaded or underloaded models is significantly different from the control group at the specific stress bin (p<0.05). + denotes percentage volume of overloaded models is significantly different from underloaded models (p<0.05)
The VWA VM stresses were significantly different among the three treatment groups. Stress in the overloaded group was largest, 146 Pa, followed by 115 Pa for controls and 64 Pa for underloaded (Table 2).
Table 2.
Volume-weighted average von Mises stress and strain for the three treatment groups and the parameter sensitivity trials.
| Treatment Group | Volume-weighted average von Mises stress (Pa) | Volume-weighted average von Mises strain (%) |
|---|---|---|
| Control | 112 ± 5.7 | 11.4 ± 0.3% |
| Underloaded | 63.2 ± 5.6* | 7.7 ± 0.4%* |
| Overloaded | 146 ± 8.5 | 3.8 ± 0.2%+ |
| Control geometry with overloaded pressure | 191 ± 11.2 | 14.2 ± 0.4% |
| Control geometry with overloaded pressure and overloaded stress-strain relationship | 161 ± 9.8 | 4.1 ± 0.2% |
| Overloaded geometry with control stress-strain relationship | 162 ± 7.1 | 13.3 ± 0.3% |
Numbers shown are mean ± SE of all models in the treatment group.
p<0.01 vs control and overloaded;
p<0.01 vs control.
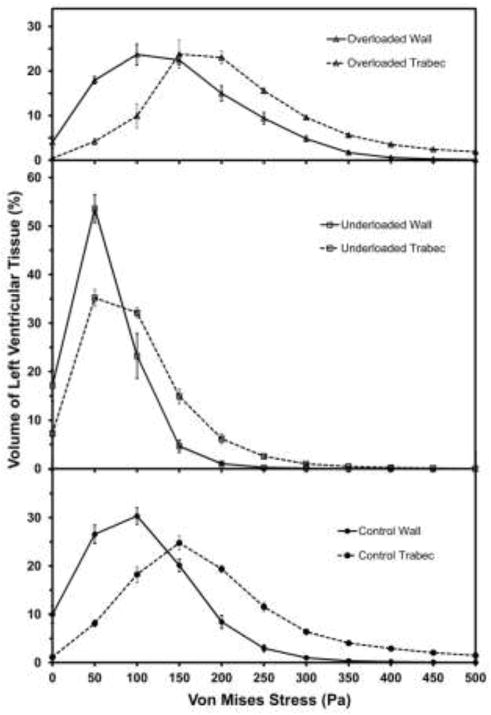
The wall-trabeculae histograms (Fig. 6) show that a significantly greater volume percentage of the trabeculae is stressed at a higher level than that of the wall (p<0.01 in all groups). The VWA VM stresses for wall vs trabeculae are 104 vs 189 Pa in the control group, 60 vs 97 Pa in the underloaded group, and 144 vs 216 Pa in the overloaded group.
Figure 6.
Histograms of percentage of left ventricular tissue volume versus von Mises stress for both ventricular wall and trabecular tissue for the three treatment groups. Values are mean ± SE of all models in the group.
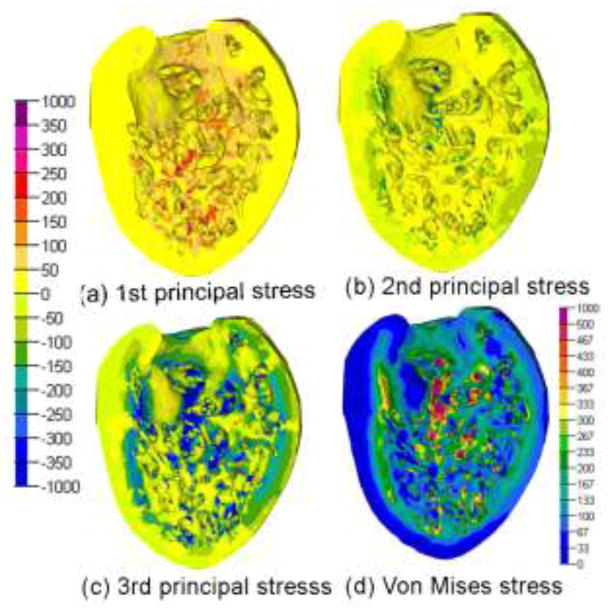
Principal stresses were compared to VM stress in a representative model (Fig. 7). First principal stress was tensile and third principal stress was tensile or low compressive in the wall, with higher compressive magnitudes in the trabeculae. As expected, locations of large VM stress match those of large principal stresses. In the absence of research on whether tensile or compressive stresses and strains have the greatest effect on remodeling, use of VM stress and strain for analysis seems appropriate.
Figure 7.
Color contour plots of four different stress measures for a single heart in the control group. Bar scale at left denotes stress in Pa for cases (a), (b), and (c). Bar scale in lower right denotes stress in Pa for case (d).
Results from saline control hearts did not differ from the normal controls in calculated stress or any other measurement from this study: volume, pressure, stress-strain relationship, and calculated strains. For clarity, none of the results are shown here.
3.4 Strain calculations
In control models, color contour plots of strain over the 3D volume showed that the end-diastolic VM strain was lowest in the apex, increasing toward wall regions bordering the trabeculae, and with 17–19% peaks in the trabeculae (Fig. 8a). Strains were lower overall in pressure-underloaded models (Fig. 8b), and much lower in pressure-overloaded models (Fig. 8c).
Figure 8.
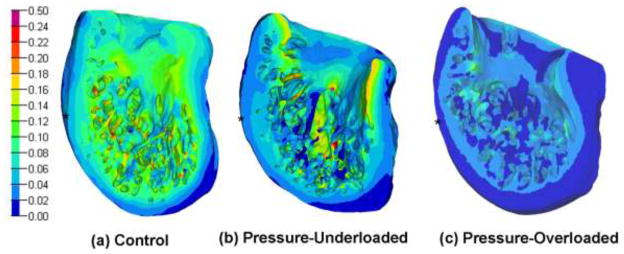
Color contour plots of calculated von Mises strain for a characteristic model in each of the three groups. Bar scale shows strain (non-dimensional). Scaling is not necessarily equivalent on all models and cutting planes were chosen to show maximal interior view. Asterisks show approximate mid-longitudinal level.
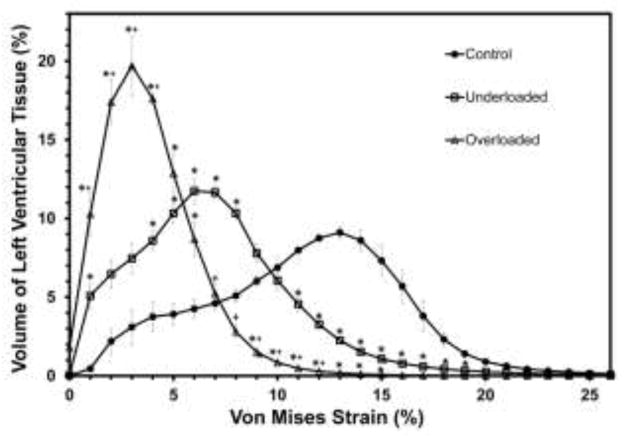
The control-group volume-strain histogram has a broad global peak from 10–16% (Fig. 9). Note that because stress and strain are not linearly related, the plots for volume-strain are not simple multiples of the plots for volume-stress. The underloaded histogram shifts to more tissue at lower strain (peak 4–9%), while the overloaded histogram shifts dramatically lower to a sharp maximum from 2–4% and very little tissue at more than 10% strain. The volume-weighted average VM strain was lowest in the overloaded group, 4% (p<0.01 vs both control and underloaded). The VWA VM strain in the underloaded group, 7%, was intermediate between the overloaded (4%) and control (11%) (p<0.01 vs control and overloaded; Table 2).
Figure 9.
Histogram of percentage of left ventricular tissue volume versus von Mises strain. For clarity, results are shown as bin height plotted versus the bin center and points are connected. Values are mean ± SE of all models in the group. * denotes percentage volume of the overloaded or underloaded models is significantly different from the control group at the specific strain bin (p<0.05). +denotes percentage volume of overloaded models is significantly different from that of underloaded models at the specified strain bin (p<0.05).
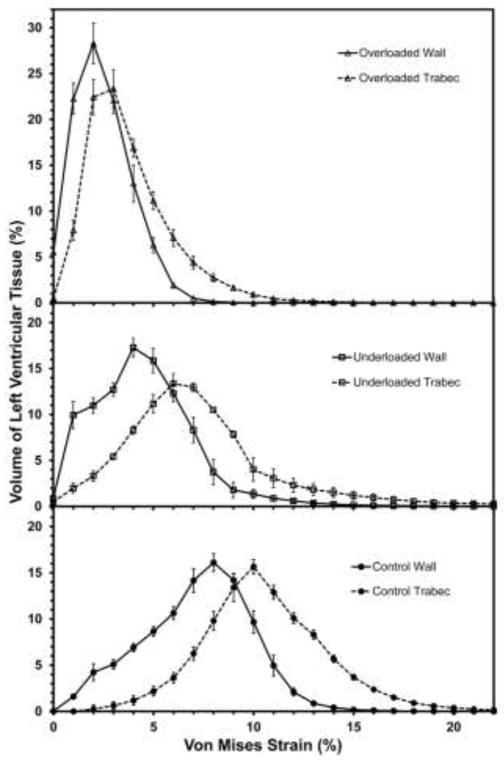
The wall-trabeculae histograms (Fig. 10) show that a significantly greater volume percentage of the trabeculae is strained at a higher level than that of the wall (p<0.01 in all groups). The VWA VM strains for wall vs trabeculae are 7.2 vs 10.5% in the control group, 4.8 vs 7.8% in the underloaded group, and 2.5 vs 3.8% in the overloaded group.
Figure 10.
Histograms of percentage of left ventricular tissue volume versus von Mises strain for both ventricular wall and trabecular tissue for the three treatment groups. Values are mean ± SE of all models in the group.
Epicardial strains were largest on the ventricular freewall opposite the septum at locations approximately midway between the base and atrial border (Fig. 8). The average VM strain was determined in a 400-μm square region of epicardium in this location. This region corresponds to the region of epicardium used for the strain measurement in the ultrasound images. The epicardial strains from the finite element analysis were 10.1 ± 1.8% control, 10.3 ± 2.4% underloaded, and 8.4 ± 2.4% overloaded (mean ± SD, all comparisons non-significant).
3.5 Sensitivity Analysis
As would be expected, the No Adaptation models (control geometry with overloaded pressure), had a large increase in VWA VM stress, from 115 to 218 Pa. The VWA VM strain also increased, but not by as large a percentage: from 11% to 15% (Table 2). In the Stiffness Adaptation models, the VWA VM stress increased to 185 Pa, while the VWA VM strain decreased dramatically to 5%. Stress rose approximately the same amount (to 183 Pa) in the Geometry Adaptation models, but strain remained high (14%).
3.6 Ultrasound measurements
Based on the change of arclength of the epicardial border as viewed in the longitudinal and circumferential directions, as seen in ultrasound images, the VM strain was calculated as 12.2% ± 2.0% in control hearts and 10.0% ± 2.6% in overloaded hearts (mean ± SD).
4 Discussion
4.1 Significance of Results
This study uses techniques in confocal microscopy, digital reconstruction, and finite element analysis, along with pressure measurement, material property characterization, and ultrasound analysis, to compare calculated stress and strain throughout the left ventricle in stage-29 (ED 6) control hearts and those subjected to pressure overload and underload at stage 21 (ED 3.5). As stress is not measurable and strain cannot be measured throughout the embryonic ventricle with current techniques, the calculations provide the only current global estimates of stress and strain in these hearts. At stage 21, the muscular intraventricular septum exists only in its primordial form of a more prominent trabecular ridge, the ventricle is filled with a fine network of trabeculae and considerable trabecula-free lumen, and the atrioventricular cushions and endocardial cushions in the common outflow tract are just beginning to mature. By stage 29, the trabeculae have transformed into fenestrated trabecular sheets, compact wall thickness has increased, the intraventricular septum has grown towards the atrioventricular cushions and started to fuse with them, distinct mitral and tricuspid valve primordia develop from the fused atrioventricular cushions, and septation of the outflow tract is almost complete (Martinsen 2005; Sedmera et al. 1998). Thus this period is crucial in formation of the adult four-chambered structure and myocardial microstructure.
One effect of altered pressure, as verified here by digital reconstructions, is a significant increase in total tissue volume and cavity volume in hearts overloaded by CTB, agreeing with SEM studies of isolated slices (Sedmera et al. 1999). The increased tissue volume suggests accelerated development, although other markers such as fiber quantity, fiber angles, innervation/excitation patterns, and trabecular patterns were not compared. Clark et al. (1989), studying stage-29 chick ventricles that had undergone conotruncal banding at stage 21, found that the increase of ventricular mass was due to myocyte hyperplasia based on the proportion of subcellular organelles, cell area, and DNA-to-total-protein ratio. Increased tissue volume suggests decreased wall stress for the same internal pressure, although increased cavity volume in a pressurized shell would tend to increase wall stress for the same internal pressure and total volume.
The significantly decreased cavity volume in the underloaded hearts relative to control (p<0.05) suggests decreased wall stress. Studies in mechanically underloaded left ventricles in the model of left atrial ligation (Sedmera et al., 1999) have shown that underloaded left ventricular wall tends to compact precociously, which may explain the cavity volume changes.
Another effect of abnormal mechanical loading over the 2.5-day period from stage 21 to 29 was altered stress-strain relationships, which, in combination with the altered pressure, greatly affected the magnitudes of von Mises stress and strain in realistic three-dimensional models. The magnitudes of stress and strain calculated with finite element analysis were compared qualitatively by inspection of 3D contour plots and quantitatively by volume histograms and volume-weighted averages (VWA). The stresses in pressure-underloaded models were significantly lower than in control models (64 vs 115 Pa VWA, a 44% decrease) due to three factors: a 35% decrease in intraventricular pressure, a 10% reduction in cavity volume, and a 14% increase in tissue volume. However, the stress-strain relationship did not “soften” enough to make the underloaded volume-strain relationship or VWA strain similar to control (7% vs 11% VWA, p<0.01). In pressure-overloaded models, the effect of larger cavity volume (49%) in increasing stress is likely much more significant than the effect of the larger tissue volume (51%) in decreasing stress (based on estimations with a thick-shelled spherical model). The increased pressure (49%) and increased cavity volume cause increased VWA stress (147 vs 115 Pa, p<0.01), but due to a greatly stiffened stress-strain relationship, the volume-strain relationship and VWA strain for pressure overloaded models were significantly lower than in control models (4% vs 11%, p<0.01). In a volume-weighted sense, then, neither the overloaded or underloaded model showed normalization of end-diastolic stress or strain. Comparison of the underloaded and overloaded response also highlights the observation that the biological response to abnormal mechanical loading is not necessarily linear. The sensitivity analysis evaluated the relative influence of changes in geometry and tissue stiffness on VM stress and strain with overloaded pressure. The overloaded case was chosen for these studies since the difference in strain from control was much greater than in the underloaded case. If the pressure had risen in the control LV models (VWA VM stress and strain 115 Pa and 11%) to that of overloaded hearts, VM stress and strain would be 218 Pa and 15% with No Adaptation, 185 Pa and 5% with Stiffness Adaptation, and 183 Pa and 14% with Geometry Adaptation. Thus both adaptations result in approximately the same stress distribution, but the stiffness adaptation is largely responsible for the decreased strain seen in the overloaded models. This suggests further study into cellular and extracellular proteins which can increase passive tissue stiffness as a measure of adaptation.
4.2 Metrics for Evaluation of Adaptation and Normalization
Different conclusions regarding normalization can be drawn from these results if strain is compared among treatments in a more limited area of the LV. For example, the stress and strain in the apical regions were low in all models and so could be considered unchanged in underloaded and overloaded cases. Also, differences among the calculated epicardial mid-ventricular level strain (10.1, 10.3, 8.4%) are statistically insignificant and normalization could be concluded based on this metric.
Previous studies in the mature and developing heart have reported normalized end-diastolic strain based on a variety of metrics. In the mature heart, Emery and Omens (1997) observed normalization of muscle fiber strain in rats at 6 wk after volume overload by AV fistula, although fiber stress remained elevated. Strain was measured from three piezoelastic crystals implanted at the LV midwall and stress calculated from pressure with a prolate spheroidal finite element model. Both Florenzano and Glantz (1987) and Nguyen et al. (1993) found that end-diastolic stress returned to normal levels in dogs subjected to LV pressure overload. Measurements were based on 7–11 implanted radiopaque markers, echo recordings, and an assumed cylindrical shell shape. In the embryonic chick heart, Tobita et al. (2002) reported normalization of LV end-diastolic stress and strain at stage 27 after pressure overload from conotruncal banding at stage 21. Strain was calculated from video tracking of epicardial microspheres in a limited mid-ventricular region; stress was estimated from pressure assuming a thin-walled, uniform-thickness, axisymmetric, ellipsoidal model of the LV based on the thickness of the compact layer. Note that although the embryonic stage in the Tobita et al. experimental study (stage 27) is close to that in the current study (stage 29), a more limited geometric region and different strain measure were used for comparison in the experimental study; thus the results are not directly comparable to the current computational study.
Some computational studies have approached the normalization and metric question prospectively with growth law formulation. Lin and Taber (1995) found that a growth law based on end-diastolic stress in a cylindrical model of the stage 21–29 chick could predict changes in radius and wall volume similar to experimental observations through stage 27 but not at stages 27–29. Taber and Chabert (2002) showed a promising growth law based on end-systolic stress and end-diastolic stretch in a cylindrical representation of the base of the LV.
The choice of metric depends on currently unavailable knowledge of the sensing and actuating mechanisms, their distribution, and the type of response. Use of a volume-weighted metric assumes that sensors are distributed evenly through the LV, have a stimulus-graded response, and that all areas of the ventricle respond equally to stress or strain. Various sensors have been proposed in the mature heart: extracellular matrix, focal adhesions and integrin-mediated pathways, adherens-junction, titin filaments and z-disk, and cell membrane and cytoskeleton, to name a few (Hoshijima 2006; Linke 2008; Omens 1998). Little study exists about sensors in the embryonic heart. By allowing comparison of different metrics, modeling studies such as described here may help narrow the search for the sensing/actuation mechanism and suggest further avenues of experimentation.
4.3 Finite Element Modeling of Cardiac Development
The finite element method has been used in a few studies of the embryonic heart, although to our knowledge this is the first analysis of a trabeculated stage with accurate geometry. Xie and Perucchio (2001) created a voxel-based finite element model of the trabeculated stage-21 chick heart, but modeled the trabeculae locally at the level of small volumes which were then incorporated into a smooth-walled global model. Damon et al. (2009) modeled the stage-21 chick heart as a smooth-walled looped tube by tracing the outer and interior contours from vibratome-sectioned confocal images and smoothing to the innermost trabeculae. As in our model, the model of Damon et al. (2009) showed higher stresses in the inside of the ventricle, albeit to a much lesser degree.
The complicated trabecular geometry presents challenges for finite element mesh generation. Commercial automatic mesh generators for such structures are available for tetrahedral meshes but not hexahedral meshes. Four-node tetrahedral elements were used in this study because of difficulty encountered with ten-node tetrahedra. The limitation of using linear rather than quadratic elements should be re-examined when better meshing algorithms are available.
Epicardial strain is the most accessible quantity to use for comparison of finite element results with experimental measurements. Our contour-tracing of high-resolution ultrasound images found von Mises strains of 12.2% and 10.0% for control and overloaded groups in an approximately 400-μm square region of epicardial surface located at mid-ventricular level opposite the ventricular septum. These strains are slightly but non-significantly higher than the computed epicardial strains (10.1% and 8.4%) in the same region. Like the calculated results, they show larger strain in the control hearts than in overloaded hearts.
Tobita and Keller (2000) measured epicardial strain in small triangular regions, 70–100 μm on a side, defined by markers adhered to the LV epicardium. Their measurements in the LV at stage 27 show approximately 13.7% equivalent 3D von Mises strain at end diastole. The agreement with the ultrasound measurements is reasonable, given the difference in age and limitations of both methods of measurement. Video planimetry of surface markers uses small regions, where localized variability could skew the results, and omits radial strain. The ultrasound measurement method used here depends on the ability to identify landmarks in the reference and deformed configurations, assumes the principal strain directions, uses ex ovo measurements, and requires images at the proper orientation and position.
4.4 Spatial Distribution of Stress and Strain
These model results quantize the spatial variation of passive stress and strain due to the trabeculated embryonic LV geometry. The largest stresses occur in the trabeculae; models that omit the trabecular geometry will predict lower stresses that likely do not represent true trabecular stress. The current results also suggest that trabeculae may play a large role in the ventricle’s adaptation to altered mechanical load.
Since the model results show a large spatial variation of stress and strain, if either are a stimulating or inhibiting factor for cell proliferation or changes such as increased myofiber production, a large gradient in these effects may occur. Indeed, Jeter and Cameron (1971) used tritiated thymidine labeling to show that proliferative activity is significantly greater in the left ventricular myocardium near the epicardial surface than in the inner wall regions in stage 29 chick. They found little proliferative activity in the interventricular septum. Grohmann (1961) noted lower proliferation in the muscular interventricular septum formed by trabecular coalescence in the chick. Thus strain, which is largest in the trabeculae, may condition the trabeculae towards differentiation and against proliferation.
4.5 Assumptions and Limitations
Several assumptions in material properties were included in these models. The LV stress-strain relationship was assumed to be homogeneous, i.e., the same everywhere in the ventricle. Residual stress may exist at these stages (Taber and Chabert 2002; Wong and Miller 2002), but is not included as the magnitude and distribution of tissue residual stress is unknown. Preliminary studies have indicated some variability of residual stress with altered pressure (Wong and Miller 2002). In these experiments, a 350-μm thick trabecula-free slice was extracted perpendicular to the apico-basal axis in the apical region of the stage-29 LV. A radial cut was made at the outer curvatures and inner, midwall, and outer opening angles were measured and averaged to determine average opening angle. Results (mean ± SD) were 42.0° ± 9.7° in control (n=14), 69.3° ± 12.7° in overloaded (n=10), and 31.3° ± 8.2° in underloaded (n=13). The larger opening angle and stiffer stress/strain relationship in the overloaded case indicates larger circumferential residual stress in the overloaded group compared to control. A simple annular representation of the geometry using the opening angles and stress/strain relations for each treatment group predicts residual circumferential stresses with magnitudes less than 15 Pa and overloaded residual stress approximately 4.5 times control. These magnitudes would not appreciably shift the conclusions of the study, but further detailed measurements are necessary for a more complete assessment.
The myocardial tissue in these models is assumed isotropic. Tobita et al. (2005), using confocal scanning with f-actin staining on mid-ventricular sections of LV compact myocardium, found a relatively uniform transmural circumferential orientation of fibers at stage 27, which changed significantly by stage 31. However, Wenink et al. (1996) found that even though confocal laser scanning showed myocyte and myofiber orientation in embryonic rat at comparable stages, electron microscopy showed that even by ED 17, myofibrils never completely filled the myocytes and lack of organization was predominant, implying that confocal predictions of myofiber orientation should be interpreted with caution. With conflicting measurements and since microstructure may not always reflect material behavior, anisotropy was not included here. A small degree of anisotropy is unlikely to influence the large differences in stress and strain seen in these models, particularly in stress, since stress is influenced less by material properties. If investigation of anisotropic or inhomogeneous properties is done, they could be tested in a more idealized ventricular model with regular geometry to assess the appropriateness of inclusion in accurate trabecular models.
The hyperelastic material model used here was based on uniaxial measurements. The parameters were determined by optimizing the material parameters to obtain a best match of results from a finite-element model of the experimental procedure to the experimental stress-strain results. Because of the uniaxial nature of the test, however, the material model may not be unique. Biaxial testing, although challenging in the early embryonic myocardium due to geometry and fragility constraints, permits a larger variation of strain invariants for verifying hyperelastic models and should be explored for further verification of the most appropriate constitutive relationship.
In these models, end-diastolic pressure was applied as a static loading normal to all interior surfaces, with shear stress loading from blood flow ignored. No measurements of wall shear stress in the stage-29 chick ventricle exist, but these forces are likely significantly lower than the normal pressure, although they may contribute to remodeling by a mechanism different from normal pressure loading. Poelma et al. (2009) calculated wall shear stresses less than 20 Pa in the outflow tract of the stage-17 chick at ejection; the wall shear stresses in the left ventricle at end diastole should be much less than this.
This study assesses only end-diastolic stress and strain as triggering and controlling factors for ventricular remodeling. The choice of the end-diastolic condition was based on measurements of passive myocardial stiffening with pressure overload, observations from other studies cited in Section 4.2, and on the fact that end-diastolic pressure is reached or exceeded for a large part of the cardiac cycle, providing the end-effectors more time to react. Other candidate quantities which should be investigated in a study of the control factors for altered mechanical loading are peak and end-systolic stress and strain. Guccione et al. (1995) analyzed an axisymmetric, smooth-walled model of the beating dog heart by incorporating an active component of fiber stress, with parameters for the active stress derived from experimental measurements of sarcomere length and tension (Guccione et al. 1993). The current model could be extended to incorporate active stresses if similar measurements of contraction parameters and knowledge of myofiber geometry are included.
4.6 Conclusions
This study has demonstrated that realistic three-dimensional digital models of the pre-septated, trabeculated left ventricle in control conditions and after altered hemodynamic loading are possible from confocal imaging. Stress and strain throughout the volume can be calculated with realistic loading, material properties, and boundary conditions. The trabeculae undergo significantly larger stresses and strains than the compact wall; thus, models not including accurate trabecular geometry will underpredict stress and strain. The trabeculae may also play an important role in sensing and actuating the myocardial response to mechanical load. The values of strain calculated here could be useful in manipulating cultured cells or more advanced tissue-engineering constructs to obtain desired biological response. Neither stress nor strain was normalized in a volume-weighted sense in the overloaded and underloaded models. Overloaded models were particularly striking in their difference in strain from control models, the difference being mostly attributed to a stiffening of the stress-strain relationship. Normalization of strain, however, was observed in matched epicardial regions. Increased pressure caused a much greater increase in stress than in strain in control models, suggesting that stress may be an important trigger to growth and remodeling. Development of an appropriate metric for evaluating the evolution of stress and strain in pressure-induced adaptation is important to assess both experimental and modeling results and provide insight into the sensing mechanism.
Acknowledgments
This work was supported by grants from the National Institute of Biomedical Imaging and Bioengineering, National Institutes of Health (EB002077); National Center for Research Resources, National Institutes of Health (RR16434); Academy of Sciences of the Czech Republic Purkinje Fellowship (D.S.); Ministry of Education, Youth and Sports of the Czech Republic (VZ 0021620806); and Grant Agency of the Czech Republic (304/08/0615).
Contributor Information
Christine M. Buffinton, Email: christine.buffinton@bucknell.edu, Department of Mechanical Engineering, Bucknell University, One Dent Drive, Lewisburg, PA 17837, Phone: 570-577-1819, Fax: 570-577-7281
Daniela Faas, Email: dfaas@seas.harvard.edu, Department of Mechanical Engineering, Bucknell University, One Dent Drive, Lewisburg, PA 17837.
David Sedmera, Email: david.sedmera@lf1.cuni.cz, Department of Cell Biology and Anatomy, Medical University of South Carolina, 173 Ashley Avenue, Charleston, SC 29425. Department of Cardiovascular Morphogenesis, Institute of Physiology, Academy of Sciences of the Czech Republic, Prague, Czech Republic. Institute of Anatomy, First Faculty of Medicine, Charles University in Prague, Prague, Czech Republic.
References
- Auerbach R, Kubai L, Knighton D, Folkman J. A simple procedure for the long-term cultivation of chicken embryos. Dev Biol. 1974;41:391–394. doi: 10.1016/0012-1606(74)90316-9. [DOI] [PubMed] [Google Scholar]
- Clark EB, Hu N, Turner DR, Litter JE, Hansen J. Effect of chronic verapamil treatment on ventricular function and growth in chick embryos. Am J Physiol Heart Circ Physiol. 1991;261:H166–71. doi: 10.1152/ajpheart.1991.261.1.H166. [DOI] [PubMed] [Google Scholar]
- Clark EB, Hu N, Frommelt P, Vandekieft GK, Dummett JL, Tomanek RJ. Effect of increased pressure on ventricular growth in stage 21 chick embryos. Am J Physiol Heart Circ Physiol. 1989;257:H55–61. doi: 10.1152/ajpheart.1989.257.1.H55. [DOI] [PubMed] [Google Scholar]
- Clark EB, Hu N. Developmental hemodynamic changes in the chick embryo from stage 18 to 27. Circ Res. 1982;51:810–815. doi: 10.1161/01.res.51.6.810. [DOI] [PubMed] [Google Scholar]
- Damon BJ, Remond MC, Bigelow MR, Trusk TC, Xie W, Perucchio R, Sedmera D, Denslow S, Thompson RP. Patterns of muscular strain in the embryonic heart wall. Dev Dyn. 2009;238:1535–1546. doi: 10.1002/dvdy.21958. [DOI] [PMC free article] [PubMed] [Google Scholar]
- deAlmeida A, McQuinn T, Sedmera D. Increased ventricular preload is compensated by myocyte proliferation in normal and hypoplastic fetal chick left ventricle. Circ Res. 2007;100:1363–1370. doi: 10.1161/01.RES.0000266606.88463.cb. [DOI] [PubMed] [Google Scholar]
- Douglas AS, Rodriguez EK, O’Dell W, Hunter WC. Unique strain history during ejection in canine left ventricle. Am J Physiol Heart Circ Physiol. 1991;260:H1596–611. doi: 10.1152/ajpheart.1991.260.5.H1596. [DOI] [PubMed] [Google Scholar]
- Emery JL, Omens JH. Mechanical regulation of myocardial growth during volume-overload hypertrophy in the rat. Am J Physiol Heart Circ Physiol. 1997;273:H1198–204. doi: 10.1152/ajpheart.1997.273.3.H1198. [DOI] [PubMed] [Google Scholar]
- Filas BA, Efimov IR, Taber LA. Optical coherence tomography as a tool for measuring morphogenetic deformation of the looping heart. Anat Rec. 2007;290:1057–1068. doi: 10.1002/ar.20575. [DOI] [PubMed] [Google Scholar]
- Florenzano F, Glantz SA. Left ventricular mechanical adaptation to chronic aortic regurgitation in intact dogs. Am J Physiol Heart Circ Physiol. 1987;252:H969–84. doi: 10.1152/ajpheart.1987.252.5.H969. [DOI] [PubMed] [Google Scholar]
- Grohmann D. Mitotic growth potential of embryonic and fetal chicken hearts and its significance for the understanding of heart malformations. Z Zellforsch Mikrosk Anat. 1961;55:104–122. [PubMed] [Google Scholar]
- Guccione JM, Costa KD, McCulloch AD. Finite element stress analysis of left ventricular mechanics in the beating dog heart. J Biomech. 1995;28:1167–1177. doi: 10.1016/0021-9290(94)00174-3. [DOI] [PubMed] [Google Scholar]
- Guccione JM, Waldman LK, McCulloch AD. Mechanics of active contraction in cardiac muscle: Part II--cylindrical models of the systolic left ventricle. J Biomech Eng. 1993;115:82–90. doi: 10.1115/1.2895474. [DOI] [PubMed] [Google Scholar]
- Hamburger V, Hamilton HL. A series of normal stages in the development of the chick embryo.1951. Dev Dyn. 1992;195:231–272. doi: 10.1002/aja.1001950404. [DOI] [PubMed] [Google Scholar]
- Hoshijima M. Mechanical stress-strain sensors embedded in cardiac cytoskeleton: Z disk, titin, and associated structures. Am J Physiol Heart Circ Physiol. 2006;290:H1313–25. doi: 10.1152/ajpheart.00816.2005. [DOI] [PMC free article] [PubMed] [Google Scholar]
- Jeter JR, Jr, Cameron IL. Cell proliferation patterns during cytodifferentiation in embryonic chick tissues: liver, heart and erythrocytes. J Embryol Exp Morphol. 1971;25:405–422. [PubMed] [Google Scholar]
- Keller BB, Yoshigi M, Tinney JP. Ventricular-vascular uncoupling by acute conotruncal occlusion in the stage 21 chick embryo. Am J Physiol Heart Circ Physiol. 1997;273:H2861–6. doi: 10.1152/ajpheart.1997.273.6.H2861. [DOI] [PubMed] [Google Scholar]
- Lin IE, Taber LA. A model for stress-induced growth in the developing heart. J Biomech Eng. 1995;117:343–349. doi: 10.1115/1.2794190. [DOI] [PubMed] [Google Scholar]
- Linke WA. Sense and stretchability: the role of titin and titin-associated proteins in myocardial stress-sensing and mechanical dysfunction. Cardiovasc Res. 2008;77:637–648. doi: 10.1016/j.cardiores.2007.03.029. [DOI] [PubMed] [Google Scholar]
- Martinsen BJ. Reference guide to the stages of chick heart embryology. Dev Dyn. 2005;233:1217–1237. doi: 10.1002/dvdy.20468. [DOI] [PubMed] [Google Scholar]
- McQuinn TC, Bratoeva M, Dealmeida A, Remond M, Thompson RP, Sedmera D. High-frequency ultrasonographic imaging of avian cardiovascular development. Dev Dyn. 2007;236:3503–3513. doi: 10.1002/dvdy.21357. [DOI] [PubMed] [Google Scholar]
- Miller CE, Thompson RP, Bigelow MR, Gittinger G, Trusk TC, Sedmera D. Confocal imaging of the embryonic heart: how deep? Microsc Microanal. 2005;11:216–223. doi: 10.1017/S1431927605050464. [DOI] [PubMed] [Google Scholar]
- Miller CE, Wong CL, Sedmera D. Pressure overload alters stress-strain properties of the developing chick heart. Am J Physiol Heart Circ Physiol. 2003;285:H1849–56. doi: 10.1152/ajpheart.00384.2002. [DOI] [PubMed] [Google Scholar]
- Nguyen TN, Chagas AC, Glantz SA. Left ventricular adaptation to gradual renovascular hypertension in dogs. Am J Physiol Heart Circ Physiol. 1993;265:H22–38. doi: 10.1152/ajpheart.1993.265.1.H22. [DOI] [PubMed] [Google Scholar]
- O’Dell WG, Schoeniger JS, Blackband SJ, McVeigh ER. A modified quadrupole gradient set for use in high resolution MRI tagging. Magn Reson Med. 1994;32:246–250. doi: 10.1002/mrm.1910320215. [DOI] [PMC free article] [PubMed] [Google Scholar]
- Omens JH. Stress and strain as regulators of myocardial growth. Prog Biophys Mol Biol. 1998;69:559–572. doi: 10.1016/s0079-6107(98)00025-x. [DOI] [PubMed] [Google Scholar]
- Poelma C, Van der Heiden K, Hierck BP, Poelmann RE, Westerweel J. Measurements of the wall shear stress distribution in the outflow tract of an embryonic chicken heart. J R Soc Interface. 2009;7:91–103. doi: 10.1098/rsif.2009.0063. [DOI] [PMC free article] [PubMed] [Google Scholar]
- Reckova M, Rosengarten C, deAlmeida A, Stanley CP, Wessels A, Gourdie RG, Thompson RP, Sedmera D. Hemodynamics is a key epigenetic factor in development of the cardiac conduction system. Circ Res. 2003;93:77–85. doi: 10.1161/01.RES.0000079488.91342.B7. [DOI] [PubMed] [Google Scholar]
- Rychter Z, Rychterova V, Lemez L. Formation of the heart loop and proliferation structure of its wall as a base for ventricular septation. Herz. 1979;4:86–90. [PubMed] [Google Scholar]
- Sedmera D, Pexieder T, Rychterova V, Hu N, Clark EB. Remodeling of chick embryonic ventricular myoarchitecture under experimentally changed loading conditions. Anat Rec. 1999;254:238–252. doi: 10.1002/(SICI)1097-0185(19990201)254:2<238::AID-AR10>3.0.CO;2-V. [DOI] [PubMed] [Google Scholar]
- Sedmera D, Pexieder T, Hu N, Clark EB. A quantitative study of the ventricular myoarchitecture in the stage 21–29 chick embryo following decreased loading. Eur J Morphol. 1998;36:105–119. doi: 10.1076/ejom.36.2.105.4775. [DOI] [PubMed] [Google Scholar]
- Taber LA. Biomechanics of cardiovascular development. Annu Rev Biomed Eng. 2001;3:1–25. doi: 10.1146/annurev.bioeng.3.1.1. [DOI] [PubMed] [Google Scholar]
- Taber LA, Chabert S. Theoretical and experimental study of growth and remodeling in the developing heart. Biomech Model Mechanobiol. 2002;1:29–43. doi: 10.1007/s10237-002-0002-3. [DOI] [PubMed] [Google Scholar]
- Taber LA, Hu N, Pexieder T, Clark EB, Keller BB. Residual strain in the ventricle of the stage 16–24 chick embryo. Circ Res. 1993;72:455–462. doi: 10.1161/01.res.72.2.455. [DOI] [PubMed] [Google Scholar]
- Tobita K, Garrison JB, Liu LJ, Tinney JP, Keller BB. Three-dimensional myofiber architecture of the embryonic left ventricle during normal development and altered mechanical loads. An. 2005;283:193–201. doi: 10.1002/ar.a.20133. [DOI] [PubMed] [Google Scholar]
- Tobita K, Schroder EA, Tinney JP, Garrison JB, Keller BB. Regional passive ventricular stress-strain relations during development of altered loads in chick embryo. Am J Physiol Heart Circ Physiol. 2002;282:H2386–96. doi: 10.1152/ajpheart.00879.2001. [DOI] [PubMed] [Google Scholar]
- Tobita K, Keller BB. Right and left ventricular wall deformation patterns in normal and left heart hypoplasia chick embryos. Am J Physiol Heart Circ Physiol. 2000;279:H959–69. doi: 10.1152/ajpheart.2000.279.3.H959. [DOI] [PubMed] [Google Scholar]
- Tuan RS. Supplemented eggshell restores calcium transport in chorioallantoic membrane of cultured shell-less chick embryos. J Embryol Exp Morphol. 1983;74:119–131. [PubMed] [Google Scholar]
- Wenink AC, Knaapen MW, Vrolijk BC, VanGroningen JP. Development of myocardial fiber organization in the rat heart. Anat Embryol. 1996;193:559–567. doi: 10.1007/BF00187927. [DOI] [PubMed] [Google Scholar]
- Wong CL, Miller CE. Residual strain changes with left ventricular pressure in the developing heart. 2nd Joint Conference of the IEEE Engineering in Medicine and Biology Society and the Biomedical Engineering Society; Oct. 23–26, 2002; Houston, TX. 2002. [Google Scholar]
- Xie W, Perucchio R. Multiscale finite element modeling of the trabeculated embryonic heart: Numerical evaluation of the constitutive relations for the trabeculated myocardium. Comput Meth Biomec. 2001;4:231–248. [Google Scholar]


