

Abstract
Data on birth weight for gestational age are not well described for infants with trisomy 21 (T21), trisomy 18 (T18), or trisomy 13 (T13). We report on anthropometric charts of infants with these conditions using data from the Vermont Oxford Network (VON). Data from a total of 5147 infants with T21 aged 22–41 weeks, 1053 infants with T18 aged 22–41 weeks and 613 infants with T13 aged 22–40 weeks were used to create birth weight for gestational age charts. Head circumference for gestational age charts were created for infants with T21 only. Combined-sex charts were generated for infants with T18 or T13 while sex-specific charts were generated for infants with T21. Smoothed centiles were created using LmsChartMaker Pro 2.3. Among the three examined groups, infants with T18 were the most likely to be growth restricted while infants with T21 were the least likely to be growth restricted. The new charts for infants with T21 were also compared to the Lubchenco and Fenton charts and both show frequent misclassification of infants with T21 as small or large for gestational age. The new charts should prove to be useful, especially for infants with T21, to assist in medical management and guide nutrition care decisions.
Keywords: Trisomy 21, trisomy 18, trisomy 13, Down syndrome, Edward syndrome, Patau syndrome, autosomal trisomies, growth curves, neonatal anthropometric charts, intrauterine growth, weight for gestational age, head circumference for gestational age
INTRODUCTION
Trisomy 21 (Down syndrome, T21), trisomy 18 (Edward syndrome, T18) and trisomy 13 (Patau syndrome, T13) represent the most common autosomal trisomies observed among live-born infants [Parker et al., 2010]. These chromosomal abnormalities often lead to profound effects on physical and neurodevelopmental outcomes. As infants with trisomy 21 often survive beyond a year of life, in comparison to infants with the other autosomal trisomies, longitudinal postnatal growth curves have been developed for these infants as an aid to diagnose additional conditions that might affect their postnatal development [Myrelid et al., 2002; Palmer et al., 1992; Piro et al., 1990]. Equally important also in predicting short term morbidity and mortality outcomes, are intrauterine or anthropometric charts to evaluate a fetus’ or an infant’s growth relative to gestational age (GA) either as growth restricted (small for gestational age, SGA), appropriate for gestational age (AGA), or overgrown (large for gestational age, LGA) [Battaglia et al., 1967; Lubchenco et al., 1972a; Lubchenco et al., 1972b].
As sample size is a major limitation for constructing anthropometric charts for infants with T21, T18 or T13 and in particular for preterm infants with these conditions, we used a large dataset collected by hospitals participating in the Vermont Oxford Network (VON) to create these charts for the assessment of weight for GA for infants with T21, T18 or T13 and head circumference for GA for infants with T21.
MATERIALS and METHODS
Cross-sectional data collected by centers participating in the Vermont Oxford Network (VON) were used. VON is a non-profit voluntary collaboration of health care professionals dedicated to improving the outcomes of high-risk newborn infants and comprised of US and international Neonatal Intensive Care Units (NICUs). The use of the VON database for research has been approved by the Committee for Human Research at the University of Vermont. Participating centers can be part of either the very low birth weight (VLBW) database or the expanded database. The expanded database eligibility started in year 2001 and includes all infants admitted to the NICU, regardless of birth weight, and any infant who dies at any location in the hospital within 28 days of birth without first having gone home. Eligibility criteria for centers participating in the VLBW database included: from 1994–1995, infants with birth weight 501–1500 grams; from 1996–2004, infants with birth weight 401–1500 grams; and from 2005-present, infants with birth weight 401–1500 grams or with GA between 22 weeks 0 days and 29 weeks 6 days (inclusive). For the purpose of developing the anthropometric charts for infants with T21, T18 or T13, all data collected from 2001–2009 from centers participating in the expanded database were used. Data based on the GA definition 22–29 weeks from the 2005–2009 period were used for centers participating only in the VLBW database. As data collected from VLBW centers prior to 2005 were based mainly on birth weight (1994–1995, 501–1500 grams; 1996–2004, 401–1500 grams) and would more likely include a higher percentage of growth restricted infants, especially infants in the upper level of birth weight categories, selection from those centers included only infants with GAs satisfying the upper bound distribution of birth weight of infants enrolled from the expanded centers and from the VLBW centers based on the GA eligibility criteria of 22–29 weeks from 2005–2009. This selection would mainly include infants in the lower GA categories whose birth weight would not be expected to exceed 1500 grams. Accordingly, selected infants from the VLBW centers from 1994–2004 included: infants with T21 with GAs 22–26 weeks, infants with T18 with GAs 22–29 weeks, and infants with T13 with GAs 22–28 weeks (Figure 1).
FIGURE 1.

Data selection process to construct the birth weight for gestational age VON charts of infants with T21, T18 or T13
Data on head circumference were collected starting in year 2006. Thus, all data were used from the centers participating in the expanded database and data based on the GA eligibility (22–29 weeks) for centers participating in the VLBW database only. Because of sample size limitations, head circumference for GA is presented for infants with T21 only.
Length of gestation was calculated in terms of completed weeks. GA as defined in the VON manual of operations is determined using obstetrical measures based on last menstrual period, obstetrical parameters, prenatal ultrasound and postnatal physical examinations [Vermont Oxford Network, 2010]. Birth weight, measured on an electronic scale to the nearest gram, and recorded from the labor and delivery, is used as a first source and if unavailable, the weight on admission to the neonatal unit is used [Vermont Oxford Network, 2010]. Birth head circumference is recorded to the nearest tenth of a centimeter on the day of birth and if not measured on the day of birth, the first head circumference measurement on the following day is recorded [Vermont Oxford Network, 2010].
The current charts are based on singletons with recorded GAs ranging between 22 and 41 weeks for infants with T21, 22 and 41 weeks for infants with T18 and 22 and 40 weeks for infants with T13. Implausible growth measurements for each group of infants (T21, T18 or T13) were detected based on Tukey’s methodology which calculates the interquartile range and identifies as outliers any values more than twice the interquartile range below the first quartile and above the third quartile for each GA [Tukey, 1977]. For GAs with low counts (n<30), outliers detected by Tukey’s method were first inspected and the decision of whether to exclude these infants was made accordingly. This cut-off sample size (n<30) was a qualitative assessment based on visually inspecting the outliers.
The effect of sex on GA-specific birth weight was also examined by calculating means and standard deviations of birth weight by GA groups (23–26, 27–31, 32–36 and 37–41 weeks) for males and females separately and fitting an analysis of variance (ANOVA) model to test for statistical significance. An adjusted p-value for multiple testing of 0.0125 was considered for statistical significance. The effect of race/ethnicity on birth weight was not examined. All of the above analyses were performed using SAS 9.2.
Curve Creation
Smoothed centile curves for the 3rd, 10th, 25th, 50th, 75th, 90th and 97th centiles were created using LmsChartMaker Pro 2.3 [Cole et al., 1992]. The LMS method developed by Cole and Green estimates three age-specific parameters: the Box-Cox power transformation to normality (L), the median (M) and the coefficient of variation (S). Smooth, non-linear fitting of the three parameters is done by fitting cubic splines by using a penalized likelihood. This transforms to the standard deviation z-score of a particular measurement (X=birth weight or head circumference) at each week of gestation according to the following formula: z= [(X/M) L−1]/ (LS) [Cole et al., 1992]. The goodness of fit of the smoothed curves was assessed by careful review of the shapes of the worm plots formed by a cubic polynomial and by plotting the empirical (based on raw data) and fitted centiles on top of each other [van Buuren et al., 2001]. The worm plots were generated using R 2.12.2 while Microsoft Excel 2007 was used to plot the centiles generated from the LmsChartMaker Pro. Sex-specific curves of birth weight and birth head circumference for GA were developed for infants with T21 only while combined-sex curves of birth weight for age were developed for infants with T18 and for infants with T13.
RESULTS
A total of 5192 singleton infants with T21 with GAs between 20 and 43 weeks satisfied the eligibility criteria (5092 infants were contributed from the expanded centers and from VLBW centers based on the GA definition of 22–29 weeks from 2005–2009 and 100 infants with GAs 22–26 weeks were contributed prior to 2005 from VLBW centers). Infants with GAs 20–21 weeks (8 infants), 42–43 weeks (9 infants) as well as infants with physiologically improbable measurements (28 infants) were excluded leading to a final sample size of 5147 infants with T21 (91.7% admitted to US centers) for examining birth weight for GA. Males constituted 54.7% of the sample while the race/ethnicity distribution included 63.0% non-Hispanic white, 18.3% Hispanic, 11.8% black, and 6.9% other. Male infants with T21 were on average heavier than female infants with T21 (Table I). Data on head circumference were available for 3355 infants with T21 enrolled between 2006 and 2009 from expanded centers and based on GAs 22–29 weeks from VLBW centers. The final count included 3315 infants after excluding infants with GAs with low counts including 21–23 weeks (14 infants), 42 weeks (5 infants) and infants with improbable measurements (21 infants). Final weight and head circumference for age curves for female and male infants with T21 are presented in Figure 2. The LMS parameters and the centiles from the smoothed curves are displayed in Table II for female infants with T21 and Table III for male infants with T21.
TABLE I.
Female and male mean birth weights in grams by gestational age group among infants with T21, T18 or T13
| GA, (weeks) | Females | Males | p-value | ||
|---|---|---|---|---|---|
|
| |||||
| N | Mean ± SD | N | Mean ± SD | ||
|
Trisomy 21 N=5147 | |||||
| 22–26 | 93 | 640±183 | 145 | 701±192 | 0.0158 |
| 27–31 | 177 | 1226±422 | 198 | 1293±433 | 0.1282 |
| 32–36 | 571 | 2318±580 | 822 | 2407±554 | 0.0037 |
| 37–41 | 1491 | 3076±501 | 1650 | 3121±519 | 0.0134 |
|
| |||||
|
Trisomy 18 N=1053 | |||||
| 22–26 | 60 | 563±160 | 55 | 626±211 | 0.0723 |
| 27–31 | 115 | 884±241 | 132 | 915±219 | 0.2823 |
| 32–36 | 168 | 1555±351 | 93 | 1573±311 | 0.6834 |
| 37–41 | 299 | 2095±365 | 129 | 2021±348 | 0.0532 |
|
| |||||
|
Trisomy 13 N=613 | |||||
| 22–26 | 43 | 616±190 | 29 | 618±203 | 0.9698 |
| 27–31 | 51 | 1119±279 | 56 | 1097±301 | 0.7067 |
| 32–36 | 91 | 2005±530 | 102 | 2151±463 | 0.0421 |
| 37–40 | 112 | 2700±576 | 128 | 2837±535 | 0.0563 |
GA= gestational age. Excludes infants with missing data on sex T18: 2 infants; T13: 1 infant. Statistical significance is at a p-value=0.0125.
FIGURE 2.

Sex-specific 3rd, 10th, 25th, 50th, 75th, 90th and 97th centiles for infants with trisomy 21 (A) girls’ centiles of birthweight for gestational age (B) girls’ centiles of head circumference for gestational age (C) boys’ centiles of birthweight for gestational age (D) boys’ centiles of head circumference for gestational age
TABLE II.
Birth weight (grams) and head circumference (cm) centiles by gestational age for females with trisomy 21
| GA, wk | N | L d.f.=2 | M d.f.=6 | S d.f=5 | 3 | 10 | 25 | 50 | 75 | 90 | 97 |
|---|---|---|---|---|---|---|---|---|---|---|---|
| 22 | 23 | 0.871 | 484.379 | 0.191 | 304 | 363 | 423 | 484 | 547 | 610 | 674 |
| 23 | 14 | 0.867 | 554.100 | 0.201 | 338 | 408 | 480 | 554 | 629 | 705 | 783 |
| 24 | 19 | 0.863 | 627.719 | 0.212 | 371 | 454 | 540 | 628 | 717 | 808 | 901 |
| 25 | 10 | 0.859 | 709.573 | 0.223 | 404 | 503 | 605 | 710 | 816 | 925 | 1035 |
| 26 | 27 | 0.854 | 803.093 | 0.235 | 440 | 558 | 679 | 803 | 930 | 1060 | 1192 |
| 27 | 29 | 0.848 | 914.799 | 0.247 | 482 | 621 | 766 | 915 | 1068 | 1224 | 1383 |
| 28 | 32 | 0.840 | 1045.259 | 0.259 | 529 | 695 | 867 | 1045 | 1228 | 1416 | 1607 |
| 29 | 55 | 0.833 | 1190.926 | 0.268 | 586 | 780 | 982 | 1191 | 1406 | 1628 | 1854 |
| 30 | 25 | 0.824 | 1351.988 | 0.272 | 658 | 879 | 1111 | 1352 | 1601 | 1856 | 2118 |
| 31 | 36 | 0.814 | 1525.594 | 0.270 | 748 | 996 | 1255 | 1526 | 1805 | 2093 | 2388 |
| 32 | 46 | 0.803 | 1707.501 | 0.263 | 863 | 1132 | 1414 | 1708 | 2012 | 2325 | 2647 |
| 33 | 70 | 0.792 | 1906.508 | 0.250 | 1009 | 1295 | 1595 | 1907 | 2229 | 2562 | 2905 |
| 34 | 108 | 0.780 | 2127.802 | 0.233 | 1194 | 1492 | 1804 | 2128 | 2463 | 2809 | 3164 |
| 35 | 140 | 0.767 | 2372.930 | 0.211 | 1427 | 1729 | 2045 | 2373 | 2711 | 3060 | 3418 |
| 36 | 207 | 0.754 | 2614.953 | 0.188 | 1681 | 1981 | 2293 | 2615 | 2947 | 3289 | 3640 |
| 37 | 392 | 0.742 | 2840.860 | 0.170 | 1921 | 2217 | 2524 | 2841 | 3167 | 3502 | 3846 |
| 38 | 541 | 0.731 | 3047.725 | 0.156 | 2137 | 2431 | 2735 | 3048 | 3370 | 3700 | 4039 |
| 39 | 361 | 0.722 | 3204.142 | 0.145 | 2314 | 2601 | 2898 | 3204 | 3518 | 3840 | 4170 |
| 40 | 165 | 0.715 | 3312.676 | 0.134 | 2459 | 2735 | 3020 | 3313 | 3613 | 3920 | 4235 |
| 41 | 32 | 0.709 | 3405.836 | 0.123 | 2596 | 2859 | 3129 | 3406 | 3690 | 3980 | 4276 |
|
| |||||||||||
| GA, wk | N | L d.f.=1 | M d.f.=5 | S d.f=4 | 3rd | 10th | 25th | 50th | 75th | 90th | 97th |
|
| |||||||||||
| 24 | 9 | 1.037 | 21.223 | 0.099 | 17.0 | 18.4 | 19.8 | 21.2 | 22.6 | 24.0 | 25.4 |
| 25 | 7 | 1.037 | 22.135 | 0.097 | 17.8 | 19.3 | 20.7 | 22.1 | 23.6 | 25.0 | 26.4 |
| 26 | 13 | 1.037 | 23.016 | 0.094 | 18.7 | 20.1 | 21.6 | 23.0 | 24.5 | 25.9 | 27.3 |
| 27 | 15 | 1.037 | 23.868 | 0.090 | 19.5 | 21.0 | 22.4 | 23.9 | 25.3 | 26.7 | 28.2 |
| 28 | 22 | 1.037 | 24.750 | 0.086 | 20.5 | 21.9 | 23.3 | 24.8 | 26.2 | 27.6 | 29.0 |
| 29 | 39 | 1.037 | 25.710 | 0.081 | 21.5 | 22.9 | 24.3 | 25.7 | 27.1 | 28.5 | 29.8 |
| 30 | 14 | 1.037 | 26.742 | 0.076 | 22.7 | 24.0 | 25.4 | 26.7 | 28.1 | 29.4 | 30.8 |
| 31 | 22 | 1.037 | 27.757 | 0.071 | 23.8 | 25.1 | 26.4 | 27.8 | 29.1 | 30.4 | 31.7 |
| 32 | 26 | 1.037 | 28.685 | 0.067 | 24.8 | 26.1 | 27.4 | 28.7 | 30.0 | 31.2 | 32.5 |
| 33 | 43 | 1.037 | 29.543 | 0.062 | 25.8 | 27.1 | 28.3 | 29.5 | 30.8 | 32.0 | 33.2 |
| 34 | 78 | 1.037 | 30.316 | 0.058 | 26.8 | 28.0 | 29.2 | 30.3 | 31.5 | 32.6 | 33.8 |
| 35 | 93 | 1.037 | 31.018 | 0.053 | 27.7 | 28.8 | 29.9 | 31.0 | 32.1 | 33.2 | 34.3 |
| 36 | 123 | 1.037 | 31.619 | 0.049 | 28.5 | 29.6 | 30.6 | 31.6 | 32.6 | 33.7 | 34.7 |
| 37 | 259 | 1.037 | 32.125 | 0.046 | 29.2 | 30.2 | 31.1 | 32.1 | 33.1 | 34.1 | 35.0 |
| 38 | 340 | 1.037 | 32.592 | 0.044 | 29.7 | 30.7 | 31.6 | 32.6 | 33.5 | 34.5 | 35.4 |
| 39 | 244 | 1.037 | 32.982 | 0.043 | 30.1 | 31.1 | 32.0 | 33.0 | 33.9 | 34.9 | 35.8 |
| 40 | 98 | 1.037 | 33.288 | 0.042 | 30.5 | 31.4 | 32.3 | 33.3 | 34.2 | 35.2 | 36.1 |
| 41 | 20 | 1.037 | 33.558 | 0.042 | 30.7 | 31.7 | 32.6 | 33.6 | 34.5 | 35.4 | 36.4 |
The 3rd and 97th centiles should be interpreted with caution for gestational ages with small counts n<50 infants. GA= gestational age; L=Box-Cox power transformation of skewness; M= median; S=coefficient of variation.
TABLE III.
Birth weight (grams) and head circumference (cm) centiles by gestational age for males with trisomy 21
| GA, wk | N | L d.f.=2 | M d.f.=7 | S d.f=6 | 3rd | 10th | 25th | 50th | 75th | 90th | 97th |
|---|---|---|---|---|---|---|---|---|---|---|---|
| 22 | 34 | 0.540 | 515.757 | 0.158 | 365 | 412 | 463 | 516 | 571 | 630 | 690 |
| 23 | 24 | 0.547 | 601.664 | 0.177 | 406 | 468 | 533 | 602 | 674 | 751 | 831 |
| 24 | 22 | 0.553 | 689.366 | 0.195 | 444 | 520 | 602 | 689 | 782 | 879 | 982 |
| 25 | 32 | 0.560 | 773.875 | 0.213 | 476 | 568 | 668 | 774 | 887 | 1007 | 1133 |
| 26 | 33 | 0.567 | 865.393 | 0.230 | 507 | 617 | 737 | 865 | 1003 | 1149 | 1303 |
| 27 | 34 | 0.576 | 974.575 | 0.249 | 542 | 674 | 819 | 975 | 1142 | 1320 | 1510 |
| 28 | 34 | 0.586 | 1109.047 | 0.265 | 587 | 746 | 920 | 1109 | 1312 | 1529 | 1760 |
| 29 | 66 | 0.598 | 1269.892 | 0.277 | 649 | 837 | 1044 | 1270 | 1513 | 1772 | 2048 |
| 30 | 22 | 0.611 | 1445.190 | 0.281 | 726 | 945 | 1185 | 1445 | 1726 | 2025 | 2342 |
| 31 | 42 | 0.625 | 1632.512 | 0.276 | 829 | 1074 | 1342 | 1633 | 1943 | 2274 | 2624 |
| 32 | 72 | 0.640 | 1823.474 | 0.263 | 961 | 1227 | 1514 | 1823 | 2153 | 2501 | 2868 |
| 33 | 96 | 0.656 | 2009.868 | 0.243 | 1121 | 1397 | 1694 | 2010 | 2344 | 2695 | 3063 |
| 34 | 156 | 0.672 | 2224.292 | 0.220 | 1319 | 1603 | 1905 | 2224 | 2559 | 2908 | 3272 |
| 35 | 186 | 0.690 | 2461.701 | 0.199 | 1546 | 1837 | 2142 | 2462 | 2795 | 3141 | 3499 |
| 36 | 312 | 0.707 | 2686.246 | 0.181 | 1766 | 2060 | 2367 | 2686 | 3017 | 3358 | 3710 |
| 37 | 486 | 0.723 | 2908.133 | 0.170 | 1967 | 2269 | 2583 | 2908 | 3244 | 3589 | 3944 |
| 38 | 545 | 0.737 | 3091.851 | 0.161 | 2141 | 2448 | 2765 | 3092 | 3428 | 3773 | 4127 |
| 39 | 375 | 0.748 | 3232.164 | 0.153 | 2281 | 2589 | 2906 | 3232 | 3567 | 3910 | 4261 |
| 40 | 206 | 0.758 | 3339.743 | 0.146 | 2398 | 2704 | 3018 | 3340 | 3670 | 4007 | 4351 |
| 41 | 38 | 0.766 | 3435.619 | 0.140 | 2507 | 2809 | 3119 | 3436 | 3760 | 4090 | 4427 |
|
| |||||||||||
| GA, wk | N | L d.f.=1 | M d.f.=5 | S d.f=4 | 3rd | 10th | 25th | 50th | 75th | 90th | 97th |
|
| |||||||||||
| 24 | 10 | −0.103 | 21.717 | 0.059 | 19.3 | 20.1 | 20.9 | 21.7 | 22.6 | 23.5 | 24.4 |
| 25 | 15 | −0.103 | 22.610 | 0.064 | 19.9 | 20.8 | 21.7 | 22.6 | 23.6 | 24.6 | 25.7 |
| 26 | 15 | −0.103 | 23.539 | 0.069 | 20.5 | 21.5 | 22.5 | 23.5 | 24.6 | 25.8 | 27.0 |
| 27 | 29 | −0.103 | 24.519 | 0.072 | 21.2 | 22.3 | 23.4 | 24.5 | 25.7 | 27.0 | 28.4 |
| 28 | 22 | −0.103 | 25.514 | 0.074 | 22.0 | 23.1 | 24.3 | 25.5 | 26.8 | 28.2 | 29.6 |
| 29 | 52 | −0.103 | 26.500 | 0.074 | 22.9 | 24.0 | 25.2 | 26.5 | 27.8 | 29.2 | 30.7 |
| 30 | 13 | −0.103 | 27.443 | 0.072 | 23.8 | 24.9 | 26.2 | 27.4 | 28.8 | 30.2 | 31.7 |
| 31 | 32 | −0.103 | 28.337 | 0.069 | 24.7 | 25.9 | 27.1 | 28.3 | 29.7 | 31.1 | 32.6 |
| 32 | 42 | −0.103 | 29.181 | 0.065 | 25.7 | 26.8 | 27.9 | 29.2 | 30.5 | 31.8 | 33.2 |
| 33 | 64 | −0.103 | 29.952 | 0.060 | 26.6 | 27.6 | 28.8 | 30.0 | 31.2 | 32.5 | 33.8 |
| 34 | 99 | −0.103 | 30.690 | 0.056 | 27.4 | 28.5 | 29.6 | 30.7 | 31.9 | 33.1 | 34.4 |
| 35 | 132 | −0.103 | 31.377 | 0.052 | 28.3 | 29.3 | 30.3 | 31.4 | 32.5 | 33.6 | 34.8 |
| 36 | 215 | −0.103 | 31.944 | 0.049 | 29.0 | 29.9 | 30.9 | 31.9 | 33.0 | 34.1 | 35.2 |
| 37 | 356 | −0.103 | 32.429 | 0.046 | 29.6 | 30.5 | 31.5 | 32.4 | 33.4 | 34.5 | 35.6 |
| 38 | 368 | −0.103 | 32.871 | 0.043 | 30.2 | 31.0 | 31.9 | 32.9 | 33.8 | 34.8 | 35.8 |
| 39 | 236 | −0.103 | 33.223 | 0.041 | 30.6 | 31.5 | 32.3 | 33.2 | 34.1 | 35.1 | 36.1 |
| 40 | 124 | −0.103 | 33.513 | 0.039 | 31.0 | 31.8 | 32.7 | 33.5 | 34.4 | 35.3 | 36.3 |
| 41 | 26 | −0.103 | 33.790 | 0.038 | 31.4 | 32.1 | 33.0 | 33.8 | 34.6 | 35.5 | 36.4 |
The 3rd and 97th centiles should be interpreted with caution for gestational ages with small counts n<50 infants. GA= gestational age; L=Box-Cox power transformation of skewness; M= median; S=coefficient of variation.
Trisomy 18 infants included a total of 1088 infants (939 infants enrolled from expanded centers and from VLBW centers based on the GA definition of 22–29 weeks from 2005–2009 and 149 infants with GAs 22–29 weeks enrolled from VLBW centers prior to 2005). The final count included 1053 infants with T18 (87.1% admitted to US participating centers) after excluding infants with GAs 21 weeks (1 infant), 42–43 weeks (7 infants) and infants with improbable measurements (27 infants). No significant differences in the average birth weight by GA group were observed between male and female infants with T18 (Table I). Females constituted 61.1% of the sample. The distribution of race/ethnicity included 52.6% non-Hispanic white, 21.6% Hispanic, 16.9% black, and 9% other. Worth noting is the decrease in the frequency of male infants with the increase in GA. The LMS parameters and the centiles from the smoothed curves for infants with T18 are displayed in Table IV.
TABLE IV.
Birth weight (grams) centiles by gestational age for females and males with trisomy 18
| GA, wk | N
|
L d.f.=4 | M d.f.=6 | S d.f.=4 | Centile
|
||||||||
|---|---|---|---|---|---|---|---|---|---|---|---|---|---|
| Total | Females | Males | 3rd | 10th | 25th | 50th | 75th | 90th | 97th | ||||
| 22 | 16 | 8 (50.0) | 8 (50.0) | −1.021 | 423.928 | 0.192 | 307 | 338 | 376 | 424 | 486 | 570 | 689 |
| 23 | 18 | 9 (50.0) | 9 (50.0) | −0.818 | 482.722 | 0.197 | 343 | 381 | 426 | 483 | 554 | 648 | 776 |
| 24 | 27 | 13 (48.2) | 14 (51.8) | −0.613 | 542.252 | 0.202 | 378 | 423 | 477 | 542 | 624 | 727 | 861 |
| 25 | 22 | 16 (72.7) | 6 (27.3) | −0.397 | 606.494 | 0.207 | 414 | 467 | 530 | 606 | 699 | 812 | 952 |
| 26 | 32 | 14 (43.8) | 18 (56.2) | −0.162 | 681.143 | 0.212 | 452 | 517 | 592 | 681 | 786 | 909 | 1056 |
| 27 | 48 | 19 (39.6) | 29 (60.4) | 0.068 | 756.211 | 0.216 | 488 | 565 | 654 | 756 | 873 | 1006 | 1157 |
| 28 | 73* | 28 (38.9) | 44 (61.1) | 0.278 | 835.107 | 0.219 | 523 | 616 | 719 | 835 | 964 | 1106 | 1263 |
| 29 | 90 | 43 (47.8) | 47 (52.2) | 0.436 | 923.437 | 0.221 | 564 | 673 | 793 | 923 | 1065 | 1219 | 1384 |
| 30 | 22 | 14 (63.6) | 8 (36.4) | 0.493 | 1023.274 | 0.222 | 621 | 744 | 878 | 1023 | 1180 | 1348 | 1528 |
| 31 | 15 | 11 (73.3) | 4 (26.7) | 0.457 | 1130.754 | 0.219 | 693 | 826 | 972 | 1131 | 1303 | 1488 | 1686 |
| 32 | 33 | 18 (54.6) | 15 (45.4) | 0.379 | 1240.379 | 0.214 | 778 | 917 | 1071 | 1240 | 1425 | 1626 | 1843 |
| 33 | 30 | 20 (66.7) | 10 (33.3) | 0.307 | 1356.138 | 0.205 | 875 | 1019 | 1179 | 1356 | 1551 | 1764 | 1996 |
| 34 | 59 | 32 (54.2) | 27 (45.8) | 0.267 | 1482.136 | 0.195 | 983 | 1133 | 1299 | 1482 | 1684 | 1905 | 2146 |
| 35 | 56 | 41 (73.2) | 15 (26.8) | 0.246 | 1613.435 | 0.184 | 1098 | 1254 | 1425 | 1613 | 1820 | 2046 | 2293 |
| 36 | 84* | 57 (68.7) | 26 (31.3) | 0.233 | 1738.695 | 0.173 | 1211 | 1371 | 1547 | 1739 | 1949 | 2178 | 2427 |
| 37 | 105 | 68 (64.8) | 37 (35.2) | 0.232 | 1861.798 | 0.164 | 1322 | 1487 | 1666 | 1862 | 2075 | 2306 | 2556 |
| 38 | 130 | 82 (63.1) | 48 (36.9) | 0.265 | 1983.148 | 0.156 | 1431 | 1600 | 1784 | 1983 | 2198 | 2429 | 2678 |
| 39 | 98 | 76 (77.6) | 22 (22.4) | 0.328 | 2106.250 | 0.149 | 1539 | 1715 | 1904 | 2106 | 2323 | 2554 | 2799 |
| 40 | 58 | 41 (70.7) | 17 (29.3) | 0.371 | 2247.242 | 0.144 | 1659 | 1843 | 2039 | 2247 | 2469 | 2704 | 2952 |
| 41 | 37 | 32 (86.5) | 5 (13.5) | 0.376 | 2407.729 | 0.139 | 1794 | 1986 | 2191 | 2408 | 2638 | 2881 | 3138 |
Data missing on sex: 2 infants. The 3rd and 97th centiles should be interpreted with caution for gestational ages with small counts <50 infants. GA= gestational age; L=Box-Cox power transformation of skewness; M= median; S=coefficient of variation.
Among infants with trisomy 13, a total of 629 infants were enrolled (52 infants were enrolled from VLBW centers based on the GA of 22–28 weeks prior to 2005 and 577 infants were enrolled from VLBW centers between 2005 and 2009 according to the GA eligibility criteria of 22–29 weeks or from expanded centers). The final count included 613 infants (87.3% admitted to US centers) after excluding infants with GAs 41–42 weeks (10 infants) and infants with improbable measurements (6 infants). Females constituted 48.5% of the sample. Similar to infants with T18, no significant differences were observed when comparing the average birth weight by GA group between male and female infants with T13 (Table I). The race/ethnicity distribution among infants with T13 included 52.3% non-Hispanic white, 20.1% black, 20.8% Hispanic, and 6.8% other. The LMS parameters and the centiles from the smoothed curves for infants with T13 are displayed in Table V while the birth weight for GA curves for infants with T18 or T13 are presented in Figures 3A & 3B.
TABLE V.
Birth weight (grams) centiles by gestational age for females and males with trisomy 13
| GA, wk | N
|
L d.f.=3 | M d.f.=5 | S d.f.=4 | Centile
|
||||||||
|---|---|---|---|---|---|---|---|---|---|---|---|---|---|
| Total | Females | Males | 3rd | 10th | 25th | 50th | 75th | 90th | 97th | ||||
| 22 | 16 | 8 (50.0) | 8 (50.0) | 0.127 | 473.882 | 0.224 | 299 | 350 | 408 | 474 | 549 | 635 | 732 |
| 23 | 17 | 10 (58.8) | 7 (41.2) | 0.146 | 539.160 | 0.225 | 338 | 397 | 463 | 539 | 626 | 723 | 834 |
| 24 | 9 | 6 (66.7) | 3 (33.3) | 0.167 | 608.244 | 0.227 | 379 | 446 | 522 | 608 | 706 | 817 | 943 |
| 25 | 14 | 7 (50.0) | 7 (50.0) | 0.188 | 681.285 | 0.229 | 422 | 498 | 584 | 681 | 792 | 916 | 1057 |
| 26 | 16 | 12 (75.0) | 4 (25.0) | 0.213 | 767.656 | 0.230 | 473 | 559 | 657 | 768 | 893 | 1033 | 1190 |
| 27 | 21 | 9 (42.9) | 12 (57.1) | 0.241 | 868.431 | 0.230 | 534 | 632 | 743 | 868 | 1009 | 1167 | 1342 |
| 28 | 31 | 13 (41.9) | 18 (58.1) | 0.267 | 979.014 | 0.227 | 603 | 714 | 839 | 979 | 1136 | 1310 | 1504 |
| 29 | 27 | 12 (44.4) | 15 (55.6) | 0.280 | 1099.385 | 0.223 | 683 | 806 | 945 | 1099 | 1272 | 1463 | 1673 |
| 30 | 14 | 11 (78.6) | 3 (21.4) | 0.275 | 1229.830 | 0.217 | 775 | 910 | 1061 | 1230 | 1417 | 1625 | 1853 |
| 31 | 14 | 6 (42.9) | 8 (57.1) | 0.250 | 1376.212 | 0.210 | 882 | 1029 | 1193 | 1376 | 1580 | 1805 | 2053 |
| 32 | 22 | 13 (59.1) | 9 (40.9) | 0.203 | 1543.296 | 0.204 | 1008 | 1166 | 1344 | 1543 | 1765 | 2012 | 2285 |
| 33 | 22 | 14 (63.6) | 8 (36.4) | 0.144 | 1739.538 | 0.200 | 1153 | 1326 | 1521 | 1740 | 1985 | 2259 | 2565 |
| 34 | 37* | 16 (44.4) | 20 (55.6) | 0.092 | 1954.278 | 0.198 | 1305 | 1496 | 1711 | 1954 | 2228 | 2537 | 2883 |
| 35 | 51 | 19 (37.2) | 32 (62.8) | 0.074 | 2154.260 | 0.198 | 1441 | 1650 | 1887 | 2154 | 2457 | 2798 | 3182 |
| 36 | 62 | 29 (46.8) | 33 (53.2) | 0.098 | 2337.722 | 0.197 | 1563 | 1791 | 2048 | 2338 | 2664 | 3031 | 3443 |
| 37 | 76 | 31 (40.8) | 45 (59.2) | 0.147 | 2521.005 | 0.195 | 1685 | 1933 | 2210 | 2521 | 2868 | 3256 | 3687 |
| 38 | 73 | 33 (45.2) | 40 (54.8) | 0.204 | 2702.094 | 0.191 | 1815 | 2080 | 2375 | 2702 | 3064 | 3464 | 3905 |
| 39 | 65 | 31 (47.7) | 34 (52.3) | 0.262 | 2874.113 | 0.186 | 1942 | 2223 | 2533 | 2874 | 3248 | 3656 | 4101 |
| 40 | 26 | 17 (65.4) | 9 (34.6) | 0.320 | 3041.180 | 0.183 | 2060 | 2358 | 2685 | 3041 | 3428 | 3847 | 4300 |
Data missing on sex: 1 infant. The 3rd and 97th centiles should be interpreted with caution for gestational ages with small counts n<50 infants. GA= gestational age; L=Box-Cox power transformation of skewness; M= median; S=coefficient of variation.
FIGURE 3.
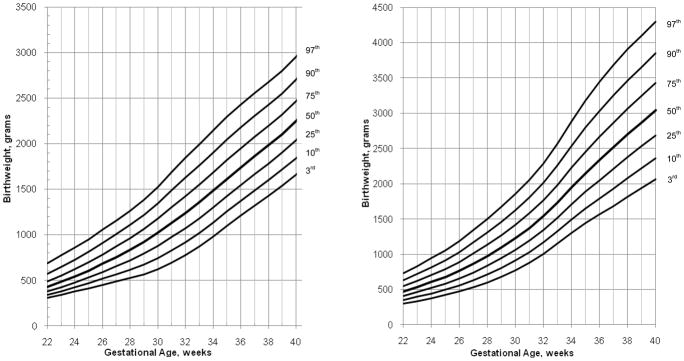
3rd, 10th, 25th, 50th, 75th, 90th and 97th centiles of birth weight for gestational age for (A) infants with trisomy 18 (B) infants with trisomy 13
A comparison of birth weight for age among male infants with T21, male and female infants with T18 or T13 is also presented in Figure 4 and shows that infants with T18 are the most likely to be growth restricted in contrast to male infants with T21 who are the least likely to be growth restricted. The 90th centile of weight for age for infants with T18 for example was below the 50th centile of weight for age for male infants with T21 at the majority of the GAs.
FIGURE 4.
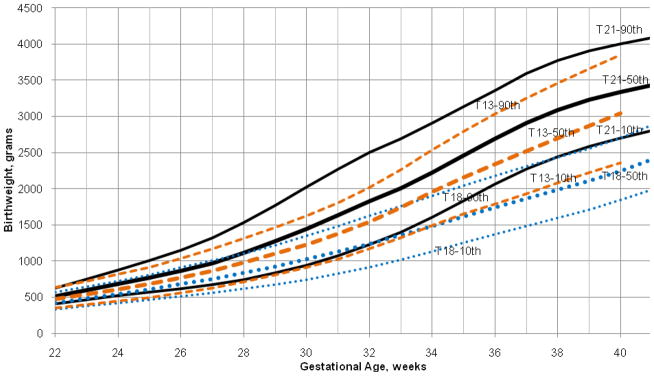
A comparison of the 10th, 50th, and 90th centiles of birth weight for gestational age for male infants with trisomy 21 (solid lines), infants with trisomy 18 (round dotted lines) and infants with trisomy 13 (square dotted lines) [Color figure can be viewed in the online issue, which is available at www.interscience.wiley.com.]
Comparing the current VON sex-specific weight for gestation charts for infants with T21 to the frequently used reference charts in the nurseries, including the Fenton curves which were based on the Canadian study by Kramer et al. and the Lubchenco curves [Fenton, 2003; Kramer et al., 2001; Lubchenco et al., 1963] (Figure 5), shows that both curves overestimate the rate of SGA male and female infants with T21 from week 26 through week 34. The differences between the VON curves and the Fenton curves are more pronounced and the SGA misclassification proceeds through week 41 among both male and female infants with T21. Among females, at weeks 39–41 however, the Lubchenco curve underestimates the percentage of SGA infants with T21. Examining the 90th centile, in comparison to the Lubchenco curve, at earlier GAs (≤28 weeks) the percentage of LGA infants is underestimated while it is overestimated at older ages (≥37 weeks). In comparison to the Fenton curves, the differences in the 90th centile are less pronounced among females while among males LGA is overestimated at 28–34 weeks and underestimated at ≥37 weeks. In summary, compared to the currently used reference charts, misclassification of weight for GA among infants with T21 occurs frequently.
FIGURE 5.

Birth weight for gestational age sex-specific curves for the 10th, 50th, & 90th centiles comparing (A) females with trisomy 21, solid lines (B) males with trisomy 21, solid lines; with sex-specific centiles with the square dotted lines representing Lubchenco et al. [1963] centiles and the round dotted lines representing Kramer et al. [2001] centiles. Lubchenco et al. [1963] centiles prior to 24 weeks gestation are not available.
[Color figure can be viewed in the online issue, which is available at www.interscience.wiley.com.]
The VON sex-specific head circumference centiles for GA for infants with T21 were also compared with the Lubchenco curves [Lubchenco et al., 1966] in Figure 6 and show that the birth head circumference of male and female infants with T21 is lower than the 10th, 50th and 90th centiles in comparison to the general population.
FIGURE 6.

Head circumference for gestational age sex-specific curves for the 10th, 50th, & 90th centiles comparing females with trisomy 21, dashed lines and males with trisomy 21, solid lines; with Lubchenco et al. [1966] combined-sex curves, square dotted lines. Lubchenco et al. [1966] sex-specific centiles and centiles prior to 24 weeks gestation are not available.
[Color figure can be viewed in the online issue, which is available at www.interscience.wiley.com.]
DISCUSSION
Charts of birth weight for GA are presented for singleton infants with trisomies 21, 18 or 13 and of head circumference for age for infants with T21 only. To our knowledge, this is the first time graphic representations of birth weight for infants with these autosomal trisomies have been presented with such a range of GAs. Among the three groups of examined trisomies, infants with T18 were the most likely to be small for GA and infants with T21 were the least likely to be small for GA. Others have shown that growth restriction among fetuses with T18 or T13 starts as early as the first trimester [Bahado-Singh et al., 1997; Lynch et al., 1989; Schemmer et al., 1997]. This however, is not supported among fetuses with T21 who usually demonstrate normal first-trimester growth [Bahado-Singh et al., 1997; Schemmer et al., 1997]. Similar to previous findings examining birth size by sex, we also found differences in the mean birth weights between male and female infants with T21 [Thomas et al., 2000].
The birth weight for GA charts should prove to be particularly useful for infants with T21 as these infants are the most likely to survive in comparison to infants with the other autosomal trisomies, and awareness of unusual birth weights can assist in medical management and guide nutrition care decisions. Previous longitudinal postnatal growth charts have been published for children with Down syndrome demonstrating their deficient growth rate which is most pronounced in infancy and later at adolescence [Cronk, 1978; Cronk et al., 1988]. While several studies have examined their postnatal growth, a search of the literature shows only one study conducted in Italy that examined weight, length, and head circumference for GA among 688 live-born and stillborn infants with Down syndrome from the 34th to the 42nd gestational week and demonstrated lower centiles in weight, length and head circumference than the centiles among controls [Clementi et al., 1990]. Earlier studies based on smaller numbers of fetuses and newborns with T21 have shown minimal or no evidence of deficient growth in comparison to normal fetuses and normal newborns [Barden, 1983; Kucera et al., 1972; Pueschel et al., 1976]. In light of the increased life expectancy of individuals with Down syndrome, a better assessment of their birth weight for GA should be available to enable their care providers to better classify them as small, appropriate or large for their GA and to identify infants at increased risk for mortality and medical morbidities [Battaglia et al., 1967; Hediger et al., 1998; Lubchenco et al., 1972a; Lubchenco et al., 1972b].At present, care providers use the same charts for these infants as the charts generated using infants from the general population that often exclude infants with malformations. As shown in the results however, the currently used charts do not reflect an accurate classification of these infants. Infants with T21 misclassified as SGA might lead to an unnecessarily prolonged hospital stay while those misclassified as AGA might not be receiving the necessary attention.
As expected, as microcephaly is a feature commonly associated with T21 [Ashwal et al., 2009], birth head circumference was lower than the 10th, 50th and 90th centiles for both male and female infants with T21 in comparison to the general population. This was also reported in the Italian study on live-born and stillborn infants with Down syndrome. At 38 weeks gestation for example, the 50th centile of male head circumference in the Italian study was around 33 cm (reported value based on examining the curve) [Clementi et al., 1990] similar to our current value of 32.9 cm.
Serial ultrasound assessments represent the gold standard for examining fetal growth as compared to cross-sectional data at birth; however, for preterm infants, this is problematic. Evidence suggests that at birth, preterm infants are smaller in size than infants retained in utero at the same GA [Doubilet et al., 2003; Secher et al., 1987]. In the absence of future serial ultrasound assessments and adequate numbers of infants with the currently examined trisomies, the VON charts present a good reference to assess infant size at birth.
Limitations of the current study include lack of data on birth length for age. Additionally, the inclusion of infants in the lower GA categories from VLBW centers prior to 2005 based on the eligibility criteria of 401–1500 grams for years 1996–2004 (and 501–1500 grams for years 1994–1995), might have shifted the distribution of birth weight upwards as some infants in the extremely preterm GA categories might have birth weights less than 401 grams; the number of these infants however, is likely to be very small. The VON cohort also included only infants who were admitted to the NICU or who died at any site in the hospital before being admitted to the NICU. Although, we are less likely to exclude infants with T18 or T13, we might however, be missing the healthier infants with T21 who had no associated malformations and were at older GAs. This is noted by the decreasing number of infants at 38, 39 and 40 weeks gestation when we would expect an increase in the sample size. The size of the VON term infants however, is similar to that reported in the Italian study. At 38 weeks among male infants with Down syndrome for example, the Italian study reported a 50th centile of 3000 grams (reported value based on examining the curve) [Clementi et al., 1990] close to the currently reported value of 3092 grams. Worth noting is that the mean GA among infants with T21 was reported to be significantly shorter by around 1 week than among infants in the general population [Frid et al., 2004; Weijerman et al., 2008]. The current sample nonetheless, represents NICU admissions to hospitals serving populations from a wide array of geographic locations and a large series of infants across a range of GAs.
The current charts provide care providers with a better classification tool for infants with T21. Future studies should attempt to validate the VON charts and extend our findings with serial postnatal growth data on infants with trisomies.
Acknowledgments
We thank the team members at participating hospitals for their dedication to improving the quality and safety of medical care for newborn infants and their families and for their voluntary participation in the Vermont Oxford Network Database that made this research possible.
ABBREVIATIONS
- AGA
appropriate for gestational age
- ANOVA
analysis of variance
- GA
gestational age
- LGA
large for gestational age
- NICU
Neonatal Intensive Care Unit
- SGA
small for gestational age
- T13
trisomy 13
- T18
trisomy 18
- T21
trisomy 21
- VLBW
very low birth weight
- VON
Vermont Oxford Network
Footnotes
CONFLICT OF INTEREST: Dr. Horbar is the Chief Executive and Scientific Officer of the Vermont Oxford Network. Mr. Carpenter is the Director of Operations and Statistics at the Vermont Oxford Network. Both receive salary from the Vermont Oxford Network. None of the authors have disclosures to report.
References
- Ashwal S, Michelson D, Plawner L, Dobyns WB Quality Standards Subcommittee of the American Academy of Neurology and the Practice Committee of the Child Neurology Society. Practice parameter: Evaluation of the child with microcephaly (an evidence-based review): Report of the quality standards subcommittee of the American academy of neurology and the practice committee of the child neurology society. Neurology. 2009;73:887–897. doi: 10.1212/WNL.0b013e3181b783f7. [DOI] [PMC free article] [PubMed] [Google Scholar]
- Bahado-Singh RO, Lynch L, Deren O, Morroti R, Copel JA, Mahoney MJ, Williams J., 3rd First-trimester growth restriction and fetal aneuploidy: The effect of type of aneuploidy and gestational age. Am J Obstet Gynecol. 1997;176:976–980. doi: 10.1016/s0002-9378(97)70388-0. [DOI] [PubMed] [Google Scholar]
- Barden HS. Growth and development of selected hard tissues in Down syndrome: A review. Hum Biol. 1983;55:539–576. [PubMed] [Google Scholar]
- Battaglia FC, Lubchenco LO. A practical classification of newborn infants by weight and gestational age. J Pediatr. 1967;71:159–163. doi: 10.1016/s0022-3476(67)80066-0. [DOI] [PubMed] [Google Scholar]
- Clementi M, Calzolari E, Turolla L, Volpato S, Tenconi R. Neonatal growth patterns in a population of consecutively born Down syndrome children. Am J Med Genet Suppl. 1990;7:71–74. doi: 10.1002/ajmg.1320370713. [DOI] [PubMed] [Google Scholar]
- Cole TJ, Green PJ. Smoothing reference centile curves: The LMS method and penalized likelihood. Stat Med. 1992;11:1305–1319. doi: 10.1002/sim.4780111005. [DOI] [PubMed] [Google Scholar]
- Cronk C, Crocker AC, Pueschel SM, Shea AM, Zackai E, Pickens G, Reed RB. Growth charts for children with Down syndrome: 1 month to 18 years of age. Pediatrics. 1988;81:102–110. [PubMed] [Google Scholar]
- Cronk CE. Growth of children with Down’s syndrome: Birth to age 3 years. Pediatrics. 1978;61:564–568. [PubMed] [Google Scholar]
- Doubilet PM, Benson CB, Wilkins-Haug L, Ringer S. Fetuses subsequently born premature are smaller than gestational age-matched fetuses not born premature. J Ultrasound Med. 2003;22:359–363. doi: 10.7863/jum.2003.22.4.359. [DOI] [PubMed] [Google Scholar]
- Fenton TR. A new growth chart for preterm babies: Babson and Benda’s chart updated with recent data and a new format. BMC Pediatr. 2003;3:13. doi: 10.1186/1471-2431-3-13. [DOI] [PMC free article] [PubMed] [Google Scholar]
- Frid C, Drott P, Otterblad Olausson P, Sundelin C, Anneren G. Maternal and neonatal factors and mortality in children with Down syndrome born in 1973–1980 and 1995–1998. Acta Paediatr. 2004;93:106–112. doi: 10.1080/08035250310007303. [DOI] [PubMed] [Google Scholar]
- Hediger ML, Overpeck MD, Maurer KR, Kuczmarski RJ, McGlynn A, Davis WW. Growth of infants and young children born small or large for gestational age: Findings from the third national health and nutrition examination survey. Arch Pediatr Adolesc Med. 1998;152:1225–1231. doi: 10.1001/archpedi.152.12.1225. [DOI] [PubMed] [Google Scholar]
- Kramer MS, Platt RW, Wen SW, Joseph KS, Allen A, Abrahamowicz M, Blondel B, Breart G Fetal/Infant Health Study Group of the Canadian Perinatal Surveillance System. A new and improved population-based Canadian reference for birth weight for gestational age. Pediatrics. 2001;108:E35. doi: 10.1542/peds.108.2.e35. [DOI] [PubMed] [Google Scholar]
- Kucera J, Dolezalova V. Prenatal development of malformed fetuses at 28–42 weeks of gestational age. (anencephalus, hydrocephalus, down’s syndrome, cleft lip and palate, and hypospadias). I. Weight gains. Biol Neonate. 1972;20:253–261. doi: 10.1159/000240469. [DOI] [PubMed] [Google Scholar]
- Lubchenco LO, Delivoria-Papadopoulos M, Searls D. Long-term follow-up studies of prematurely born infants. II. Influence of birth weight and gestational age on sequelae. J Pediatr. 1972a;80:509–512. doi: 10.1016/s0022-3476(72)80518-3. [DOI] [PubMed] [Google Scholar]
- Lubchenco LO, Hansman C, Boyd E. Intrauterine growth in length and head circumference as estimated from live births at gestational ages from 26 to 42 weeks. Pediatrics. 1966;37:403–408. [PubMed] [Google Scholar]
- Lubchenco LO, Hansman C, Dressler M, Boyd E. Intrauterine growth as estimated from liveborn birth-weight data at 24 to 42 weeks of gestation. Pediatrics. 1963;32:793–800. [PubMed] [Google Scholar]
- Lubchenco LO, Searls DT, Brazie JV. Neonatal mortality rate: Relationship to birth weight and gestational age. J Pediatr. 1972b;81:814–822. doi: 10.1016/s0022-3476(72)80114-8. [DOI] [PubMed] [Google Scholar]
- Lynch L, Berkowitz RL. First trimester growth delay in trisomy 18. Am J Perinatol. 1989;6:237–239. doi: 10.1055/s-2007-999584. [DOI] [PubMed] [Google Scholar]
- Myrelid A, Gustafsson J, Ollars B, Anneren G. Growth charts for Down’s syndrome from birth to 18 years of age. Arch Dis Child. 2002;87:97–103. doi: 10.1136/adc.87.2.97. [DOI] [PMC free article] [PubMed] [Google Scholar]
- Palmer CG, Cronk C, Pueschel SM, Wisniewski KE, Laxova R, Crocker AC, Pauli RM. Head circumference of children with Down syndrome (0–36 months) Am J Med Genet. 1992;42:61–67. doi: 10.1002/ajmg.1320420114. [DOI] [PubMed] [Google Scholar]
- Parker SE, Mai CT, Canfield MA, Rickard R, Wang Y, Meyer RE, Anderson P, Mason CA, Collins JS, Kirby RS, Correa A National Birth Defects Prevention Network. Updated national birth prevalence estimates for selected birth defects in the United States, 2004–2006. Birth Defects Res A Clin Mol Teratol. 2010;88:1008–1016. doi: 10.1002/bdra.20735. [DOI] [PubMed] [Google Scholar]
- Piro E, Pennino C, Cammarata M, Corsello G, Grenci A, Lo Giudice C, Morabito M, Piccione M, Giuffre L. Growth charts of Down syndrome in Sicily: Evaluation of 382 children 0–14 years of age. Am J Med Genet Suppl. 1990;7:66–70. doi: 10.1002/ajmg.1320370712. [DOI] [PubMed] [Google Scholar]
- Pueschel SM, Rothman KJ, Ogilby JD. Birth weight of children with Down’s syndrome. Am J Ment Defic. 1976;80:442–445. [PubMed] [Google Scholar]
- Schemmer G, Wapner RJ, Johnson A, Schemmer M, Norton HJ, Anderson WE. First-trimester growth patterns of aneuploid fetuses. Prenat Diagn. 1997;17:155–159. [PubMed] [Google Scholar]
- Secher NJ, Kern Hansen P, Thomsen BL, Keiding N. Growth retardation in preterm infants. Br J Obstet Gynaecol. 1987;94:115–120. doi: 10.1111/j.1471-0528.1987.tb02336.x. [DOI] [PubMed] [Google Scholar]
- Thomas P, Peabody J, Turnier V, Clark RH. A new look at intrauterine growth and the impact of race, altitude, and gender. Pediatrics. 2000;106:E21. doi: 10.1542/peds.106.2.e21. [DOI] [PubMed] [Google Scholar]
- Tukey JW. Exploratory Data Analysis. Don Mills, Ontario, Canada: Addison-Wesley; 1977. [Google Scholar]
- van Buuren S, Fredriks M. Worm plot: A simple diagnostic device for modeling growth reference curves. Stat Med. 2001;20:1259–1277. doi: 10.1002/sim.746. [DOI] [PubMed] [Google Scholar]
- Vermont Oxford Network (VON) Database Manual of Operations: Release 14. Burlington: Vermont Oxford Network; 2010. [Google Scholar]
- Weijerman ME, van Furth AM, Vonk Noordegraaf A, van Wouwe JP, Broers CJ, Gemke RJ. Prevalence, neonatal characteristics, and first-year mortality of Down syndrome: A national study. J Pediatr. 2008;152:15–19. doi: 10.1016/j.jpeds.2007.09.045. [DOI] [PubMed] [Google Scholar]