

Abstract
AIM: To evaluate the significance of computed tomography (CT) findings in relation to liver chemistry and the clinical course of acute hepatitis.
METHODS: Four hundred and twelve patients with acute hepatitis who underwent enhanced CT scanning were enrolled retrospectively. Imaging findings were analyzed for the following variables: gallbladder wall thickness (GWT), arterial heterogeneity, periportal tracking, number and maximum size of lymph nodes, presence of ascites, and size of spleen. The serum levels of alanine aminotransferase, alkaline phosphatase, bilirubin, albumin, and prothrombin time were measured on the day of admission and CT scan, and laboratory data were evaluated every 2-4 d for all subjects during hospitalization.
RESULTS: The mean age of patients was 34.4 years, and the most common cause of hepatitis was hepatitis A virus (77.4%). The mean GWT was 5.2 mm. The number of patients who had findings of arterial heterogeneity, periportal tracking, lymph node enlargement > 7 mm, and ascites was 294 (80.1%), 348 (84.7%), 346 (84.5%), and 56 (13.6%), respectively. On multivariate logistic regression, male gender [odds ratio (OR) = 2.569, 95%CI: 1.477-4.469, P = 0.001], toxic hepatitis (OR = 3.531, 95%CI: 1.444-8.635, P = 0.006), level of albumin (OR = 2.154, 95%CI: 1.279-3.629, P = 0.004), and GWT (OR = 1.061, 95%CI: 1.015-1.110, P = 0.009) were independent predictive factors for severe hepatitis. The level of bilirubin (OR = 1.628, 95%CI: 1.331-1.991, P < 0.001) and GWT (OR = 1.172, 95%CI: 1.024-1.342, P = 0.021) were independent factors for prolonged cholestasis in multivariate analysis.
CONCLUSION: In patients with acute hepatitis, GWT on CT scan was an independent predictor of severe hepatitis and prolonged cholestasis.
Keywords: Acute hepatitis, Cholestasis, Computed tomography, Prognosis, Gallbladder
Core tip: Previous studies on the correlation between imaging and laboratory findings in acute hepatitis have shown conflicting results. This study revealed a correlation between abdominal computed tomography findings and liver biochemical parameters. In particular, gallbladder wall thickness (GWT) was the only independent imaging finding that predicts severe hepatitis and prolonged cholestasis. The results of this study suggest that GWT measurement, which is a relatively easy and objective procedure, is helpful to predict severe acute hepatitis or prolonged cholestasis.
INTRODUCTION
The principal causes of acute hepatitis include viral infection, use of certain drugs, heavy alcohol consumption, chemicals and autoimmunity. In laboratory testing, an increase in serum aminotransferase provides a basis for diagnosis; however, other tests may be conducted to determine the cause of disease and assess severity and prognosis. Abdominal ultrasonography and computed tomography (CT) may help to exclude other conditions that resemble acute hepatitis, such as biliary obstruction, cirrhosis, malignant metastasis to the liver, and diseases that alter liver biochemistry[1].
The general findings of abdominal ultrasonography in acute hepatitis include hepatomegaly, increased periportal echogenicity, decreased echogenicity in liver parenchyma and thickening of the gallbladder wall[2]. Computed tomography may also reveal lymphadenopathy around the hepatoduodenal ligament, fatty deposits around the liver, gallbladder changes, periportal tracking, hepatomegaly, splenomegaly and fluid retention within the pelvis in patients with acute hepatitis A[3].
The purpose of this study was to evaluate the significance of CT findings in relation to liver chemistry and the clinical course in patients with acute hepatitis.
MATERIALS AND METHODS
Patients
We conducted this study through a retrospective review of the medical records of 435 patients who had been hospitalized with acute hepatitis and examined with CT from January 2006 to May 2010. Patients who had previous chronic diseases, such as congestive heart failure, pulmonary diseases, chronic renal insufficiency, or uncontrolled diabetes mellitus, were not included. Twenty-three patients were also excluded because of a lack of relevant clinical chemistry findings or CT imaging obtained without contrast medium. The patients were treated with general symptomatic care with proper hydration and hepatotonic. The clinical and CT data of the 412 eligible patients were analyzed for this study. The cause of acute hepatitis was determined through obtaining a thorough medical history of alcohol consumption, drug use, and coexisting diseases, performing various serological and polymerase chain reaction (PCR) assays to diagnose a variety of viral, bacterial and protozoal infections of the liver caused by hepatitis viruses, cytomegalovirus, Epstein-Barr virus, human immunodeficiency virus, Toxoplasma, Leptospira, Candida, Mycobacteria, Brucella, pneumocystis, and if necessary, special biochemical tests for metabolic or hereditary hepatic diseases, including serum ceruloplasmin and 24-h urine copper quantification for Wilson’s disease. The institutional review board approved this study and waived the written informed consent requirement.
Laboratory examinations
The serum levels of alanine aminotransferase (ALT), alkaline phosphatase (ALP), bilirubin, albumin and prothrombin time (PT) were determined with a conventional autoanalyzer using commercial reagents on the day of admission and CT scan. These same examinations were repeated every 2-4 d for all subjects during hospitalization.
Diagnosis and definitions
The diagnosis of viral hepatitis was based on the positivity of hepatitis A virus, hepatitis B virus, or hepatitis C virus (HCV) markers. The laboratory criteria for confirming each type of acute hepatitis were as follows: acute hepatitis A, positive immunoglobulin M (IgM) antibody to hepatitis A virus; and acute hepatitis B, positive IgM antibody to hepatitis B core antigen and positive hepatitis B surface antigen with seroconversion at least 6 mo after initial presentation. Acute hepatitis C was considered to be present if the following criteria were met: an elevated serum ALT level with a documented normal level during the year before admission, no previous medical history of chronic hepatitis C, positive HCV RNA by PCR with known or suspected exposure to HCV within the preceding four months, and seroconversion of anti-HCV antibody[4,5]. Autoimmune hepatitis was diagnosed based on the recommendations of the International Autoimmune Hepatitis Group[6]. Toxic hepatitis (drug-induced liver injury) was confirmed in patients who had taken relevant various causative medications, herbs, or other xenobiotics within two months before admission and the aforementioned viral markers were all negative.
To identify a relationship between the severity of acute hepatitis and CT findings, we divided patients into two groups, one with and one without severe hepatitis (defined as serum bilirubin ≥ 10 mg/dL or PT ≤ 40% despite the administration of vitamin K in the most severe phase)[7,8]. To determine the factors associated with prolonged cholestasis, we arbitrarily divided patients into those with serum bilirubin ≥ 10 mg/dL for longer than 14 d and those having lower bilirubin levels or higher levels for less than 14 d.
Imaging
All examinations were performed with a 64-channel CT scanner (Brilliance 64, Phillips Medical Systems, Cleveland, OH, United States). The scanning parameters used were as follows: tube voltage, 120 kV; effective tube current, 200 mAs with dose modulation (D-Dom, Phillips Medical System); rotation time, 0.5 s; and collimation, 64 mm × 0.625 mm. In all patients, the abdominal CT was conducted with contrast enhancement. The delay between contrast medium administration and the commencement of scanning was determined individually for each patient using standard bolus-tracking software (Automatic Bolus Tracking, Phillips Medical Systems). Scanning began 7 s after a threshold attenuation of 300 HU was reached in the suprarenal aorta. For each patient, 100 mL of iomeprol (400 mg iodine per mL, Iomeron 400; Bracco, Milan, Italy) was injected into an antecubital vein. Contrast medium was injected monophasically at a rate of 3 mL/s. The portal venous and delayed phases started 75 and 120 s later, respectively.
Abdominal CT analysis
Two radiologists (Park BJ and Kim MJ, each with 10 years of experience in abdominal imaging) interpreted the CT images and reached an opinion by consensus. Both radiologists were blinded to the patient’s condition and blood test results. Six features of the CT image were interpreted (Figure 1): (1) gallbladder wall thickness (GWT) where the gallbladder is vertical to the surface of the liver in the part adjacent to the liver; (2) non-homogeneity of liver parenchyma in the arterial phase (arterial heterogeneity); (3) decreased attenuation along the portal vein, which is usually expressed as periportal tracking; (4) the maximum size and number of lymph nodes around the liver; (5) presence of ascites; and (6) size of the spleen.
Figure 1.
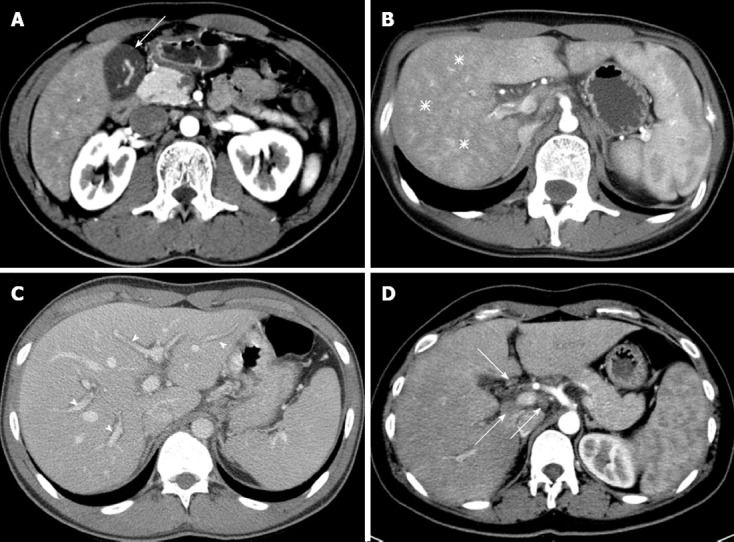
Typical multi-channel computed tomography findings in patients with acute hepatitis. A: Gallbladder wall thickening (arrow); B: Arterial heterogeneity (asterisks), diffuse heterogeneous attenuation of liver parenchyma in the arterial phase; C: Periportal tracking (arrowheads), decreased attenuation, which highlights the portal vein; D: Lymphadenopathy (arrows) in portal hepatis. Other usual findings, e.g., ascites and splenomegaly, are not shown in this figure.
Statistical analysis
The results were presented as the mean ± SD or number of patients (%) as appropriate. The Mann-Whitney U test was used to compare groups of continuous data. Categorical data were evaluated using Fisher’s exact test or the χ2 test. Correlations between two continuous variables were assessed using linear regression analysis with the Spearman correlation coefficient. Multivariate analysis was conducted on variables with P < 0.1 in univariate analysis using logistic regression analysis to identify factors related to the severity of acute hepatitis or prolonged cholestasis. P values less than 0.05 were considered statistically significant. SPSS version 12.0 for Windows (SPSS Inc., Chicago, IL, United States) was used for statistical analysis.
RESULTS
Baseline characteristics of the patients
The mean age (± SD) of 412 patients at the time of diagnosis was 34.4 (± 11.4) years (range, 11-92 years), and 237 (57.5%) were male. The most common cause of acute hepatitis was hepatitis A virus (n = 319, 77.4%). The other causes in order of frequency were toxicity, indeterminate, hepatitis B virus, alcoholism, HCV, and autoimmunity. Contrast-enhanced abdominal CT was performed at 1.5 d, on average, after admission (the second hospitalization day). The mean GWT on CT was 5.2 (± 5.5) mm, and 233 patients (56.5%) showed thickening of over 3 mm. The numbers of patients who showed arterial heterogeneity, periportal tracking, enlarged lymph nodes greater than 7 mm, and presence of ascites were 294 (80.1%), 348 (84.7%), 346 (84.5%), and 56 (13.6%), respectively. Spleen enlargement by greater than 12 cm was found in 95 patients (23.1%) (Table 1).
Table 1.
Baseline characteristics of the patients n (%)
| Characteristics | Total (n = 412) | Severe hepatitis (n = 92) | Non-severe hepatitis (n = 320) | P value | Prolonged cholestasis(n = 21) | Non-prolonged cholestasis (n = 391) | P value |
| Age1 (yr) | 34.4 ± 11.4 | 36.5 ± 11.5 | 33.8 ± 11.4 | 0.035 | 42.6 ± 15.0 | 34.0 ± 11.1 | 0.013 |
| Gender, male | 237 (57.5) | 62 (67.4) | 175 (54.7) | 0.032 | 11 (52.4) | 226 (57.8) | 0.655 |
| Etiology | |||||||
| Hepatitis A | 319 (77.4) | 67 (72.8) | 252 (78.8) | 8 (38.1) | 311 (79.5) | ||
| Toxic | 44 (10.7) | 17 (18.5) | 27 (8.4) | 10 (47.6) | 34 (8.7) | ||
| Unknown | 25 (6.1) | 1 (1.1) | 24 (7.5) | 0 (0) | 25 (6.4) | ||
| Hepatitis B | 16 (3.9) | 4 (4.3) | 12 (3.8) | 2 (9.5) | 14 (3.6) | ||
| Alcohol | 4 (1.0) | 1 (1.1) | 3 (0.9) | 0 (0) | 4 (1.0) | ||
| Hepatitis C | 2 (0.5) | 1 (1.1) | 1 (0.3) | 1 (4.8) | 1 (0.3) | ||
| Autoimmune | 2 (0.5) | 1 (1.1) | 1 (0.3) | 0 (0) | 2 (0.5) | ||
| Etiology, toxic | 44 (10.7) | 17 (18.5) | 27 (8.4) | 0.001 | 10 (47.6) | 34 (8.7) | < 0.001 |
| ALT1 (IU/L) | 2053 ± 1759 | 2145 ± 2207 | 2027 ± 1611 | 0.392 | 998 ± 1090 | 2110 ± 1772 | 0.001 |
| ALP1 (IU/mL) | 155 ± 75 | 152 ± 72 | 156 ± 76 | 0.983 | 153 ± 110 | 156 ± 73 | 0.265 |
| Bilirubin1 (mg/dL) | 5.6 ± 4.9 | 11.2 ± 6.7 | 3.9 ± 2.6 | < 0.001 | 18.6 ± 6.9 | 4.9 ± 3.7 | < 0.001 |
| Albumin1 (g/dL) | 3.9 ± 0.4 | 3.8 ± 0.4 | 4.0 ± 0.4 | < 0.001 | 3.8 ± 0.4 | 3.9 ± 0.4 | 0.174 |
| PT1 (%) | 81.0 ± 18.0 | 75.2 ± 22.7 | 83.7 ± 16.6 | 0.003 | 84.6 ± 15.0 | 81.7 ± 18.6 | 0.721 |
| GWT1, mm | 5.2 ± 5.5 | 7.2 ± 6.0 | 5.5 ± 5.3 | 0.009 | 9.6 ± 6.7 | 5.7 ± 5.4 | 0.003 |
| > 3 | 233 (56.5) | 70 (70.7) | 168 (51.7) | 0.004 | 17 (81.0) | 216 (55.2) | 0.025 |
| > 7 | 142 (34.5) | 36 (39.1) | 106 (33.1) | 0.040 | 11 (52.4) | 131 (33.5) | 0.005 |
| Arterial heterogeneity (+) | 294 (80.1) | 68 (73.9) | 226 (70.6) | 0.755 | 15 (71.5) | 279 (71.3) | 1.000 |
| Periportal tracking (+) | 348 (84.7) | 78 (84.8) | 270 (84.4) | 0.869 | 18 (85.7) | 330 (84.4) | 1.000 |
| LN number1 | 4.8 ± 3.0 | 5.1 ± 3.3 | 4.8 ± 2.9 | 0.581 | 5.3 ± 3.7 | 4.8 ± 3.0 | 0.701 |
| LN size1 (cm) | 0.97 ± 0.26 | 0.99 ± 0.28 | 0.96 ± 0.26 | 0.465 | 0.97 ± 0.30 | 0.97 ± 0.26 | 0.743 |
| ≥ 0.8 | 346 (84.5) | 79 (85.9) | 267 (83.4) | 0.632 | 17 (81.0) | 329 (84.1) | 0.759 |
| > 1 | 162 (39.3) | 42 (45.7) | 120 (37.5) | 0.183 | 10 (47.6) | 152 (38.9) | 0.494 |
| Ascites (+) | 56 (13.6) | 17 (18.5) | 39 (12.2) | 0.123 | 7 (33.3) | 49 (12.5) | 0.015 |
| Spleen size1 (cm) | 10.9 ± 1.6 | 11.04 ± 1.68 | 10.84 ± 1.60 | 0.419 | 10.44 ± 1.7 | 10.91 ± 1.6 | 0.094 |
| ≥ 12 | 95 (23.1) | 24 (26.1) | 71 (22.2) | 0.483 | 3 (14.3) | 92 (23.5) | 0.431 |
Data presented as mean ± SD. ALT: Alanine aminotransferase; ALP: Alkaline phosphatase; PT: Prothrombin time; GWT: Gallbladder wall thickness; LN: Lymph node.
Correlation between CT findings and liver chemistry
GWT was related to serum ALT (r = 0.234, P < 0.001), ALP (r = 0.180, P < 0.001), bilirubin (r = 0.319, P < 0.001), albumin (r = -0.282, P < 0.001), and PT (r = -0.118, P = 0.017). Lymph node size was correlated with serum ALT (r = 0.164, P = 0.001), ALP (r = 0.135, P = 0.006), and bilirubin (r = 0.138, P = 0.005). The number of lymph nodes was correlated with serum ALP (r = 0.150, P = 0.003) and bilirubin (r = 0.202, P < 0.001). The spleen size was correlated with serum ALT (r = 0.119, P = 0.015) and bilirubin (r = 0.190, P < 0.001). Serum ALT levels (P < 0.001) and PT (P = 0.032) varied depending on the presence of arterial heterogeneity. The presence of periportal tracking was related to serum ALP (P = 0.007), bilirubin (P < 0.001), and albumin (P = 0.002). The presence of ascites was related to serum ALT (P = 0.005), bilirubin (P = 0.012), and albumin (P < 0.001) levels and PT (P = 0.006) (Table 2).
Table 2.
Relationship between computed tomography findings and liver chemistry (mean ± SD)
| GWT | LN maximum size | LN number | Spleen size |
Arterial heterogeneity |
Periportal tracking |
Ascites |
|||||||
| Absence (n = 73) | Presence (n = 294) | P value | Absence (n = 63) | Presence (n = 348) | P value | Absence (n = 356) | Presence (n = 56) | P value | |||||
| ALT(IU/L) | 0.234 (< 0.001) | 0.164 (0.001) | -0.013 (0.798) | 0.119 (0.015) | 1504 ± 1478 | 2216 ± 1794 | < 0.001 | 1994 ± 2139 | 2064 ± 1688 | 0.074 | 1981 ± 1769 | 2509 ± 1641 | 0.005 |
| ALP (IU/mL) | 0.180 (< 0.001) | 0.135 (0.006) | 0.150 (0.003) | 0.086 (0.082) | 145 ± 76 | 159 ± 75 | 0.108 | 133 ± 63 | 159 ± 76 | 0.007 | 154 ± 76 | 164 ± 66 | 0.152 |
| Bilirubin (mg/dL) | 0.319 (< 0.001) | 0.138 (0.005) | 0.202 (< 0.001) | 0.190 (< 0.001) | 5.6 ± 5.2 | 5.6 ± 4.9 | 0.451 | 4.3 ± 5.1 | 5.8 ± 4.9 | < 0.001 | 5.3 ± 4.7 | 7.0 ± 5.9 | 0.012 |
| PT (s) | -0.118 (0.017) | -0.038 (0.445) | 0.072 (0.149) | -0.092 (0.061) | 86 ± 16 | 81 ± 18 | 0.032 | 81 ± 20 | 82 ± 18 | 0.795 | 82 ± 18 | 76 ± 17 | 0.006 |
| Albumin (g/dL) | -0.282 (< 0.001) | -0.018 (0.717) | -0.017 (0.739) | -0.062 (0.206) | 4.0 ± 0.4 | 3.9 ± 0.4 | 0.404 | 4.1 ± 0.4 | 3.9 ± 0.4 | 0.002 | 4.0 ± 0.4 | 3.7 ± 0.4 | < 0.001 |
ALT: Alanine aminotransferase; ALP: Alkaline phosphatase; PT: Prothrombin time; GWT: Gallbladder wall thickness; LN: Lymph node.
Factors associated with acute hepatitis severity
On univariate analysis, age, gender, frequency of toxic hepatitis, serum bilirubin and albumin, PT at the time of CT scanning and GWT showed significant differences (P < 0.05) between the group with severe hepatitis (defined as bilirubin ≥ 10 mg/dL or PT ≤ 40% in the most severe phase) and the group with non-severe hepatitis. On multivariate analysis, male gender [odds ratio (OR) = 2.569, 95%CI: 1.477-4.469, P = 0.001], toxic hepatitis (OR = 3.531, 95%CI: 1.444-8.635, P = 0.006), low serum albumin (OR = 2.154, 95%CI: 1.279-3.629, P = 0.004), and high GWT (OR = 1.061, 95%CI: 1.015-1.110, P = 0.009) independently predicted severe hepatitis (Tables 1 and 3).
Table 3.
Multivariate logistic regression analysis for the factors associated with severe acute hepatitis and prolonged cholestasis in acute hepatitis
| Variables | OR |
95%CI for OR |
P value | |
| Lower | Upper | |||
| Severe acute hepatitis | ||||
| Age (yr) | 1.007 | 0.928 | 1.033 | 0.579 |
| Gender, male | 2.569 | 1.477 | 4.469 | 0.001 |
| Etiology, toxic | 3.531 | 1.444 | 8.635 | 0.006 |
| Albumin (g/dL) | 2.154 | 1.279 | 3.629 | 0.004 |
| GWT (mm) | 1.061 | 1.015 | 1.110 | 0.009 |
| Prolonged cholestasis in acute hepatitis | ||||
| Age (yr) | 0.393 | 0.059 | 2.599 | 0.333 |
| Etiology, toxic | 6.848 | 0.960 | 48.859 | 0.055 |
| ALT (IU/L) | 1.000 | 1.000 | 1.001 | 0.607 |
| Bilirubin (mg/dL) | 1.628 | 1.331 | 1.991 | < 0.001 |
| GWT (mm) | 1.172 | 1.024 | 1.342 | 0.021 |
| Ascites | 0.484 | 0.119 | 6.039 | 0.869 |
GWT: Gallbladder wall thickness; ALT: Alanine aminotransferase; OR: Odds ratio.
Factors associated with prolonged cholestasis
Patient age, frequency of toxic hepatitis, serum ALT and bilirubin levels at the time of CT scan, GWT, and the frequency of ascites differed significantly between patients with prolonged cholestasis and those with non-prolonged cholestasis (Table 1). In this study, prolonged cholestasis was defined as serum bilirubin levels of 10 mg/dL or higher sustained for longer than 14 d. On multivariate analysis, elevated serum bilirubin (OR = 1.628, 95%CI: 1.331-1.991, P < 0.001) and increased GWT (OR = 1.172, 95%CI: 1.024-1.342, P = 0.021) were independently predictive for prolonged cholestasis. Three hundred and fifty-six of 357 patients with bilirubin levels less than 10 mg/dL at the time of CT scan were assigned to the non-prolonged cholestasis group. Among patients with serum bilirubin levels ≥ 10 mg/dL (n = 55), 79% (22/28) of patients with GWT less than 5 mm were classified in the non-prolonged cholestasis group, and 71% (5/7) of those with GWT of 13 mm or higher were classified in the prolonged cholestasis group (Tables 1 and 3).
DISCUSSION
Hepatomegaly, increased periportal echogenicity, decreased parenchymal echogenicity, lymph node enlargement, and a thickened gallbladder wall are frequently observed during the ultrasonographic examination of patients with acute hepatitis[2,9-12]. Similar findings also appear on CT scan[13-16], and CT easily detects lymphadenopathy and gallbladder wall thickening. The “periportal tracking” observed on CT may correspond to the same pathology as “increased periportal echogenicity” on ultrasonography. The non-homogeneity of liver parenchyma observed in the arterial phase of dynamic CT (arterial heterogeneity) is a CT-specific image generated by contrast media in patients with acute hepatitis[17]. These image findings are most commonly observed at the icteric phase of acute hepatitis[3].
Thickening of the gallbladder wall has attracted attention because it may be detected by ultrasonography in 51%-91% of patients with acute hepatitis[18-22]. In a recent study, ultrasonography within 7 d after symptomatic onset of acute hepatitis showed morphological changes in the gallbladder in more than 80% of patients, and these findings normalized as the hepatitis improved clinically[20]. In the present study, 56.6% of patients with acute hepatitis demonstrated an abnormal GWT when GWT > 3 mm was defined as abnormal. In addition, we observed other CT findings in patients with acute hepatitis, including lymph node enlargement, periportal tracking, and arterial heterogeneity at frequencies of 84.5%, 84.7% and 80.1%, respectively. These values were all higher than the frequency of GWT.
Correlations between imaging and laboratory findings in acute hepatitis have not been closely investigated. Studies on the correlation between GWT and the liver chemistry index show conflicting results. Some studies show that GWT increases at elevated serum aminotransferase levels[22,23], while other studies do not show this correlation[18,19,24]. Suk et al[24] showed a significant correlation between GWT and increases in serum bilirubin. In the present study, GWT clearly correlated with elevated serum bilirubin and liver enzymes, which supports the hypothesis that inflammation and necrosis in the liver parenchyma induce an inflammatory reaction and hyperemia in muscular and serosal layers of the gallbladder wall[23]. We also found a negative correlation between GWT and serum albumin levels, which suggests that hypoalbuminemia caused by acute hepatitis contributes to gallbladder wall edema. Patients with chronic renal insufficiency or cirrhosis who also have hypoalbuminemia frequently present gallbladder wall thickening[14].
In the present study, imaging findings other than GWT showed significant correlations with the serum levels of ALT, ALP, bilirubin, albumin and PT. These imaging findings included lymph node enlargement around the hepatoduodenal ligament, arterial heterogeneity, and periportal tracking. These correlations suggested that image findings may reflect liver damage and hepatic dysfunction, at least to some degree (Table 2). We therefore tested the prognostic value of imaging data in patients with acute hepatitis. First, we designated patients with serum bilirubin levels ≥ 10 mg/dL or PT index ≤ 40% despite the administration of vitamin K as having severe hepatitis, and we then sought to identify factors that may predict this outcome. In our analysis, male gender, toxic hepatitis, low serum albumin, and increased GWT independently predicted severe hepatitis. Furthermore, increased GWT and high serum bilirubin levels at the time of CT scanning independently predicted prolonged cholestasis. Because only approximately 20% of patients with hyperbilirubinemia (serum bilirubin > 10 mg/dL) at the time of CT scan showed prolonged cholestasis if their GWT was < 5 mm, the detection of GWT may be of value in predicting prolonged cholestasis in patients with acute hepatitis. Of course, other imaging modalities could substitute for CT scan unless CT is absolutely necessary, especially in young patients, to avoid unnecessary radiation exposure if they could also depict changes in the gallbladder, considering arguments on the safety of radiation exposure caused by CT scan in young patients[25,26].
This study is limited by its retrospective design. Therefore, we could not investigate the correlation between imaging findings and the duration of hospitalization because the criteria for patient discharge were not set in advance. Similarly, we could not determine the time of symptomatic onset of hepatitis in many patients. However, this study is strengthened by its size, which allowed us to confirm significant correlations between imaging findings and liver chemistry data in patients with acute hepatitis. In addition, this study revealed the value of GWT for predicting the outcome of acute hepatitis.
In conclusion, abdominal CT findings and liver biochemical parameters in patients with acute hepatitis showed some correlations, and GWT was the only imaging variable that independently predicted the severity of acute hepatitis or prolonged cholestasis.
COMMENTS
Background
In patients with suspected acute hepatitis, imaging studies, such as ultrasonography or computed tomography (CT), are usually performed to rule out other diseases presenting with similar clinical and biochemical abnormalities (e.g., extrahepatic cholestasis, diffuse metastatic disease or cirrhosis).
Research frontiers
Studies on the correlation between imaging and laboratory findings in acute hepatitis have shown conflicting results.
Innovations and breakthroughs
This large-scale study has revealed significant correlations between abdominal CT findings and liver biochemical parameters. Furthermore, gallbladder wall thickness (GWT), which can be easily measured by other imaging techniques as well, was found to be valuable for predicting the outcome of patients with acute hepatitis.
Applications
The results of this study suggest that GWT measurement by imaging modalities is helpful to classify patients with severe acute hepatitis or prolonged cholestasis.
Terminology
GWT refers to the thickness of the gallbladder wall vertical to the surface of the liver in the part adjacent to the liver.
Peer review
The authors describe the CT findings of severe acute hepatitis in 412 hospitalized patients. They found that GWT was an independent predictive factor for severe hepatitis. My main criticism is the relevance of such a paper. This study involved exposing young people to unnecessary radiation.
Footnotes
Supported by A Grant of the Korea Healthcare Technology R-D Project, Ministry of Health and Welfare, South Korea, No. A102065
P- Reviewer Malnick SDH S- Editor Gou SX L- Editor A E- Editor Xiong L
References
- 1.Aslam R, Sun Y, Yee J. Critical evaluation of the specificity and sensitivity of liver imaging. In: Boyer TD, Wright TL, Manns MP, Zakim D, editors. Zakim and Boyer’s hepatology: a textbook of liver disease. 5th ed. Philadelphia, PA: Saunders Elsevier; 2006. p. 286. [Google Scholar]
- 2.Tchelepi H, Ralls PW, Radin R, Grant E. Sonography of diffuse liver disease. J Ultrasound Med. 2002;21:1023–1032; quiz 1033-1034. doi: 10.7863/jum.2002.21.9.1023. [DOI] [PubMed] [Google Scholar]
- 3.Yoo SM, Lee HY, Song IS, Lee JB, Kim GH, Byun JS. Acute hepatitis A: correlation of CT findings with clinical phase. Hepatogastroenterology. 2010;57:1208–1214. [PubMed] [Google Scholar]
- 4.Jaeckel E, Cornberg M, Wedemeyer H, Santantonio T, Mayer J, Zankel M, Pastore G, Dietrich M, Trautwein C, Manns MP. Treatment of acute hepatitis C with interferon alfa-2b. N Engl J Med. 2001;345:1452–1457. doi: 10.1056/NEJMoa011232. [DOI] [PubMed] [Google Scholar]
- 5.Mondelli MU, Cerino A, Cividini A. Acute hepatitis C: diagnosis and management. J Hepatol. 2005;42 Suppl:S108–S114. doi: 10.1016/j.jhep.2004.10.017. [DOI] [PubMed] [Google Scholar]
- 6.Alvarez F, Berg PA, Bianchi FB, Bianchi L, Burroughs AK, Cancado EL, Chapman RW, Cooksley WG, Czaja AJ, Desmet VJ, et al. International Autoimmune Hepatitis Group Report: review of criteria for diagnosis of autoimmune hepatitis. J Hepatol. 1999;31:929–938. doi: 10.1016/s0168-8278(99)80297-9. [DOI] [PubMed] [Google Scholar]
- 7.Mathiesen LR, Skinoj P, Nielsen JO, Purcell RH, Wong D, Ranek L. Hepatitis type A, B, and non-A non-B in fulminant hepatitis. Gut. 1980;21:72–77. doi: 10.1136/gut.21.1.72. [DOI] [PMC free article] [PubMed] [Google Scholar]
- 8.Gordon SC, Reddy KR, Schiff L, Schiff ER. Prolonged intrahepatic cholestasis secondary to acute hepatitis A. Ann Intern Med. 1984;101:635–637. doi: 10.7326/0003-4819-101-5-635. [DOI] [PubMed] [Google Scholar]
- 9.Needleman L, Kurtz AB, Rifkin MD, Cooper HS, Pasto ME, Goldberg BB. Sonography of diffuse benign liver disease: accuracy of pattern recognition and grading. AJR Am J Roentgenol. 1986;146:1011–1015. doi: 10.2214/ajr.146.5.1011. [DOI] [PubMed] [Google Scholar]
- 10.Toppet V, Souayah H, Delplace O, Alard S, Moreau J, Levy J, Spehl M. Lymph node enlargement as a sign of acute hepatitis A in children. Pediatr Radiol. 1990;20:249–252. doi: 10.1007/BF02019659. [DOI] [PubMed] [Google Scholar]
- 11.Kurtz AB, Rubin CS, Cooper HS, Nisenbaum HL, Cole-Beuglet C, Medoff J, Goldberg BB. Ultrasound findings in hepatitis. Radiology. 1980;136:717–723. doi: 10.1148/radiology.136.3.7403553. [DOI] [PubMed] [Google Scholar]
- 12.Portincasa P, Moschetta A, Di Ciaula A, Palmieri VO, Milella M, Pastore G, Palasciano G. Changes of gallbladder and gastric dynamics in patients with acute hepatitis A. Eur J Clin Invest. 2001;31:617–622. doi: 10.1046/j.1365-2362.2001.00834.x. [DOI] [PubMed] [Google Scholar]
- 13.Kawamoto S, Soyer PA, Fishman EK, Bluemke DA. Nonneoplastic liver disease: evaluation with CT and MR imaging. Radiographics. 1998;18:827–848. doi: 10.1148/radiographics.18.4.9672968. [DOI] [PubMed] [Google Scholar]
- 14.Zissin R, Osadchy A, Shapiro-Feinberg M, Gayer G. CT of a thickened-wall gall bladder. Br J Radiol. 2003;76:137–143. doi: 10.1259/bjr/63382740. [DOI] [PubMed] [Google Scholar]
- 15.Saini S. Imaging of the hepatobiliary tract. N Engl J Med. 1997;336:1889–1894. doi: 10.1056/NEJM199706263362607. [DOI] [PubMed] [Google Scholar]
- 16.Mortele KJ, Ros PR. Imaging of diffuse liver disease. Semin Liver Dis. 2001;21:195–212. doi: 10.1055/s-2001-15496. [DOI] [PubMed] [Google Scholar]
- 17.Rofsky NM, Fleishaker H. CT and MRI of diffuse liver disease. Semin Ultrasound CT MR. 1995;16:16–33. doi: 10.1016/0887-2171(95)90012-8. [DOI] [PubMed] [Google Scholar]
- 18.Han KS, Choi GB, Chang IJ, Lee SN, Kyung NH, Park LG. [Thickening of the gallbladder wall in acute viral hepatitis; ultrasonographic consideration] Korean J Med. 1985;28:823–827. [Google Scholar]
- 19.Maudgal DP, Wansbrough-Jones MH, Joseph AE. Gallbladder abnormalities in acute infectious hepatitis. A prospective study. Dig Dis Sci. 1984;29:257–260. doi: 10.1007/BF01296260. [DOI] [PubMed] [Google Scholar]
- 20.Maresca G, De Gaetano AM, Mirk P, Cauda R, Federico G, Colagrande C. Sonographic patterns of the gallbladder in acute viral hepatitis. J Clin Ultrasound. 1984;12:141–146. doi: 10.1002/jcu.1870120305. [DOI] [PubMed] [Google Scholar]
- 21.van Breda Vriesman AC, Engelbrecht MR, Smithuis RH, Puylaert JB. Diffuse gallbladder wall thickening: differential diagnosis. AJR Am J Roentgenol. 2007;188:495–501. doi: 10.2214/AJR.05.1712. [DOI] [PubMed] [Google Scholar]
- 22.Jüttner HU, Ralls PW, Quinn MF, Jenney JM. Thickening of the gallbladder wall in acute hepatitis: ultrasound demonstration. Radiology. 1982;142:465–466. doi: 10.1148/radiology.142.2.7054838. [DOI] [PubMed] [Google Scholar]
- 23.Kim MY, Baik SK, Choi YJ, Park DH, Kim HS, Lee DK, Kwon SO. Endoscopic sonographic evaluation of the thickened gallbladder wall in patients with acute hepatitis. J Clin Ultrasound. 2003;31:245–249. doi: 10.1002/jcu.10167. [DOI] [PubMed] [Google Scholar]
- 24.Suk KT, Kim CH, Baik SK, Kim MY, Park DH, Kim KH, Kim JW, Kim HS, Kwon SO, Lee DK, et al. Gallbladder wall thickening in patients with acute hepatitis. J Clin Ultrasound. 2009;37:144–148. doi: 10.1002/jcu.20542. [DOI] [PubMed] [Google Scholar]
- 25.Brenner DJ, Hall EJ. Computed tomography--an increasing source of radiation exposure. N Engl J Med. 2007;357:2277–2284. doi: 10.1056/NEJMra072149. [DOI] [PubMed] [Google Scholar]
- 26.Pearce MS, Salotti JA, Little MP, McHugh K, Lee C, Kim KP, Howe NL, Ronckers CM, Rajaraman P, Sir Craft AW, et al. Radiation exposure from CT scans in childhood and subsequent risk of leukaemia and brain tumours: a retrospective cohort study. Lancet. 2012;380:499–505. doi: 10.1016/S0140-6736(12)60815-0. [DOI] [PMC free article] [PubMed] [Google Scholar]