

Abstract
Visual selection requires mechanisms for representing object salience and for shifting the focus of processing to novel objects. It is not clear from computational or neural models whether these operations are performed within the same or different brain regions. Here, we use repetitive transcranial magnetic stimulation to briefly interfere with neural activity in individually localized regions of human posterior parietal cortex (PPC) that are putatively involved in attending to contralateral locations or shifting attention between locations. Stimulation over right ventral intraparietal sulcus impaired target discrimination at contralateral locations, whereas stimulation over right medial superior parietal lobule impaired target discrimination after a shift of attention regardless of its location. This double dissociation is consistent with neuroimaging studies and indicates that mechanisms of visual selection are partly anatomically segregated in human PPC.
Introduction
Visual selection mechanisms are crucial for goal-driven behavior. Computational models suggest a distinction between mechanisms that represent the features and saliency of objects and those that shift the focus of processing (Koch and Ullman, 1985; Itti and Koch, 2001). Object features are represented in extrastriate visual cortex, whereas object saliency, either defined by sensory distinctiveness or task relevance, may be coded in saliency maps in dorsal parietal and prefrontal cortex (Wandell et al., 2007; Silver and Kastner, 2009). Neurally, mechanisms for shifting attention have been conceptualized as a local “winner-take-all” mechanism within saliency maps (Koch and Ullman, 1985; Itti and Koch, 2001) or as a “routing” mechanism that dynamically links peaks of saliency in prefrontal or posterior parietal regions with appropriate locations within feature maps in sensory cortex (Olshausen and Field, 2004).
However, recent neuroimaging studies suggest a partial separation between maps for saliency coding and shifts of attention. Specifically, a set of regions, including a large area near or at the medial superior parietal lobule (mSPL) is transiently recruited whenever people shift attention between locations, objects features, or even task sets (Yantis et al., 2002; Shomstein and Yantis, 2004; Chiu and Yantis, 2009; Shulman et al., 2009). In contrast, regions in more lateral intraparietal sulcus (IPS) and SPL not only show signals time-locked to shifts of attention but also code for the current locus of attention, consistent with a role in saliency coding (Yantis et al., 2002; Shulman et al., 2009).
Although these studies have provided invaluable information on the neural mechanisms of attentional control, there is actually scarce direct or “causal” evidence that these regions are actually mediating these processes. Regions in IPS and mSPL are rarely damaged in isolation by stroke or other lesions (Cavanna and Trimble, 2006; but see Vandenberghe et al., 2012), and there have been only a handful of inactivation studies using transcranial magnetic stimulation (TMS) testing the functional role of IPS and mSPL regions (Capotosto et al., 2009; Vesia et al., 2010).
Here we used repetitive TMS (rTMS) in healthy volunteers to test with a causal interference approach hypotheses that are based on fMRI findings (i.e., correlative) and specifically the role of IPS cortex in mediating allocation of attention to contralateral locations and mSPL in mediating shifting of attention between locations. Sustained and transient components of spatial attention were measured with a paradigm that controls the locus of attention during visual discrimination (Yantis et al., 2002; Shulman et al., 2009). These regions were localized in each subject with fMRI to maximize the accuracy of rTMS targeting. The prediction is that inactivation of the right ventral IPS (vIPS), a region near or at retinotopic area V7/IPS0 (Wandell et al., 2007; Silver and Kastner, 2009), will disrupt target discrimination at attended locations in the contralateral visual field, whereas inactivation of mSPL will affect shifting of attention, impairing target discrimination after shift cues, regardless of spatial location (Yantis et al., 2002; Shulman et al., 2009).
Materials and Methods
Subjects and stimuli.
Fifteen right-handed [Edinburgh Inventory Index (Oldfield, 1971), 0.78 ± 0.2] volunteers (age range, 19–29 years old; nine females), with no previous psychiatric or neurological history, participated in the experiments. Participants gave written consent according to the Code of Ethics of the World Medical Association and the Institutional Review Board and Ethics Committee of the University of Chieti.
Stimuli were generated using Psychtoolbox-3 (Brainard, 1997) and consisted of two drifting Gabor patches (3° diameter, 2 cycles/° spatial frequency, 0.7°/s drift rate) constantly presented on left and right locations at an eccentricity of 5.5° from central fixation. Targets consisted of a 150-ms-duration change in the orientation of one of the patches (clockwise/counterclockwise).
Participants were instructed to detect and discriminate orientation changes as fast as possible by pressing a right/left button on a response box with their right hand. Targets (n = 108) occurred on average every 11 s. At random intervals between 4 and 6 s, a 300 ms isoluminant change in color (n = 240) was simultaneously applied to both patches (cyan, pink), indicating the to-be-attended location (left, right). The to-be-attended location was indicated by one of the colors, which was shown at the beginning of each run and counterbalanced across runs. Cue and target onset were independent except that a target could not occur in a temporal window extending from 2 s before to 1 s after a cue. Cue–target interval was on average 2.06 s. Cue location correctly predicted target location with 0.80 probability but provided no temporal prediction of target onset. A cue could appear in the same location as the previous one (stay cue) or in the opposite location (shift cue). In both the fMRI and TMS experiments, online monitoring of gaze ensured that participants constantly maintained central fixation (Fig. 1).
Figure 1.

Example of the display sequence in the visual search task.
Subject enrollment was based on a preliminary behavioral session in which performance and eye position (Iscan ETL-400, RK-826 PCI) were monitored. Only subjects showing a significant validity effect on target discrimination accuracy (p < 0.05) and who were able to maintain central fixation were enrolled in the study. Eye position in the 100 ms interval before each cue onset was used as a baseline to assess changes of eye position during the following 2 s. Subjects with eye movements larger than 1° were excluded. Mean values of the experimental group of subjects were 0.03 ± 0.15° (mean ± SD) and −0.10 ± 0.14° for right and left shifts, respectively. Participants completed 12 fMRI runs of 210 s duration and four TMS blocks of 360 s duration each.
fMRI image acquisition and apparatus.
Functional T2*-weighted images were collected using a Philips Achieva 3 T scanner and a gradient-echo planar imaging sequence to measure blood oxygenation level-dependent (BOLD) contrast over the whole brain [repetition time (TR), 1869 ms; echo time (TE), 25 ms; 39 slices acquired in ascending interleaved order; 3.59 mm3; 64 × 64 matrix; flip angle, 80°]. Structural images were collected using a sagittal magnetization-prepared rapid acquisition gradient echo T1-weighted sequence (TR, 8.1 ms; TE, 3.7 ms; flip angle, 8°; voxel size, 1 mm3). Stimuli were presented with a standard personal computer running MATLAB software (MathWorks) and projected onto a screen positioned at the back of the magnet bore and visible through a mirror attached to the head coil.
fMRI preprocessing and statistical analyses.
Preprocessing of BOLD images included slice scan time correction through sinc interpolation, whole-brain normalization to correct for changes in signal intensity across runs and head movement correction. Images were resampled into 3 mm isotropic voxels and warped into a standardized atlas space (Talairach and Tournoux, 1988).
The hemodynamic response time-locked to cue onset was estimated without assuming a shape of the hemodynamic response, on a voxel-by-voxel basis, according to the general linear model (Ollinger et al., 2001a). Evoked responses to cue stimuli were analyzed as a function of cue type (stay, shift) and cue location (left, right). Each regressor consisted of seven time points extending out to 13.1 s. In addition, regressors were included for baseline and linear trend in each scan.
The time courses of the evoked responses to cue stimuli were analyzed at the whole-brain level using voxelwise ANOVAs with cue type, cue location, and time (seven time points) as factors. Voxelwise ANOVAs were corrected for non-independence of time points by adjusting the degrees of freedom and for multiple comparisons using joint z-score/cluster size thresholds (Forman et al., 1995) corresponding to z = 3 and a cluster size of 13 contiguous voxels. A peak-finding routine was used to extract regions of interest (ROIs) with 6 mm radius and minimum 6 mm ROI–ROI distance from the cue type × time and cue location × time maps. For display purpose, images were mapped to surface-based representations using the PALS atlas and CARET software (Van Essen, 2005).
Procedures for single-subject identification of TMS stimulation sites.
To identify parietal regions selective for attending to contralateral locations versus shifting attention between locations, we combined single-subject contrasts maps between shift versus stay and left versus right regressors with group-averaged ANOVA maps of cue type × time and cue location × time. Specifically, we first extracted activation peaks from single-subject contrast maps using a peak-finding routine (see above). We then selected in each subject the two peak coordinates in right mSPL (for shift vs stay) and vIPS (for left vs right) that showed the best score calculated as the average value of the vector distance from the group-averaged strongest peaks in right mSPL and vIPS, and the rank of the effect size (position in the ROI list, sorted by z-score).
Procedures for rTMS and identification of target scalp regions.
TMS stimulation was delivered through a focal, figure eight coil, connected with a standard Mag-Stim Rapid 2 stimulator (maximum output 2.2 T). Individual resting excitability threshold for right motor cortex stimulation was preliminarily determined following standardized procedures (Rossini et al., 1994). The rTMS train was delivered 500 ms before cue onset in 60% of cue presentations with the following parameters: 150 ms duration, 20 Hz frequency, and intensity set at 100% of the individual motor threshold. The parameters are consistent with published safety guidelines for TMS stimulation (Rossi et al., 2009).
Participants performed two active rTMS conditions corresponding to each stimulation site, applied in different blocks and counterbalanced across subjects. A mechanical arm maintained the handle of the coil angled at ∼45° away from the midline, and the center of the coil wings was positioned on the scalp to deliver the maximum rTMS intensity over each site (individual peak of activation). Stimulation sites were identified on each subject's scalp using the SofTaxic navigator system (E.M.S. Italy). The individual coordinates for the two parietal stimulation sites are reported in Table 1.
Table 1.
Individual coordinates of stimulated sites
| Right mSPL |
Right vIPS |
|||||
|---|---|---|---|---|---|---|
| x | y | z | x | y | z | |
| Subject 1 | 1 | −69 | 48 | 14 | −87 | 20 |
| Subject 2 | 7 | −56 | 47 | 25 | −85 | 23 |
| Subject 3 | 7 | −63 | 54 | 21 | −93 | 19 |
| Subject 4 | 10 | −49 | 54 | 17 | −79 | 29 |
| Subject 5 | 9 | −72 | 44 | 34 | −83 | 22 |
| Subject 6 | 14 | −61 | 57 | 24 | −71 | 30 |
| Subject 7 | 12 | −62 | 59 | 22 | −88 | 13 |
| Subject 8 | 3 | −57 | 54 | 24 | −85 | 16 |
| Subject 9 | 8 | −51 | 55 | 31 | −74 | 23 |
| Subject 10 | 2 | −55 | 41 | 29 | −84 | 8 |
| Subject 11 | 9 | −75 | 48 | 22 | −82 | 12 |
| Subject 12 | 13 | −66 | 60 | 14 | −80 | 21 |
| Subject 13 | 1 | −78 | 41 | 16 | −90 | 21 |
| Subject 14 | 1 | −56 | 43 | 23 | −93 | 18 |
| Subject 15 | 15 | −50 | 54 | 24 | −81 | 11 |
| Mean | 7.47 | −61.33 | 50.60 | 22.67 | −83.67 | 19.07 |
| SD | 4.91 | 9.12 | 6.42 | 5.85 | 6.25 | 6.27 |
rTMS statistical analyses.
Statistical analyses were conducted using within-subject ANOVAs for repeated measures. Mauchley's test was used to evaluate sphericity assumption, Greenhouse-Geisser procedure was used to correct degrees of freedom, and Duncan tests were used for post hoc comparisons (p < 0.05). The percentage of correct target discrimination was assessed for valid targets after stimulated cues as a function of TMS site, cue type, and cue location.
As a baseline control and to verify that behavioral deficits induced by rTMS did not reflect a cumulative effect, we computed the same ANOVA on valid target stimuli after nonstimulated cues (40% of cue presentations). Finally, to verify the temporal extent of the rTMS effects, the same ANOVA was conducted after splitting the set of valid stimulated targets in two blocks (targets presented before or 2 s after the cue).
Results
fMRI localization of posterior parietal regions
The two parietal stimulation sites were localized based on the pattern of fMRI response to shift versus stay and left versus right cues. Figure 2A (left) shows that right mSPL transiently responded more strongly to shift than stay cues, consistent with a response time-locked to shifts of attention (Fig. 2B, left: time course of cue type × time). Figure 2A (right) shows a region in right vIPS that exhibited sustained, spatially selective responses, i.e., left (shift + stay) > right (shift + stay) as subjects monitored visual stimuli for target discrimination (Fig. 2B, right: time courses cue location × time). Also note the relative variability of individual peaks compared with the average group response (Table 1).
Figure 2.
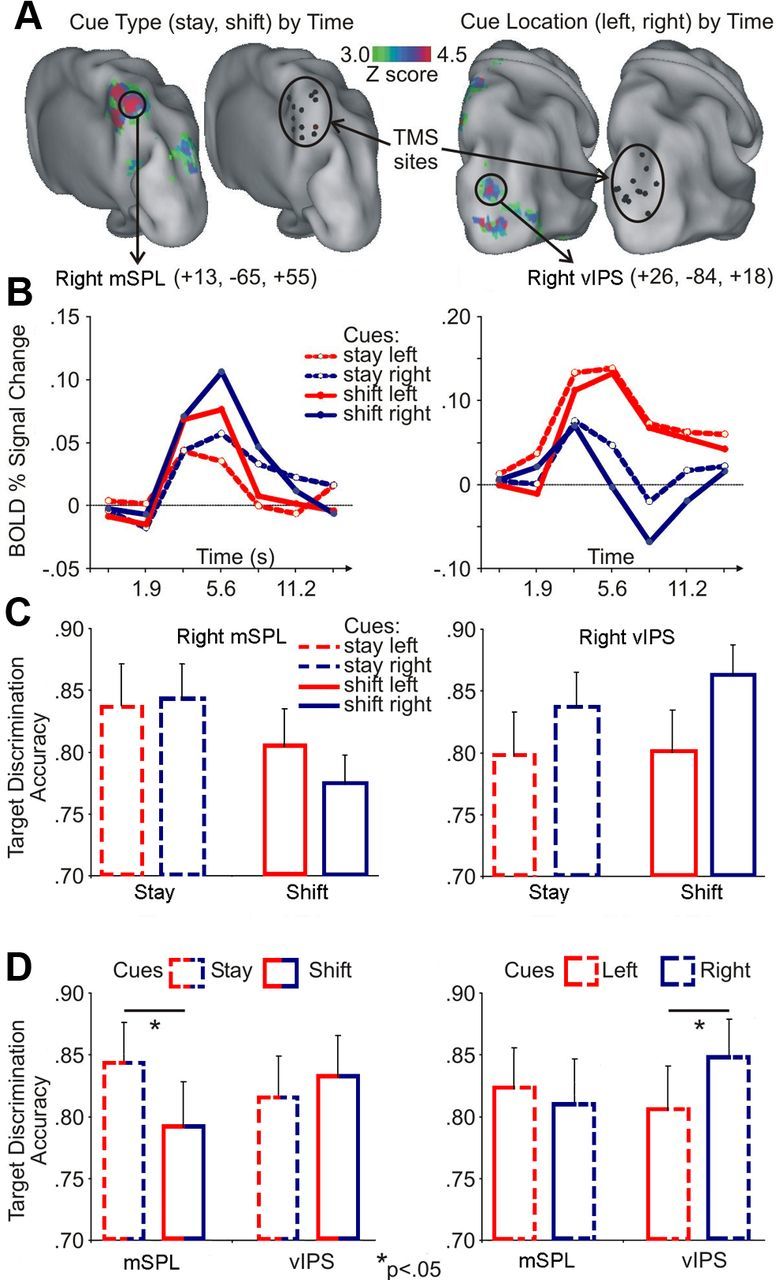
A, Left, Voxels showing significantly group-wise different fMRI activation after shift versus stay cues, superimposed over an inflated cortical representation of the PALS atlas, along with the corresponding individual sites of TMS stimulation (black spheres). Right, Voxels showing significantly different fMRI activation after left versus right cues and the corresponding stimulation sites. B, The plots show the time course of the BOLD response extracted from peak regions in right mSPL and right vIPS in the group ANOVA maps, indicated by black circles in A. Activity is modulated according to cue type and location, respectively. C, Group mean ± SE target discrimination accuracy for right mSPL (left) and right vIPS (right) as a function of cue type (shift, stay) and cue location (left, right). D, Left, Group mean ± SE target discrimination accuracy for the two rTMS conditions (right mSPL, right vIPS) as a function of cue type (shift, stay). Right, Group mean ± SE target discrimination accuracy for the two rTMS conditions (right mSPL, right vIPS) as a function of cue location (left, right). Duncan's post hoc tests, *p < 0.05.
TMS interference
Target detection accuracy was very high in all experimental conditions (missed targets: vIPS, 6.9%; mSPL, 8.1%), suggesting that TMS had no effect on simple detection. Figure 2, C and D, plots the behavioral effects of rTMS on target discrimination as a function of preceding cue for right mSPL and right vIPS stimulation. Whereas right mSPL stimulation impaired target discrimination after shift cues compared with stay cues, right vIPS stimulation impaired target discrimination after contralateral versus ipsilateral cues. These conclusions are supported by a significant interaction of TMS site × cue type (stay, shift) (F(1,14) = 5.19, p = 0.039) and relevant post hoc tests (p < 0.05) (Fig. 2D, left graph) and a significant interaction between TMS site and cue location (left, right) (F(1,14) = 5.6, p = 0.05) and relevant post hoc tests (p < 0.05) (Fig. 2D, right graph). Importantly, discrimination accuracy was comparable between the two visual fields after right mSPL stimulation and between shift and stay cues after right vIPS stimulation (Fig. 2D). Moreover, the three-way interaction was not significant (p = 0.3), thus confirming the specificity/independence of the observed modulations. Hence, these findings show a double dissociation between inactivation of right mSPL that affects target discrimination after shifts of attention between spatial locations and inactivation of right vIPS that impairs target discrimination at contralateral locations.
Critically, these deficits were only observed on trials in which rTMS was applied. A control analysis showed no statistical interactions when targets were preceded by cue stimuli that were not coupled with rTMS (p > 0.05). Finally, the effect of rTMS extended over several seconds within a trial, as shown by the lack of significant differences in accuracy for cue–target stimulus onset asynchrony smaller or greater than 2 s.
Discussion
We used a combined fMRI–TMS approach to test the causal role of different parietal regions in attending to contralateral locations versus shifting attention to novel objects/locations, respectively. These visual routines are fundamental for current computational models of visual attention (Koch and Ullman, 1985; Itti and Koch, 2001). For the first time, using a causal approach, we show a double dissociation between medial and lateral parietal cortex: whereas magnetic stimulation of the mSPL selectively impaired target discrimination after a shift of attention independent of its direction (left to right or vice versa), vIPS stimulation impaired target discrimination in the contralateral visual field, independent of cue type (shift or stay). This result causally supports previous correlation findings on sustained versus transient activity in parietal cortex and suggests an anatomical segregation of control mechanisms in human posterior parietal cortex.
Current neural models of visuospatial attention
Neuroimaging studies have shown that maintenance of spatial attention to a peripheral location recruits visual extrastriate, posterior parietal along medial IPS and prefrontal regions (for review, see Corbetta and Shulman, 2002). Many of these regions are retinotopically organized with at least half a dozen maps described in posterior parietal cortex (Wandell et al., 2007; Silver and Kastner, 2009). It is currently believed that some of these regions contain saliency maps that code for the locations of behaviorally relevant objects (Kastner and Ungerleider, 2000; Corbetta and Shulman, 2002). More recent studies have shown that cortex near or at precuneus extending dorsally in the superior parietal lobule is transiently activated by shifts of spatial attention (Shulman et al., 2009; Vandenberghe and Gillebert, 2009; Tosoni et al., 2012). Importantly, these responses occur when the shift of attention is engendered by both symbolic information (Yantis et al., 2002) or salient sensory stimuli (Shulman et al., 2009). This attention signal is not modulated by the direction of the shift, i.e., from left to right visual field or vice versa, and it has been also described for nonspatial selection of stimulus features, objects, sensory modalities, and cognitive domains (Yantis et al., 2002; Shomstein and Yantis, 2004; Chiu and Yantis, 2009). These findings suggest that mSPL represents a domain-independent source of cognitive control for task set (Greenberg et al., 2010), akin to a “shifter” controller envisioned by computational models.
Our fMRI data are consistent with this framework. Sustained spatially selective modulation of visual responses (contralateral > ipsilateral) were recorded in extrastriate visual cortex and vIPS, whereas shifting attention evoked transient responses in medial parietal regions that were independent from the direction of the shift. vIPS has been consistently found to display strong spatially selective signals during visuospatial attention (Sylvester et al., 2007) and may correspond to retinotopic area IPS0/V7 (Wandell et al., 2007; Silver and Kastner, 2009). Stronger spatial selectivity in posterior/ventral IPS than in regions of the anterior or middle IPS is also consistent with a recent model suggesting a distinction between middle versus posterior segments of medial IPS for general attention selection versus specific visuospatial attention (Vandenberghe and Gillebert, 2009; Vandenberghe et al., 2012). The pattern of response in mSPL is consistent with a series of studies on the same area by Yantis et al. (2002) and Shulman and colleagues (Shulman et al., 2009; Tosoni et al., 2012).
Functional double dissociation in parietal cortex for attending to contralateral locations versus shifting attention between locations
Although ischemic lesions only rarely affect regions near or at the mSPL (Cavanna and Trimble, 2006), the few available neuropsychological evidence is consistent with a causal role for this region in shifting attention. For example, deficits of attentive tracking on multi-object displays were reported in a patients with a left hemisphere lesion centered around the mSPL (Cavanna and Trimble, 2006). More recently, Vandenberghe et al., 2012 examined the performance of a patient with a bilateral lesion in the medial wall of SPL during a “cued competition paradigm” in which targets could be either presented alone or with a distracter. Interestingly, performance was impaired for discrimination of invalidly (compared with validly) cued trials presented in both hemifields, consistent with a shifting attention deficit, but was not impaired by the presentation of a distracter in the unattended location, consistent with a normal saliency gradient for relevant versus irrelevant objects. Finally, the causal role of the mSPL in shifting attention between locations in both hemifields reported in the present study is consistent with the neuroanatomy and neuropsychology in Balint's syndrome (Hecaen and De Ajuriaguerra, 1954) that is typically associated with bilateral damage of the occipito-parietal cortex extending into the mSPL. Two of the core deficits in Balint's syndrome: ocular apraxia, i.e., erratic fixation patterns, and simultagnosia, i.e., a form of tunnel vision in which patients see only one object at the time, have been both interpreted as reflecting damage to a mechanism for shifting attention, regardless of the specific direction (Vandenberghe et al., 2012).
Conversely, a severe breakdown of spatial attention mechanisms is commonly associated with the unilateral neglect syndrome, which typically follows ischemic lesions in the territory of the inferior branches of the middle cerebral artery (Corbetta and Shulman, 2011; Vandenberghe et al., 2012). Although different accounts have been proposed to reconcile the anatomy of neglect, which typically involves ventral frontal or temporo-parietal regions and underlying white matter, with two decades of fMRI studies recording visuospatial attention signals in more dorsal regions of IPS and SPL (Vandenberghe et al., 2012), causal evidence for the role of these regions in spatial attention and saliency is scarce. Cortical infarction rarely produces focal lesions that selectively involve distinct subregions of the parietal cortex. Nevertheless, recent studies found that lesions in the SPL, posterior IPS, and middle IPS cause deficits in goal-driven shifting, visuospatial, and selective attention, respectively (Shomstein et al., 2010; Vandenberghe et al., 2012). In addition, combined TMS–EEG studies from our group indicate that disruption of activity during the allocation of spatial attention in posterior IPS not only affects target detection but also produces abnormalities of occipito-parietal alpha desynchronization that are consistent with an impaired top-down influence from parietal to visual occipital cortex (Capotosto et al., 2009). Our current study adds to this literature by showing that transient disruption of cue-related signals instructing to maintain or shift attention to the contralateral visual field causes significant spatially selective target discrimination deficits. Our combined fMRI/TMS approach allows higher anatomical resolution than previous EEG/TMS studies and direct manipulation of cortical activity within the same experiment and in a larger group of subjects compared with stroke studies.
Computational implications
Our study supports the existence of separate mechanisms for saliency and shifts of attention/task sets. However, we do not claim a role of mSPL in all shifts of selection. We believe that a winner-take-all or a routing mechanism is still likely to determine shifts of attention within the context of the same task set as when searching for a target in a field of distracters. However, when the task calls not just for a change of location/feature within the same representation but a rerouting of information between representations, then additional control regions maybe be recruited.
For example, using paradigms in which shifts of attention are triggered by highly salient cues stimuli presented outside the current focus of attention (stimulus-driven reorienting of attention), previous studies also observed robust transient activations in more ventral parietal regions [i.e., temporo-parietal junction (TPJ)] (Shulman et al., 2009; Geng and Mangun, 2011; Tosoni et al., 2012). Here, however, we did not observe robust shift-related responses in TPJ, a result that is possibly associated with the use of a cueing paradigm that emphasizes more endogenous components compared with the aforementioned studies. Specially, whereas in the study by Shulman et al., 2009 (see also Geng and Mangun, 2011; Tosoni et al., 2012) shifts of attention were evoked by salient exogenous cues occurring outside the current focus of attention, in the present paradigm colored patches appeared at both locations and the to-be-attended stream was indicated by a specific color, which was shown at the beginning of the experiment.
Along the same line, Shulman et al., 2009 have recently analyzed functional differences between dorsal and ventral frontoparietal areas during attention shifts and found that, whereas TPJ is driven by shifts regardless of cue probability and frequency, more dorsal areas including mSPL seem to track the cumulative probability responding more strongly to infrequent than frequent shifts. This suggests the existence of distinct shifter mechanisms that are differently modulated by exogenous/endogenous components of cueing and that either track or not contingent probability in the environment.
Footnotes
The research leading to these results has received funding from European Community Seventh Framework Programme Grant FP7/2007-2013, Grant Agreement BrainSynch HEALTH-F2-2008-200728. M.C. was supported by National Institute of Mental Health Grant R01 1R01MH096482. P.C. and S.S. were supported by a postdoctoral contract from the G. D'Annunzio University Foundation.
The authors declare no competing financial interests.
References
- Brainard DH. The psychophysics toolbox. Spat Vis. 1997;10:433–436. [PubMed] [Google Scholar]
- Capotosto P, Babiloni C, Romani GL, Corbetta M. Frontoparietal cortex controls spatial attention through modulation of anticipatory alpha rhythms. J Neurosci. 2009;29:5863–5872. doi: 10.1523/JNEUROSCI.0539-09.2009. [DOI] [PMC free article] [PubMed] [Google Scholar]
- Cavanna AE, Trimble MR. The precuneus: a review of its functional anatomy and behavioural correlates. Brain. 2006;129:564–583. doi: 10.1093/brain/awl004. [DOI] [PubMed] [Google Scholar]
- Chiu YC, Yantis S. A domain-independent source of cognitive control for task sets: shifting spatial attention and switching categorization rules. J Neurosci. 2009;29:3930–3938. doi: 10.1523/JNEUROSCI.5737-08.2009. [DOI] [PMC free article] [PubMed] [Google Scholar]
- Corbetta M, Shulman GL. Control of goal-directed and stimulus-driven attention in the brain. Nat Rev Neurosci. 2002;3:201–215. doi: 10.1038/nrn755. [DOI] [PubMed] [Google Scholar]
- Corbetta M, Shulman GL. Spatial neglect and attention networks. Annu Rev Neurosci. 2011;34:569–599. doi: 10.1146/annurev-neuro-061010-113731. [DOI] [PMC free article] [PubMed] [Google Scholar]
- Forman SD, Cohen JD, Fitzgerald M, Eddy WF, Mintun MA, Noll DC. Improved assessment of significant activation in functional magnetic resonance imaging (fMRI): use of a cluster-size threshold. Magn Reson Med. 1995;33:636–647. doi: 10.1002/mrm.1910330508. [DOI] [PubMed] [Google Scholar]
- Geng JJ, Mangun GR. Right temporoparietal junction activation by a salient contextual cue facilitates target discrimination. Neuroimage. 2011;54:594–601. doi: 10.1016/j.neuroimage.2010.08.025. [DOI] [PMC free article] [PubMed] [Google Scholar]
- Greenberg AS, Esterman M, Wilson D, Serences JT, Yantis S. Control of spatial and feature-based attention in frontoparietal cortex. J Neurosci. 2010;30:14330–14339. doi: 10.1523/JNEUROSCI.4248-09.2010. [DOI] [PMC free article] [PubMed] [Google Scholar]
- Hecaen H, De Ajuriaguerra J. Balint's syndrome (psychic paralysis of visual fixation) and its minor forms. Brain. 1954;77:373–400. doi: 10.1093/brain/77.3.373. [DOI] [PubMed] [Google Scholar]
- Itti L, Koch C. Computational modelling of visual attention. Nat Rev Neurosci. 2001;2:194–203. doi: 10.1038/35058500. [DOI] [PubMed] [Google Scholar]
- Kastner S, Ungerleider LG. Mechanisms of visual attention in the human cortex. Annu Rev Neurosci. 2000;23:315–341. doi: 10.1146/annurev.neuro.23.1.315. [DOI] [PubMed] [Google Scholar]
- Koch C, Ullman S. Shifts in selective visual attention: towards the underlying neural circuitry. Hum Neurobiol. 1985;4:219–227. [PubMed] [Google Scholar]
- Oldfield RC. The assessment and analysis of handedness: the Edinburgh inventory. Neuropsychologia. 1971;9:97–113. doi: 10.1016/0028-3932(71)90067-4. [DOI] [PubMed] [Google Scholar]
- Ollinger JM, Shulman GL, Corbetta M. Separating processes within a trial in event-related functional MRI. I. The method. Neuroimage. 2001a;13:210–217. doi: 10.1006/nimg.2000.0710. [DOI] [PubMed] [Google Scholar]
- Olshausen BA, Field DJ. Sparse coding of sensory inputs. Curr Opin Neurobiol. 2004;14:481–487. doi: 10.1016/j.conb.2004.07.007. [DOI] [PubMed] [Google Scholar]
- Rossi S, Hallett M, Rossini PM, Pascual-Leone A. Safety, ethical considerations, and application guidelines for the use of transcranial magnetic stimulation in clinical practice and research. Clin Neurophysiol. 2009;120:2008–2039. doi: 10.1016/j.clinph.2009.08.016. [DOI] [PMC free article] [PubMed] [Google Scholar]
- Rossini PM, Barker AT, Berardelli A, Caramia MD, Caruso G, Cracco RQ, Dimitrijeviæ MR, Hallett M, Katayama Y, Lücking CH. Non-invasive electrical and magnetic stimulation of the brain, spinal cord and roots: basic principles and procedures for routine clinical application. Report of an IFCN committee. Electroencephalogr Clin Neurophysiol. 1994;91:79–92. doi: 10.1016/0013-4694(94)90029-9. [DOI] [PubMed] [Google Scholar]
- Shomstein S, Yantis S. Control of attention shifts between vision and audition in human cortex. J Neurosci. 2004;24:10702–10706. doi: 10.1523/JNEUROSCI.2939-04.2004. [DOI] [PMC free article] [PubMed] [Google Scholar]
- Shomstein S, Lee J, Behrmann M. Top-down and bottom-up attentional guidance: investigating the role of the dorsal and ventral parietal cortices. Exp Brain Res. 2010;206:197–208. doi: 10.1007/s00221-010-2326-z. [DOI] [PMC free article] [PubMed] [Google Scholar]
- Shulman GL, Astafiev SV, Franke D, Pope DL, Snyder AZ, McAvoy MP, Corbetta M. Interaction of stimulus-driven reorienting and expectation in ventral and dorsal frontoparietal and basal ganglia-cortical networks. J Neurosci. 2009;29:4392–4407. doi: 10.1523/JNEUROSCI.5609-08.2009. [DOI] [PMC free article] [PubMed] [Google Scholar]
- Silver MA, Kastner S. Topographic maps in human frontal and parietal cortex. Trends Cogn Sci. 2009;13:488–495. doi: 10.1016/j.tics.2009.08.005. [DOI] [PMC free article] [PubMed] [Google Scholar]
- Sylvester CM, Shulman GL, Jack AI, Corbetta M. Asymmetry of anticipatory activity in visual cortex predicts the locus of attention and perception. J Neurosci. 2007;27:14424–14433. doi: 10.1523/JNEUROSCI.3759-07.2007. [DOI] [PMC free article] [PubMed] [Google Scholar]
- Talairach J, Tournoux P. Co-planar stereotaxic atlas of the human brain. New York: Thieme Medical Publishers; 1988. [Google Scholar]
- Tosoni A, Shulman GL, Pope AL, McAvoy MP, Corbetta M. Distinct representations for shifts of spatial attention and changes of reward contingencies in the human brain. Cortex. 2012 doi: 10.1016/j.cortex.2012.03.022. Advance online publication. Retrieved March 5, 2013. [DOI] [PMC free article] [PubMed] [Google Scholar]
- Van Essen DC. A population-average, landmark- and surface-based (PALS) atlas of human cerebral cortex. Neuroimage. 2005;28:635–662. doi: 10.1016/j.neuroimage.2005.06.058. [DOI] [PubMed] [Google Scholar]
- Vandenberghe R, Gillebert CR. Parcellation of parietal cortex: convergence between lesion-symptom mapping and mapping of the intact functioning brain. Behav Brain Res. 2009;199:171–182. doi: 10.1016/j.bbr.2008.12.005. [DOI] [PubMed] [Google Scholar]
- Vandenberghe R, Molenberghs P, Gillebert CR. Spatial attention deficits in humans: the critical role of superior compared to inferior parietal lesions. Neuropsychologia. 2012;50:1092–1103. doi: 10.1016/j.neuropsychologia.2011.12.016. [DOI] [PubMed] [Google Scholar]
- Vesia M, Prime SL, Yan X, Sergio LE, Crawford JD. Specificity of human parietal saccade and reach regions during transcranial magnetic stimulation. J Neurosci. 2010;30:13053–13065. doi: 10.1523/JNEUROSCI.1644-10.2010. [DOI] [PMC free article] [PubMed] [Google Scholar]
- Wandell BA, Dumoulin SO, Brewer AA. Visual field maps in human cortex. Neuron. 2007;56:366–383. doi: 10.1016/j.neuron.2007.10.012. [DOI] [PubMed] [Google Scholar]
- Yantis S, Schwarzbach J, Serences JT, Carlson RL, Steinmetz MA, Pekar JJ, Courtney SM. Transient neural activity in human parietal cortex during spatial attention shifts. Nat Neurosci. 2002;5:995–1002. doi: 10.1038/nn921. [DOI] [PubMed] [Google Scholar]