Abstract
Balanced steady-state free precession (bSSFP) has been proposed as an alternative method to acquire the blood oxygenation level dependent contrast. Particularly, pass-band bSSFP functional magnetic resonance imaging (fMRI) is believed to utilize the T2 sensitivity of bSSFP in a relatively wide and flat off-resonance frequency band of the bSSFP profile. The method has a potential to provide higher signal to noise ratio (SNR) efficiency with reduced imaging artifacts compared to conventional approaches. Previous experimental results suggested that the level of the functional contrast and its characteristics are significantly influenced by the sequence parameters. However, few of these contrast characteristics have been investigated systematically. In this study, a computer simulation was performed to investigate the sources of functional contrast and the influence of scan parameters on the functional contrast to elucidate the contrast characteristics of pass-band bSSFP fMRI. Experiments were performed to validate the simulation results.
Keywords: pass-band bSSFP fMRI, Monte-Carlo simulation, BOLD contrast
I. INTRODUCTION
In functional magnetic resonance imaging (fMRI), blood oxygenation level dependent (BOLD) contrast has been the primary mechanism to measure the hemodynamic changes associated with neuronal activities (Ogawa et al., 1990, 1992; Kwong et al., 1992). Brain activity is accompanied by an increase of blood oxygenation level in the corresponding region, resulting in decreased deoxygenated hemoglobin concentration. The paramagnetic nature of deoxygenated hemoglobin induces a susceptibility difference between vessels and the surrounding tissues. This creates field inhomogeneity around the vessels producing frequency variation and signal dephasing. This dephasing is irreversible if there is significant diffusion effect.
Gradient echo (GRE) imaging has long been used to measure the BOLD contrast due to its sensitivity to T2*. However, GRE has greatest sensitivity to large veins where blood drains from capillaries. In contrast to GRE, spin echo (SE) imaging shows better micro-vascular sensitivity and suppresses the large vein effects (Boxerman et al., 1995). This spatial scale selectivity was one of the major motivations for using SE for fMRI. In addition, SE fMRI is more immune to image distortion and signal dropout than GRE fMRI. However, SE fMRI suffers from low signal to noise ratio (SNR) efficiency and lower BOLD sensitivity (Bandettini et al., 1994).
Balanced steady-state free precession (bSSFP) fMRI offers another alternative with some of the advantages and characteristics of both GRE and SE methods. Balanced SSFP is free from image distortion and signal dropout because it uses short readout duration. It is efficient because it recycles the magnetization (i.e., no gradient crusher), and time of repetition (TR) is much shorter than the conventional SE or GRE sequences. The growing interest in using bSSFP to measure BOLD contrast (Scheffler et al., 2001; Miller et al., 2003, 2006, 2007; Bowen et al., 2005, 2006; Lee et al., 2006, 2007, 2008, 2010; Wu et al., 2007; Zhong et al., 2007; Miller, 2008, in press; Patterson et al., 2009; Lee, 2010; Park et al. 2011) has been motivated by high-resolution fMRI (Miller et al., 2006; Lee et al., 2007) and the desire for whole brain coverage (Lee et al., 2008).
Originally, a bSSFP fMRI method that utilized the rapid signal changes near the dark banding stripes deriving from the large-flip-angle SSFP frequency profile was proposed (Scheffler et al., 2001). Another method, transition-band bSSFP fMRI (or blood oxygenation sensitive steady-state (BOSS) fMRI), employs a small flip angle to maximize sensitivity and detect the sudden phase change in the transition part of the bSSFP profile (Fig. 1b) (Miller et al., 2003). Although these techniques enable high SNR efficiency and high-resolution 3D acquisition (Miller et al., 2006; Lee et al., 2007), they are very sensitive to temporal and spatial frequency shifts such as spatial off-resonance, drifts in the main magnetic field, and physiological fluctuations (Lee et al., 2006; Wu et al., 2007).
Figure 1.
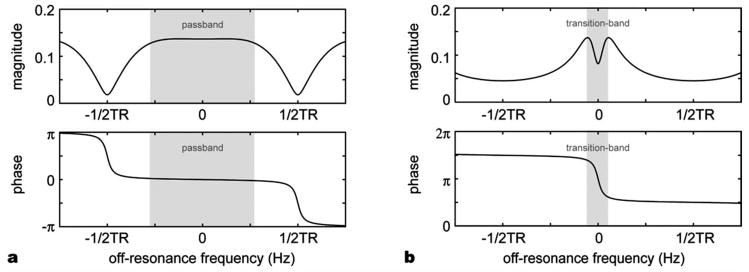
bSSFP signal profile for (a) a large flip angle (25°) with phase-cycling and (b) a small flip angle (5°) with no phase-cycling. Pass-band bSSFP fMRI utilizes the wide flat region in the magnitude profile in (a) whereas transition-band bSSFP fMRI uses the steep phase change in (b).
Recently, another bSSFP fMRI method has been proposed (Bowen et al., 2005). In contrast to the methods that use the transition band of the bSSFP profile to generate the BOLD contrast, this new method is believed to use the T2 sensitivity of bSSFP in the pass-band of the bSSFP profile. Since the contrast is generated in the relatively flat and wide region of the profile, it is much more robust to off-resonance frequency change allowing much greater spatial coverage (Fig. 1a) (Lee et al., 2008). Moreover, since bSSFP possesses SE characteristics (Scheffler and Hennig, 2003), pass-band bSSFP fMRI has been suggested to suppress the sensitivity to BOLD changes from large draining veins in the extravascular space (Bowen et al., 2005). In the previous experimental results, it has been shown that the level of the functional contrast and its characteristics depend significantly on the sequence parameters (Bowen et al., 2005; Zhong et al., 2007). However, few of these pass-band BOLD signal characteristics have been investigated systematically (Miller et al., 2007; Zhong et al., 2007; Patterson et al., 2009).
Boxerman et al. developed a Monte-Carlo model in order to show the MR contrast dependence of GRE and SE images on physiological and experimental parameters (Boxerman et al., 1995). They demonstrated that SE fMRI has greater contrast specificity to capillary-size vessels than GRE. Bieri and Scheffler investigated the influence of inhomogeneous magnetic fields on steady states of bSSFP with their Monte-Carlo simulation of spherical field perturbers (Bieri and Scheffler, 2007). They showed that the signal reduction due to the field variation depends on particle size. Dharmakumar et al. investigated the oxygenation level sensitivity of SSFP signal in micro-vessels (Dharmakumar et al., 2005, 2006). Their analysis showed that the oxygen sensitivity came from intravascular T2 change and frequency shift, and suggested diffusion of extravascular spins in spatial field variations as an additional contrast mechanism.
In this study, we implemented a computer simulation that accounts for both intra- and extravascular contribution of bSSFP BOLD contrast using a modified Luz-Meiboom model (Dharmakumar et al., 2005, 2006) for intravascular space and a Monte-Carlo simulation for extravascular space. We validated our model by measuring the relative signal change in human brains with different TRs and comparing the experimental data with our simulation estimates. We also investigated the dependence of functional contrast on various scan parameters (TR, time of echo (TE), vessel size, flip angle, off-resonance, and field strength) to analyze the characteristics of the functional contrast in pass-band bSSFP fMRI. Additionally, a high resolution study (1 × 1 × 3 mm3 resolution) was performed to demonstrate the vessel size sensitivity.
II. THEORY
A. Monte-Carlo Simulation for Extravascular Contrast
In our Monte-Carlo simulation, we created a model to mimic a vessel network with relevant physiological parameters. This model accounted for the frequency shifts generated by the oxygenation level change and diffusion of extravascular spins in the spatially varying magnetic field. We generated vessel networks with vessels of a certain size as well as vessel compositions of multiple sizes.
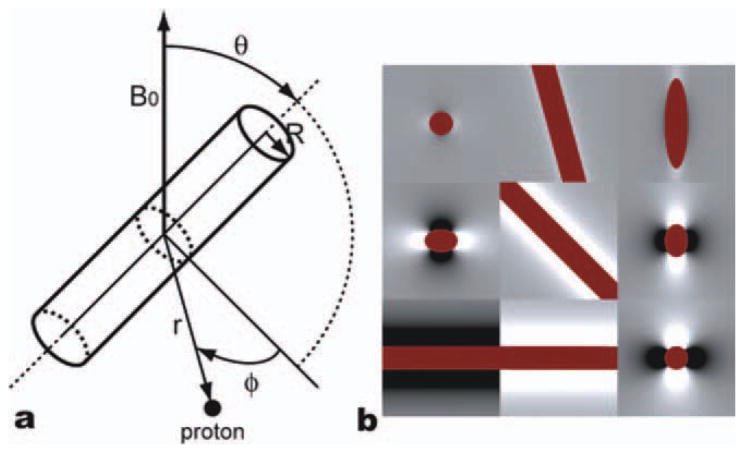
For simulation, a blood vessel was modeled as a cylinder of infinite length whose magnetic susceptibility differs by Hct Δχ B0 (1 − Y) (Boxerman et al., 1995). The infinite-length cylinder approximation simplifies the algebra and is valid as long as the vessel length is much greater than its radius, which is the case in brain tissue. The Hematocrit (Hct) and susceptibility difference (Δχ) were assumed to be 0.4 and 0.27 ppm, respectively (Spees et al., 2001). A cylinder in a strong magnetic field, B0, generates a field perturbation of
where R is the cylinder radius and r is the distance between the spin and the central axis of the cylinder. The cylinder is at an angle θ with respect to the main magnetic field, and the angle between the vector r and the plane specified by the main field B0 and the cylinder axis is ϕ. The vectors and the angles are illustrated in the Figure 2a. Figure 2b shows example field perturbations near a cylinder with three different orientations in three different planes. The blood oxygenation level (Y) was assumed to change from 0.77 (resting state) to 0.85 (activation state) (Silvennoinen et al., 2003).
Figure 2.
(a) Summary of radius vectors and angle notations and (b) the field map generated by a single vessel (dark red) in x-y (left), x-z (middle), and y-z (right) planes with three different orientations (θ = 15° (top), 45° (middle), and 90° (bottom)). [Color figure can be viewed in the online issue, which is available at wileyonlinelibrary.com.]
In order to model a brain vessel network, we assumed a spherical universe large enough to contain the space where spins could diffuse, and to ensure their independence on the vessel locations. The radius of the universe was k1·A + k2·B, where A is the mean free path of protons during the total simulation time, and B is the radius of the largest vessels in the universe. The mean free path of protons is defined as , where D is the diffusion coefficient and Ttot is the total simulation time. In most simulations the weighting factors, k1 and k2, were both set to 100. However, when we simulated vessel size dependencies, k1 and k2 values were set to 20 and 2000, respectively, in order to ensure a sufficient number of vessels in the case of large vessel sizes. The cylinders were generated in random orientations until they filled the specified fraction of the total volume of the universe. The magnetic field at a specific location is calculated by summation of all the field perturbations from all the vessels. Figure 3 shows the field maps generated with two different vessel radii, 3 μm and 25 μm. For small vessels, the field changes more rapidly over space compared with the relatively slowly-varying field map of large vessels.
Figure 3.
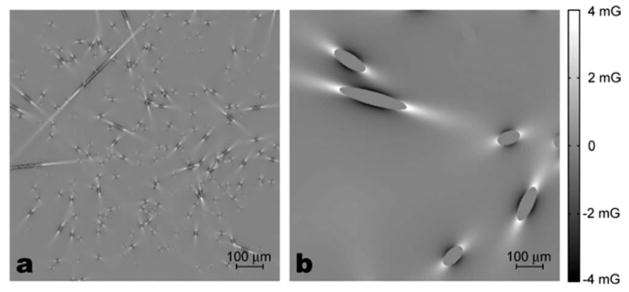
Field perturbations generated by the cylinders of two different radii, (a) 3 μm and (b) 25 μm. The blood volume in both cases is 2%. White is positive high field and black is negative field. In our Monte-Carlo simulation, protons diffuse through these fields and accumulate phase.
Diffusion was simulated by protons performing random walks. A total of 2000 protons, starting at random locations (only in the extravascular space), were generated. Their initial locations were confined to a spherical space, the radius of which was half the radius of the universe. Every proton performed three dimensional random walks with an apparent diffusion coefficient of 1 × 10⁻⁵ cm2/s. If a new location happened to be inside of any cylinder, a new random location was regenerated until the proton landed outside of all the cylinders. In each time step of 0.2 ms, the magnetization of each proton was calculated using the Bloch–Torrey equation (Torrey, 1956) by considering phase accrual caused by the inhomogeneous field, T1 and T2 relaxation, and the phase-cycled radio frequency (RF) pulse applied in every TR for bSSFP. The magnetizations of all the protons were summed to produce a signal for a specific set of parameters. The signal decay was measured after 2.4 s to ensure a steady state and averaged over the last 20 TRs. The relative signal change was calculated from the signals of both active and resting states by the following equation:
The whole simulation was repeated 20 times (total 4 × 10⁴ protons) to measure the relative signal changes between the two states.
In order to investigate the vessel size dependency of bSSFP fMRI contrast, we performed the Monte-Carlo simulation with three different groups of parameter sets. First, the simulation was performed with vascular networks of different vessel sizes and five different TRs (8, 12, 16, 20, 24, and 30 ms). The vessel radii varied from 1 μm to 100 μm (1, 1.4, 2, 3, 4, 6, 8, 10, 15, 20, 25, 40, 60, and 100 μm). Second, various blood fractions from 0.5% to 8% with a 0.5% increment were tested for the capillaries and the venules. Their vessel radii were assumed to be 3 μm and 25 μm, respectively. Finally, composites of capillaries and venules in different proportions were simulated. While the total volume fraction of the cylinders was fixed to 4%, the volume fraction of 3 μm radius cylinders in total blood volume was α (capillary weighting) and that of 25 μm radius cylinders was 1 − α. Twenty-one different α values were simulated from 0 to 1 with an increment of 0.05. Relative signal changes due to flip angle and off-resonance were also estimated to evaluate the robustness of bSSFP fMRI to off-resonance frequency changes. Additionally, the relative signal changes in different TEs and main field strengths (1.5, 3, 4, and 7 T) were simulated. Except for the last two simulations, TE was fixed to TR/2, and the main field was assumed to be 3 T throughout the simulations.
B. Intravascualar Contrast
For the simulation on intravascular functional contrast, we employed a modified Luz-Meiboom model used for bSSFP (Dharmakumar et al., 2005, 2006). In bSSFP, when TR is close to the mean exchange time (tex, 1–10 ms), the RF pulse can refocus some of the diffusion effects, resulting in a reduced T2 sensitivity (Duong et al., 2003). This T2 change can be modeled as 1/T2 = 1/T2o + K(1 − Y)2 (see (Dharmakumar et al., 2006) for the parameters) and Y is the blood oxygenation level. For different TRs, the K values were estimated from (Dharmakumar et al., 2006) by calculating other parameters from the measured values. After calculating the T2 values for the resting and activation states, the intravascular signal was calculated by the bSSFP signal equation (Hargreaves et al., 2001).
The intra- and extravascular contributions were combined by their volume fraction to generate the total BOLD contrast. Two simplified voxels, one representing a gray matter voxel (2% capillary volume with R = 3 μm and 3% venule volume with R = 100 μm) and the other representing a voxel with large veins (20% venous volume with R = 500 μm in addition to 2% capillary and 3% venule volumes) were assumed to compare the signal change levels with the experimental results.
III. MATERIALS AND METHODS
In this study, two sets of experiments were performed. The first set was to validate our model. The percent signal change of activated voxels was measured and it was compared to the theoretical signal change estimated from the computer simulation. Low-resolution imaging (3.75 × 3.75 × 5 mm3) with a standard GE head coil was used. The second set was performed to demonstrate the potential of spatial specificity in the high-resolution pass-band bSSFP fMRI study. To achieve the SNR required for high resolution, a three inch receive-only surface coil was used and the imaging was confined to the occipital lobe of brain.
All the experiments were performed on a 3.0 T EXCITE MRI scanner (GE Healthcare, Milwaukee, WI). The scanner was equipped with a gradient system with 40 mT/m maximum amplitude at 150 mT/m/ms slew rate. Six healthy volunteers were recruited and provided informed written consent approved by the Stanford University Institutional Review Board. All these volunteers participated in the first set of the experiments, and one of them participated in the second set on a different day. Subjects were instructed to avoid any voluntary motion. Pads were used to further restrict subject motion. A circular checkerboard stimulus of 8 Hz contrast-reversing annulus grating was used for the visual stimulation. The protocol started with a 30-s resting period and alternated stimulation and rest states of 30 s each for 3 min. Before the first resting period, dummy cycles were inserted to ensure that the signal had reached steady state. The dummy cycle was 6 s long for the first set and was 12 s long for the second set of the experiments. The subjects were instructed to stare at the center of the visual stimulus focusing on a fixed cross.
A. Low-Resolution fMRI
The pass-band bSSFP sequence used a 3D stack-of-spiral trajectory (field of view (FOV) = 24 × 24 × 10 cm3, resolution = 3.75 × 3.75 × 5 mm3, number of interleaves = 4 and band width (BW) = ±125 kHz). In order to eliminate banding artifacts in the region of interest, shimming was targeted at the occipital lobe of the brain. Four bSSFP fMRI experiments were performed with different TRs (10.0 ms, 12.5 ms, 18.75 ms, and 25.0 ms) while the flip angle was fixed at 25°. The corresponding 3D volume acquisition times were 0.8, 1.0, 1.5 and 2.0 s, respectively. TE was assumed to be the time from the middle of the RF excitation pulse to the middle of the data acquisition, and was set to be a half of TR for all the TRs except 10.0 ms. When TR was 10.0 ms, the readout started immediately after the refocusing gradient of the slab selective excitation pulse because TR was too short to accommodate the spiral readout gradients starting in the middle of TR. A conventional GRE experiment was also performed to specify the activation region. For the GRE acquisition, a 2D spiral sequence (FOV = 24 × 24 cm2, resolution = 3.75 × 3.75 mm2, flip angle = 90°, TR = 3 s, TE = 40 ms, number of interleaves = 1, number of slices = 20, slice thickness = 5 mm, BW = ±125 kHz) was used (Glover and Lee, 1995). For the analysis, FEAT FSL software package was used (Smith et al., 2004). In order to localize the activation area, the GRE data were used to generate an activation mask by selecting the voxels with z-scores higher than 1.57 within the visual cortex. For each pass-band bSSFP fMRI data set, the voxels in the mask whose z-score higher than 1.57 were considered in the relative signal change calculation to compare with the simulation results.
B. High-Resolution fMRI
In the high-resolution fMRI experiment, a 3-inch receive-only surface coil was used. The coil was placed adjacent to the back of the subject’s head with a thin flat pad inserted between the head and the coil. The scan protocol started with a three-plane localization scan and a T2-weighted anatomic scan (fast spin-echo (FSE) sequence, TE/TR = 68 ms/3000 ms, echo train length = 8, FOV = 15 × 15 cm2, in-plane resolution = 1 × 1 mm2, slice thickness = 3 mm). Before functional scans were performed, we acquired a field map and set the center frequency and the shimming gradient values so that the shimmed volume could be located in occipital lobe. A bSSFP image with RF phase cycling (TR = 20 ms and flip angle = 30°) was acquired to ensure no banding stripes in the visual cortex. In order to locate large veins, a MR venogram was generated. T2*-weighted GRE images were acquired using a 3D SPoiled gradient recalled (SPGR) sequence with flow compensation (TE/TR = 17 ms/46 ms, flip angle = 16°, FOV = 15 × 15 cm, resolution = 1 × 1 × 1 mm3, BW = ±41.67 kHz, slab thickness = 30 mm) (Reichenbach, et al., 1997). Both magnitude and phase images were reconstructed from the 3D SPGR data. After field variations due to the static magnetic field inhomogeneity were removed from the phase images, the phase mask filter was applied (Reichenbach et al., 1997). The phase mask filter images were multiplied to the magnitude images several times to improve visibility of the veins (Haacke et al., 2004). The number of multiplications was chosen so that the resulting venogram could show the best conspicuity. Ten venogram images were created by performing minimum intensity projection (mIP) over three consecutive slices which correspond to a 3-mm slice in the other scans. Pass-band bSSFP fMRI scans with three different TRs (10, 15, and 20 ms) were performed with the subject. During the functional scans, the subject was instructed to focus on the mirror that reflects visual stimulation. The same visual stimulation used in the model validation experiment was used. All the bSSFP functional scans used an identical 3D stack-of-spiral trajectory with 20 interleaves (FOV = 15 × 15 cm2, resolution = 1 × 1 × 3 mm3, BW = 125 kHz). The slab thickness was 30 mm, and the flip angle was set to 30°. Analysis was performed using FEAT FSL (Smith et al., 2004). To investigate the high-resolution activation patterns in the visual cortex, activation maps were generated from the pass-band bSSFP fMRI data with a z-score threshold of 1.57. The functional data were aligned with anatomic images and venograms. In order to investigate the change of activation area with TRs, 2000 activated voxels with highest z-scores were selected and compared. Since the functional contrast of pass-band bSSFP fMRI is a function of scan parameters and different TRs used in this study resulted in different SNRs, we used the top 2000 highly activated voxels in each scan to study activation in vessels.
IV. RESULTS
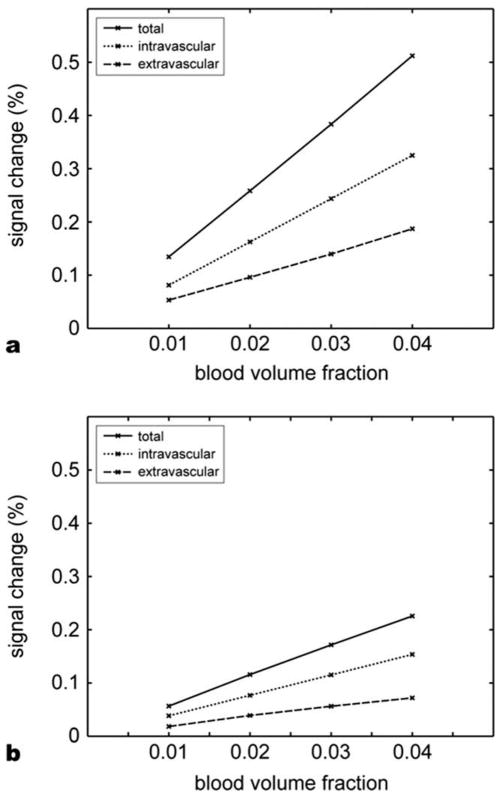
Figure 4 shows intravascular and extravascular contributions in the BOLD contrast from our simulation. The relative signal changes are plotted against the blood volume fraction. The field strength was set to 3 T, TRs were 8 ms (Fig. 4a) and 4 ms (Fig. 4b), and the file angle was 25°. The intravascular contribution was over 60% of the total signal change suggesting that it is a larger fraction of the bSSFP fMRI contrast.
Figure 4.
Relative contribution of intravascular and extravascular space contrasts, (a) TR = 8 ms and (b) TR = 4 ms. The contribution from intravascular space accounts for more than 60% of the total signal change.
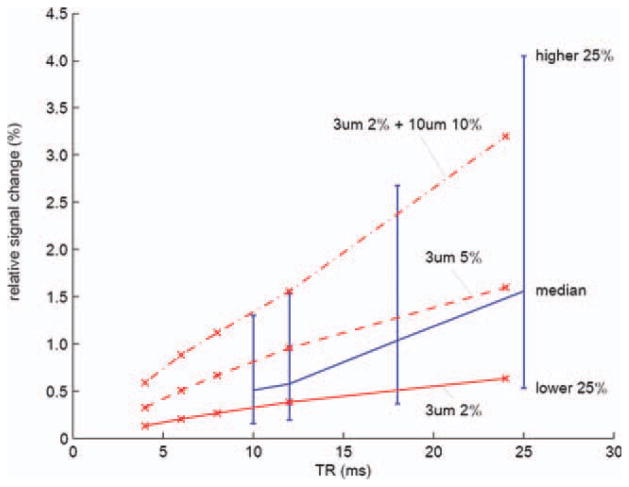
Figure 5 shows the experimental results of the multiple TRs compared with our simulations. Red lines show the simulated functional contrast of three different vessel compositions. The solid red line is from a simulation with 3 μm radius veins of 2% blood volume fraction. The dashed red line shows the result of an increased blood volume fraction (5% with the same 3 μm radius veins). The dot–dash red line represents a voxel with large veins which includes 2% of 3 μm-radius veins and 10% 20 μm radius veins. The blue line is from the experimental results. All the activated voxels in all subjects are shown. The blue line shows the medians in each TR. The upper end of the bar is the relative signal change ranked upper 25% of the activated voxels and the lower end is the lower 25%. Increasing TR results in increased BOLD contrast which agrees with the previous studies (Miller et al., 2007; Zhong et al., 2007). Most of the activated voxels in the experiments have the signal change within the range of our simulation suggesting that our simulation is valid.
Figure 5.
TR vs. relative signal change from simulation (red) and experiment (blue). Red lines show the estimated relative signal changes of three cases: 2% capillary, 5% capillary, and 2% capillary plus 10% large veins. Blue line shows the experimental results. The relative signal changes from all the activated voxels in all six subjects were considered. The medians of the relative signal changes in the activated voxels were plotted. The upper end of a bar represents the signal change of the voxels that marked upper 25% of the relative signal change. The lower end represents lower 25%.[Color figure can be viewed in the online issue, which is available at wileyonlinelibrary.com.]
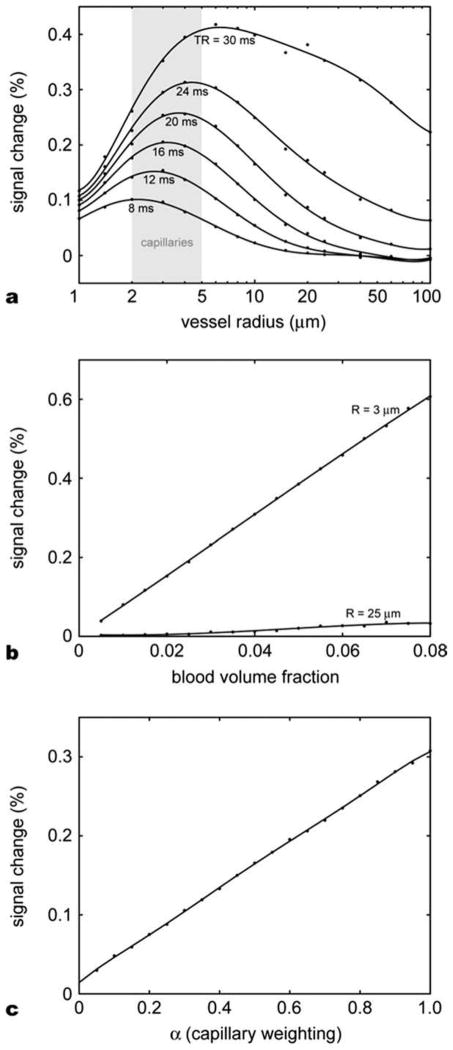
The Monte-Carlo simulation results for the extravascular space are summarized in Figures 6 and 7. Figure 6a shows the relative signal change dependence on various vessel sizes and TRs. The flip angle was fixed at 25°. As expected, the signal change was higher in capillary-size cylinders (5–10 μm diameter) compared to larger cylinders for a TR. This effect was more prominent for a short TR. The overall relative signal change increased approximately linearly with TR with the peaks shifted toward larger size veins. In Figure 6b, the relative signal changes were plotted against blood volume fraction for cylinder radii of 3 μm and 25 μm. The relative signal changes increased linearly with the blood volume fraction. Note that 25 μm cylinders cause less than 0.04% signal change even with the 8% blood volume fraction while 0.6% signal change was observed in the 3 μm cylinder case. Figure 6c shows the relative signal changes in different proportions of cylinders of two radii. Starting from 0.01% signal change at zero α, the signal change reached 0.3% when the radius of all the cylinders was 3 μm. The relative signal change was almost proportional to α. These results suggest that the contribution from capillary-size cylinders dominate the overall extravascular signal change.
Figure 6.
Monte-Carlo simulation results for extravascular space. (a) Relative signal changes as a function of vessel size for different TRs. The signal change peaks in the capillary size vessels for the TRs commonly used in bSSFP imaging. As the TR increases, the curve shifts to the right and the peak signal change increases. (b) Relative signal changes in the function of blood volume fraction for two different vessel radii, 3 μm (capillary) and 25 μm (venule). In the range of blood volume fraction from 0% to 8% the relative signal change is proportional to the blood volume fraction. (c) Relative signal change as a function of capillary weighting α for a vascular model with two different vessel radii, 3 μm (weighted by α) and 25 μm (weighted by 1 − α). The signal contribution of capillary-sized cylinders dominates the overall signal change.
Figure 7.
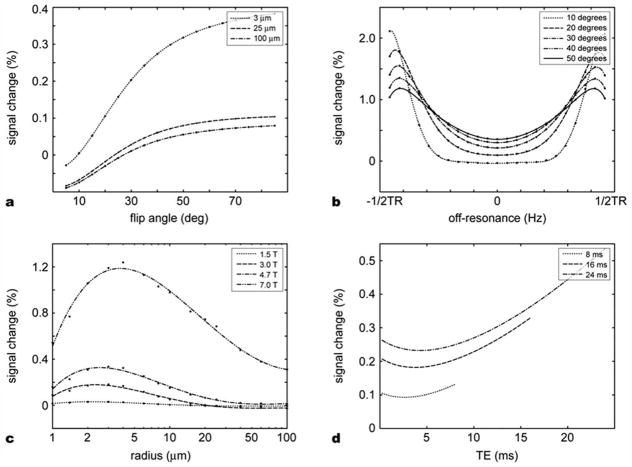
Monte-Carlo simulation results for extravascular space. (a) Relative signal change as a function of flip angle for three different vessel sizes. (b) Off-resonance dependence of relative signal change. The signal change increases as the off-resonance increases. In a large flip angle, the contrast sensitivity to the off-resonance becomes smaller. (c) Main field strength dependence. As field strength increases, the signal change increases; however, the signal change peak does not shift significantly. (d) Relative signal change as a function of TE. The U-shaped curve resulted from the combination of T2* BOLD effect and the refocusing effect of bSSFP. The significant signal change at TE = 0 suggests the contribution of the multiple echo pathways in the bSSFP fMRI contrast.
The RF flip angle also affected the simulated contrast levels as shown in Figure 7a. TR was 12 ms and 3 μm and 25 μm radius cylinders constituted 2% of the total volume, respectively. As the flip angle increased, the relative signal change also increased, which agrees with a previous study (Bowen et al., 2006). In our simulation, the slopes of the curves become flatter after 45° resulting in a smooth plateau. Figure 7b presents the relative signal change due to off-resonance. The relative signal change is the smallest at on-resonance frequency and increases as the off-resonance frequency increases. However even at ±1/(4TR), deviation of signal change is less than 0.5% compared to the case on-resonance. This result demonstrates that the pass-band bSSFP fMRI contrast is less sensitive to off-resonance frequency. Figure 7c reveals the field strength dependence on a range of vessel sizes. Blood volume fraction was set to 2%. TR was set to 12 ms and the flip angle was 25°. As the field strength increased, the relative signal change increased approximately quadratically as expected from a diffusion-like contrast mechanism. However, the cylinder radius at which the signal peaked did not change much and stayed around the capillary size. These results suggest that a high field strength with a short TR would provide a better localized activation in capillaries in pass-band bSSFP fMRI. Figure 7d shows TE dependency. The flip angle was set to 25°. 3 μm and 25 μm radius cylinders occupied 2% of the total volume each. The simulation was performed with three different TRs (8, 16, and 24 ms). The signal change with respect to TE shows a U-shaped curve with the larger values for a longer TE. When TE is approximately equal to TR/2, the signal was refocused by the so-called spin-echo effect of bSSFP (Scheffler and Hennig, 2003) which reduced the contrast change. In addition to this bSSFP refocusing effect, the signal change increases gradually with TE due to T2* effect. The contribution of T2* contrast (GRE fMRI) seems to be more prominent in a longer TR. However, unlike the GRE fMRI case, the contrast at TE = 0 was significant. Since no T2* BOLD effect is expected at TE = 0, the relative signal change is due to stimulated echoes from multiple echo pathways. This result is supported by a previous experiment (Miller et al., 2007).
Figure 8 shows the results of high-resolution bSSFP fMRI for the vessel size sensitivity study. Anatomy images, activation maps, and venograms of two different slices are shown. The activation maps were overlaid on their corresponding bSSFP images. As seen in the images, there was no apparent banding artifact in the occipital lobe of the brain. No activation mask was applied and the z-score threshold was 1.57 (P = 0.05) for the activation maps. Because of the limited FOV of the surface coil, the activation maps are less affected from artifacts from cardiac pulsation or other physiological movements.
Figure 8.
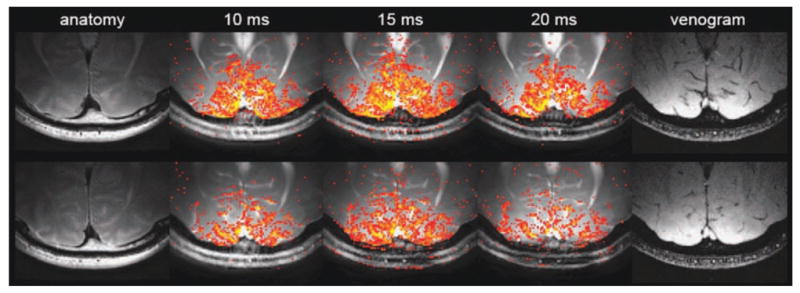
Two different slices in the high-resolution experiment (top and bottom rows). The pass-band bSSFP fMRI activation maps were overlaid on the averaged data. Three different TRs (10 ms, 15 ms, and 20 ms) were used. [Color figure can be viewed in the online issue, which is available at wileyonlinelibrary.com.]
Figure 9 shows the activation map of the 2000 voxels of the highest z-scores. The resulting z-score thresholds for each data (TR = 10, 15, and 20 ms) were 4.21, 5.07, and 4.01, respectively. The right boxes in Figure 9a and the left boxes in Figure 9b show regions with large veins. The activated voxels were better observed near the veins at a longer TR. On the other hand, the left box in Figure 9a and the right box in Figure 9b show regions with no visible veins. In these areas, the activated voxels selected for a short TR were no longer included in a longer TR. This demonstrates that the sensitivity of the signals to vessel size changes with the choice of a TR. It also shows that the highly activated areas have been localized to large draining veins as the TR becomes longer, suggesting that pass-band bSSFP has substantial tissue specificity.
Figure 9.
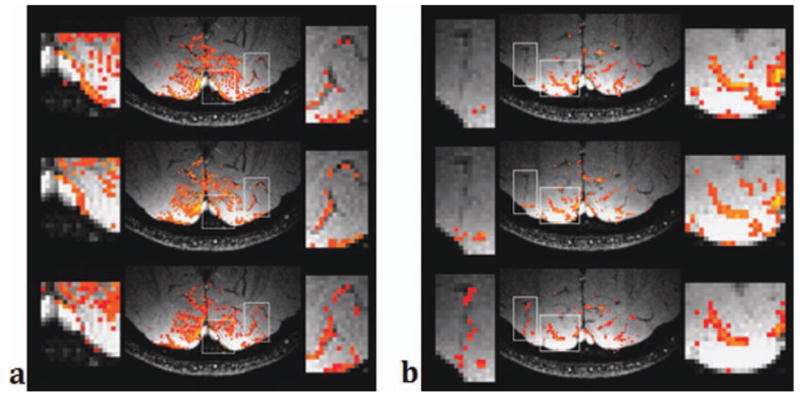
Activation maps overlaid on venograms for two slices (left and right) and for three TRs (top: TR = 10 ms, middle: TR = 15 ms, bottom: TR = 20 ms). Only 2000 voxels with the highest z-scores were selected and shown in the images. The right box in (a) and the left box in (b) show regions with large veins. A longer TR shows more activated voxels on and near the veins. [Color figure can be viewed in the online issue, which is available at wileyonlinelibrary.com.]
Figure 10 compares the activation areas of the pass-band fMRI data with different TRs. The blue-colored voxels represents the ones activated only when TR = 10 ms, and red represents the voxels activated only when TR = 20 ms. The voxels activated with both TRs are in green. Green and red voxels clearly overlap with the veins in the venogram while blue voxels are mostly away from the large veins, confirming that the pass-band bSSFP fMRI contrast has TR dependent vessel size sensitivity.
Figure 10.
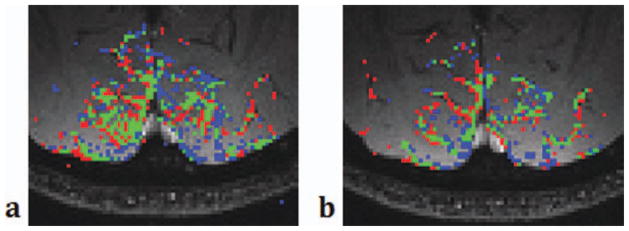
Comparison of the activation maps when TR = 10 ms (left) vs. 20 ms (right). Blue shows the area activated only when TR = 10 ms and red the area activated only when TR = 20 ms. Green shows the area activated in both TRs. Green and red areas appear along the veins identified in the venogram. [Color figure can be viewed in the online issue, which is available at wileyonlinelibrary.com.]
V. DISCUSSION AND CONCLUSION
In this study, we performed computer simulation and experiments to investigate the contrast characteristics of bSSFM fMRI. For computer simulation, we used Monte-Carlo simulation based on spin diffusion effects for the extravascular space contrast and a modified Luz-Meiboom model for bSSFP for the intravascular space contrast. The results showed that bSSFP fMRI is sensitive to both intravascular T2 change and extravascular spin diffusion effect with larger contrast change from the intravascular space. We also demonstrated that the bSSFP fMRI contrast is dependent on TR, TE, flip angle, field strength, tissue vessel composition, and off-resonance frequency. The experimental results confirm that the contrast level depends on a TR. Investigation of the contrast level on the vessel size suggests that at a short TR, bSSFP fMRI may provide a certain functional specificity to capillary size vessels although the overall contribution from large vessels was significant due to the intravascular contrast.
Previous studies suggested that the bSSFP fMRI contrast came from the intravascular T2 change and the frequency shift due to the susceptibility difference between active and resting states. Our simulation confirms that the contribution of spin diffusion contrast in extravascular space is significant in pass-band bSSFP fMRI.
In the extravascular space, each proton experiences different fields caused by the paramagnetic deoxygenated hemoglobin molecules in nearby vessels with different sizes and geometries. If there were no water diffusion, this field inhomogeneity would result in each proton having its own steady state, and the dephasing effect would be refocused by the excitation pulses. However, water molecules continuously move around by diffusion, and this movement causes the loss of phase coherence, which results in additional signal decay. The degree of the phase coherence is related to the mean free path of the water molecule during the time between two consecutive refocusing excitation pulses (i.e., TR in bSSFP). If the mean free path is small compared to the spatial rate of change in the magnetic field, the bSSFP signal will be refocused. Otherwise, the phase change will be irreversible and cause additional signal loss. Interestingly, this effect has a threshold when the mean free path over a TR is in the order of a vessel size. In Figure 5a, the relative signal change is higher in the capillary scale cylinders (4–10 μm diameter) and the signal change is significantly lower in the large vein scale cylinders (over 25 μm diameter). In the capillary regime, the field perturbation produced by the vessels is rapidly changing in space as shown in Figure 3a whereas it is slow in the large vein regime. As a result, at a certain TR, the phase of a proton near a large vein would be refocused after the next excitation pulse because the mean free path is shorter than the spatial field variations. This will result in suppression of the contrast in large vein areas. In Figure 5c, the signal change from capillary dominates when the vessel network is composed of capillary and large vessels. Hence, using a certain TR, we expect to be able to significantly modulate the spatial scale sensitivity of the SSFP signal, and emphasize the signal from the extravascular space associated with capillary. This can potentially improve the ability to localize the source of fMRI signals.
This study improves the understanding of the signal dependence on the scan parameters in pass-band bSSFP fMRI. Our simulation suggests that a longer TR generally increases the signal change by allowing more dephasing before the signal refocuses by RF excitation pulses as in Figures 5a and 7a. However, using a long TR in bSSFP is generally avoided due to banding artifacts, where the signal itself is low and the signal change might be exaggerated as in Figure 6b. If a long TR is used for larger signal change, carefully tuned targeted shimming (Lee et al., 2009) is required. The TR also changes the vessel size selectivity as explained above. The signal change can also be increased by using a larger RF flip angle as shown in Figure 6a. However, the flat part of the bSSFP profile shrinks as the flip angle increases past 25°, and there is also a potential to exaggerate signal change near the off-resonance bandings. In addition, a higher B0 field increases the signal change, and it is interesting to note that the B0 field has only a small effect on the specificity in vessel size as shown in Figure 6c.
Acknowledgments
Grant sponsor: NIH; Grant numbers: R21EB002992, R01EB006471, P41RR009784
References
- Bandettini PA, Wong EC, Jesmanowicz A, Hinks RS, Hyde JS. Spin-echo and gradient-echo EPI of human brain activation using BOLD contrast: A comparative study at 1.5 T. NMR Biomed. 1994;7:12–20. doi: 10.1002/nbm.1940070104. [DOI] [PubMed] [Google Scholar]
- Bieri O, Scheffler K. Effect of diffusion in inhomogeneous magnetic fields on balanced steady-state free precession. NMR Biomed. 2007;20:1–10. doi: 10.1002/nbm.1079. [DOI] [PubMed] [Google Scholar]
- Bowen CV, Mason J, Menon RS, Gati JS. High field balanced-SSFP fMRI: Examining a diffusion contrast mechanism using varied flip-angles. Proceedings of the 14th Annual Meeting of ISMRM; 2006; Seattle, Washington, USA. p. 665. [Google Scholar]
- Bowen CV, Menon RS, Gati JS. High field balanced-SSFP fMRI: A BOLD technique with excellent tissue sensitivity and superior large vessel suppression. Proceedings of the 13th Annual Meeting of ISMRM; 2005; Miami Beach, Florid, USA. p. 119. [Google Scholar]
- Boxerman JL, Bandettini PA, Kwong KK, Baker JR, Davis TL, Rosen BR, Weisskoff RM. The intravascular contribution to fMRI signal change: Monte Carlo modeling and diffusion-weighted studies in vivo. Magn Reson Med. 1995;34:4–10. doi: 10.1002/mrm.1910340103. [DOI] [PubMed] [Google Scholar]
- Dharmakumar R, Hong J, Brittain JH, Plewes DB, Wright GA. Oxygen-sensitive contrast in blood for steady-state free precession imaging. Magn Reson Med. 2005;53:574–583. doi: 10.1002/mrm.20393. [DOI] [PubMed] [Google Scholar]
- Dharmakumar R, Qi X, Hong J, Wright GA. Detecting microcirculatory changes in blood oxygen state with steady-state free precession imaging. Magn Reson Med. 2006;55:1372–1380. doi: 10.1002/mrm.20911. [DOI] [PubMed] [Google Scholar]
- Duong TQ, Yacoub E, Adriany G, Hu X, Uurbil K, Kim SG. Microvascular BOLD contribution at 4 and 7 T in the human brain: Gradient-echo and spin-echo fMRI with suppression of blood effects. Magn Reson Med. 2003;49:1019–1027. doi: 10.1002/mrm.10472. [DOI] [PubMed] [Google Scholar]
- Glover GH, Lee AT. Motion artifacts in fMRI: comparison of 2DFT with PR and spiral scan methods. Magn Reson Med. 1995;33:624–635. doi: 10.1002/mrm.1910330507. [DOI] [PubMed] [Google Scholar]
- Haacke EM, Xu Y, Cheng YC, Reichenbach JR. Susceptibility weighted imaging (SWI) Magn Reson Med. 2004;52:612–618. doi: 10.1002/mrm.20198. [DOI] [PubMed] [Google Scholar]
- Hargreaves BA, Vasanawala SS, Pauly JM, Nishimura DG. Characterization and reduction of the transient response in steady-state MR imaging. Magn Reson Med. 2001;46:149–158. doi: 10.1002/mrm.1170. [DOI] [PubMed] [Google Scholar]
- Kwong KK, Belliveau JW, Chesler DA, Goldberg IE, Weisskoff RM, Poncelet BP, Kennedy DN, Hoppel BE, Cohen MS, Turner R. Dynamic magnetic resonance imaging of human brain activity during primary sensory stimulation. Proc Natl Acad Sci USA. 1992;89:5675–5679. doi: 10.1073/pnas.89.12.5675. [DOI] [PMC free article] [PubMed] [Google Scholar]
- Lee J, Lustig M, Kim D, Pauly JM. Improved shim method based on the minimization of the maximum off-resonance frequency for balanced steady-state free precession (bSSFP) Magn Reson Med. 2009;61:1500–1506. doi: 10.1002/mrm.21800. [DOI] [PMC free article] [PubMed] [Google Scholar]
- Lee J, Santos JM, Conolly SM, Miller KL, Hargreaves BA, Pauly JM. Respiration-induced B0 field fluctuation compensation in balanced SSFP: Real-time approach for transition-band SSFP fMRI. Magn Reson Med. 2006;55:1197–1201. doi: 10.1002/mrm.20879. [DOI] [PubMed] [Google Scholar]
- Lee J, Shahram M, Schwartzman A, Pauly JM. Complex data analysis in high-resolution SSFP fMRI. Magn Reson Med. 2007;57:905–917. doi: 10.1002/mrm.21195. [DOI] [PubMed] [Google Scholar]
- Lee JH. Balanced steady state free precession fMRI. Int J Imag Syst Tech. 2010;20:23–30. [Google Scholar]
- Lee JH, Dumoulin SO, Saritus EU, Glover GH, Wandell BA, Nishimura DG, Pauly JM. Full-brain coverage and high-resolution imaging capabilities of passband SSFP fMRI at 3 T. Magn Reson Med. 2008;59:1099–1110. doi: 10.1002/mrm.21576. [DOI] [PMC free article] [PubMed] [Google Scholar]
- Lee JH, Durand R, Gradinaru V, Zhang F, Goshen I, Kim DS, Fenno LE, Ramakrishnan C, Deisseroth K. Global and local fMRI signals driven by neurons defined optogenetically by type and wiring. Nature. 2010;465:788–792. doi: 10.1038/nature09108. [DOI] [PMC free article] [PubMed] [Google Scholar]
- Miller KL. Modeling SSFP functional MRI contrast in the brain. Magn Reson Med. 2008;60:661–673. doi: 10.1002/mrm.21690. [DOI] [PubMed] [Google Scholar]
- Miller KL. FMRI using balanced steady-state free precession (SSFP) doi: 10.1016/j.neuroimage.2011.10.040. doi: http://dx.doi.org/10.1016/j.neuroimage.2011.10.040. [DOI] [PMC free article] [PubMed]
- Miller KL, Hargreaves BA, Lee J, Ress D, de Charms CR, Pauly JM. Functional brain imaging using a blood oxygenation sensitive steady state. Magn Reson Med. 2003;50:675–683. doi: 10.1002/mrm.10602. [DOI] [PubMed] [Google Scholar]
- Miller KL, Smith SM, Jezzard P, Pauly JM. High-resolution FMRI at 1.5 T using balanced SSFP. Magn Reson Med. 2006;55:161–170. doi: 10.1002/mrm.20753. [DOI] [PubMed] [Google Scholar]
- Miller KL, Smith SM, Jezzard P, Wiggins GC, Wiggins CJ. Signal and noise characterics of SSFP FMRI: A comparison with GRE at multiple field strengths. NeuroImage. 2007;37:1227–1236. doi: 10.1016/j.neuroimage.2007.06.024. [DOI] [PubMed] [Google Scholar]
- Ogawa S, Lee TM, Kay AR, Tank DW. Brain magnetic resonance imaging with contrast dependent on blood oxygenation. Proc Natl Acad Sci USA. 1990;87:9868–9872. doi: 10.1073/pnas.87.24.9868. [DOI] [PMC free article] [PubMed] [Google Scholar]
- Ogawa S, Tank DW, Menon R, Ellermann JM, Kim S, Merkle H, Ugurbil K. Intrinsic signal changes accompanying sensory stimulation: Functional brain mapping with magnetic resonance imaging. Proc Natl Acad Sci USA. 1992;89:5951–5955. doi: 10.1073/pnas.89.13.5951. [DOI] [PMC free article] [PubMed] [Google Scholar]
- Park SH, Kim T, Wang P, Kim SG. Sensitivity and specificity of high-resolution balanced steady-state free precession fMRI at high field of 9.4 T. Neuroimage. 2011;58:168–176. doi: 10.1016/j.neuroimage.2011.06.010. [DOI] [PMC free article] [PubMed] [Google Scholar]
- Patterson S, Beyea SD, Bowen CV. Monte Carlo simulations of phase cycled pbSSFP fMRI acquisitions. Proceedings of the 17th Annual Meeting of ISMRM; 2009; Honolulu, Hawaii, USA. p. 1554. [Google Scholar]
- Reichenbach JR, Venkatesan R, Schillinger DJ, Kido DK, Haacke EM. Small vessels in the human brain: MR venography with deoxyhemoglobin as an intrinsic contrast agent. Radiology. 1997;204:272–277. doi: 10.1148/radiology.204.1.9205259. [DOI] [PubMed] [Google Scholar]
- Scheffler K, Hennig J. Is TrueFISP a gradient-echo or a spin-echo sequence? Magn Reson Med. 2003;49:395–397. doi: 10.1002/mrm.10351. [DOI] [PubMed] [Google Scholar]
- Scheffler K, Seifritz E, Bilecen D, Venkatesan R, Hennig J, Deimling M, Haacke EM. Detection of BOLD changes by means of a frequency-sensitive trueFISP technique: preliminary results. NMR Biomed. 2001;14:490–496. doi: 10.1002/nbm.726. [DOI] [PubMed] [Google Scholar]
- Silvennoinen MJ, Clingman CS, Golay X, Kauppinen RA, van Zijl PCM. Comparison of the dependence of blood R2 and R2* on oxygen saturation at 1.5 and 4.7 Tesla. Magn Reson Med. 2003;49:47–60. doi: 10.1002/mrm.10355. [DOI] [PubMed] [Google Scholar]
- Smith SM, Jenkinson M, Woolrich MW, Beckmann CF, Behrens TE, Johansen-Berg H, Bannister PR, De Luca M, Drobnjak I, Flitney DE. Advances in functional and structural MR image analysis and implementation as FSL. NeuroImage. 2004;23:S208–S219. doi: 10.1016/j.neuroimage.2004.07.051. [DOI] [PubMed] [Google Scholar]
- Spees WM, Yablonskiy DA, Oswood MC, Ackerman JJH. Water proton MR properties of human blood at 1. 5 tesla: Magnetic susceptibility, T1, T2, T2*, and non-lorentzian signal behavior. Magn Reson Med. 2001;45:533–542. doi: 10.1002/mrm.1072. [DOI] [PubMed] [Google Scholar]
- Torrey HC. Bloch equations with diffusion terms. Phys Rev. 1956;104:563–565. [Google Scholar]
- Wu ML, Wu PH, Huang TY, Shih YY, Chou MC, Liu HS, Chung HW, Chen CY. Frequency stabilization using infinite impulse response filtering for SSFP fMRI at 3T. Magn Reson Med. 2007;57:369–379. doi: 10.1002/mrm.21138. [DOI] [PubMed] [Google Scholar]
- Zhong K, Leupold J, Hennig J, Speck O. Systematic investigation of balanced steady-state free precession for functional MRI in the human visual cortex at 3 Tesla. Magn Reson Med. 2007;57:67–73. doi: 10.1002/mrm.21103. [DOI] [PubMed] [Google Scholar]


