

Abstract
Objective
Gene expression studies in peripheral tissues from patients with neurodegenerative disorders can provide insights into disease pathogenesis, and identify potential biomarkers, an important goal of translational research in neurodegeneration. Friedreich’s Ataxia (FRDA) is a chronic neurodegenerative disease caused by reduced transcription of frataxin, a ubiquitously expressed protein. We studied in vitro lymphocytes from FRDA patients and carriers, in order to identify a peripheral gene expression phenotype. Peripheral biomarkers related to disease status would be extremely valuable for assessing drug efficacy and could provide new pathophysiological insights.
Methods
We characterized the gene expression profiles in peripheral blood mononuclear cells (PBMCs) from FRDA patients, compared with controls and related carriers. Cells were studied both before and after in vitro treatment with compounds that increase frataxin levels. Quantitative real-time PCR and additional microarrays were used to confirm a core set of genes in multiple independent series.
Results
We identified a subset of genes changed in cells from patients with pathological frataxin deficiency and a core set of these genes were confirmed in independent series. Changes in gene expression were related to the mitochondria, lipid metabolism, cell cycle, and DNA repair, consistent with FRDA’s known pathophysiology. We evaluated the in vitro effect of multiple compounds (HDAC inhibitors) on this putative biomarker set, and found that this biochemical phenotype was ameliorated in accordance with drug efficacy.
Interpretation
Frataxin downregulation is associated with robust changes in gene expression in PBMCs, providing pathogenetic insights and a core subset of genes which, if verified in vivo, could be used as a peripheral biomarker.
Keywords: Biomarker, Gene expression, Friedreich’s ataxia, Therapy
INTRODUCTION
Friedreich’s ataxia (FRDA), the most common inherited ataxia, is a relentlessly progressive neurodegenerative disease1, caused in most cases by a homozygous GAA expansion within the first intron of the FXN gene2 resulting in reduced frataxin transcription, as well as the induction of a heterochromatin-like state with decreased histone acetylation at the FRDA locus3-5. Heterozygous GAA expansion carriers express slightly more than 50% of normal frataxin and manifest no clinical symptoms, suggesting that therapeutic approaches aimed at increasing frataxin levels (even if only to those of carriers) may be effective. Indeed, a number of promising therapeutic strategies in this direction have been proposed in recent years3,6-9. In particular, novel HDACi-derivative compounds increase histone acetylation at the FRDA locus and frataxin levels, and partially reverse the molecular changes associated with frataxin deficiency in animal models10,11, therefore constituting appealing therapeutic candidates in FRDA.
However, as is the case for other chronic neurodegenerative disorders, it is challenging to monitor short-term disease progression in FRDA patients using clinical measures, hindering assessment of therapeutic effects in clinical trials. Thus, the identification of disease-related biomarkers that reflect the underlying pathophysiology and respond to potential treatments is a major goal of translational research in neurodegeneration. A number of compounds currently in the FRDA research pipeline (http://www.curefa.org/pipeline.html) are aimed at correcting a number of pathogenetic aspects which are likely to be downstream of frataxin deficiency, including: 1) mitigating the effects of oxidative stress, 2) increasing the mitochondrial metabolism, 3) decreasing iron toxicity, 4) modifying neurotransmission, and 5) improving iron-sulfur cluster assembly. So while frataxin levels will be a useful biomarker for drugs aimed at increasing frataxin levels, none of the currently existing biomarkers (including frataxin levels) will detect a biochemical effect of these other therapeutic strategies.
In vitro and in vivo studies on models of frataxin deficiency10,12-15, as well as in FRDA patients16,17, have shown that frataxin deficiency is associated with a complex gene expression phenotype, involving multiple pathways, likely including the ones ultimately responsible for the clinical phenotype. Therefore, a composite biomarker of gene expression i) detectable in easily accessible peripheral tissues, ii) including multiple gene expression changes likely at different stages along the pathogenetic process in FRDA, and iii) responsive to pharmacological treatments, would widen the assessment in disease follow-up and increase the sensitivity for drug activity.
Here, we characterize the gene expression profile of peripheral blood mononuclear cells (PBMCs) from FRDA patients and compare it to that of related heterozygous GAA-expansion carriers and normal controls. We identify and verify a molecular signature specifically associated with FRDA and identify consistent molecular changes in multiple independent datasets. Finally, we evaluate the extent to which HDACi treatment in vitro affects the biochemical phenotype associated with frataxin deficiency.
SUBJECTS AND METHODS
Subjects
Thirty patients, 20 related carriers, and 21 unrelated controls were enrolled in phase one of the study after signing informed consent. Subject clinical and demographic characteristics are reported in Tables S1 and S5. A confirmation series was enrolled at the Children’s Hospital of Philadelphia (CHOP) and included 34 patients and 17 carriers (Table S6).
Cell culture and RNA extraction
Peripheral blood was collected in 4 ml Vacutainer tubes. PBMCs were extracted using the Ficoll-Paque Plus kit (Amersham Biosciences) and incubated in RPMI (15% FBS, Pen/Strep/Fung., and 1x HEPES) overnight. Total RNA was extracted 1) before and after a 48-hour incubation with HDACi or DMSO using the Qiagen Minelute kit (Qiagen, Valencia CA) in the discovery series, and 2) from total blood collected in Paxgene tubes in the confirmation series. Lymphoblastoid cell lines (4L series) were obtained from Coriell Repositories (Camden NJ, USA). Cell lines #15850,16209,16216,16220 (patients) and #15847,15851,16215,16218 (controls) were used.
Compounds
Three HDACi were used: 1) Compound 106 (N1-(2-aminophenyl)-N7-p-tolylheptanediamide); 2) Compound 4b (N1-(2-aminophenyl)-N7-phenylheptanediamide); and 3) Compound 9b (N1-(2-Methoxyphenyl)-N7-phenylheptanediamide) (Herman et al., 2006). Concentration was 10 μM in DMSO. A subset of samples was treated with 1,5, 10, 50, and 100 μM to perform a dose-response analysis. Control samples received no treatment (‘empty’) or vehicle alone (DMSO).
Microarray experiments
Total RNA was extracted from PBMCs from FRDA patients, related carriers, and controls, before and after treatment with 3 HDACi compounds and DMSO alone (vehicle). Microarray analysis methods are described in Supplementary Material.
Real-time quantitative PCR experiments were performed as described previously13 and in Supplementary Material.
RESULTS
Frataxin deficiency is associated with robust gene expression changes in FRDA patients and carriers
We first studied the effects of frataxin deficiency in PBMCs from 10 FRDA patients, 10 related heterozygous carriers, and 11 unrelated controls (Figure 1, Table S1). All patients had clinically evident FRDA, and all but one were homozygous for pathological GAA expansions in the FXN gene. Carriers were related to patients (parents in all cases except one), and controls were clinically normal unrelated blood donors. We extracted total PBMC RNA and assessed global gene expression patterns using microarrays, by comparing PBMCs from both FRDA and carriers to controls (Figure 1). Using a stringent statistical threshold (false discovery rate (FDR) of 5%), 1,283 probes were differentially expressed (DE) between FRDA and controls (FRDA set, Figure 2A, Table S2).
Figure 1. Study design.

Peripheral blood was extracted from 10 FRDA patients, 10 related heterozygous carriers, and 11 unrelated controls, for a total of 31 individuals. PBMCs were extracted and cultured for 48 hours. After RNA extraction, total RNA was amplified, labeled and hybridized on Illumina Human RefSeq-8 microarrays, querying the expression of >22,000 RefSeq-curated transcripts. Data analysis aimed at comparing FRDA patients vs. normal controls and vs. related carriers.
Figure 2. Transcriptional changes associated with frataxin deficiency.

(A) Barplot representing the number of downregulated (green) and upregulated (red) genes in two comparisons: FRDA vs. controls, and Carriers vs. controls (complete gene lists are in Tables S2 and S3). (B) Venn diagram representing the number of genes shared between the two comparisons. 590 genes are DE in both FRDA and carriers vs. controls, all of them changing in the same direction. (C) Overrepresented gene ontology (GO) categories among DE genes in FRDA vs. controls (in green the proportion of downregulated DE genes; in red the proportion of upregulated) sorted by −Log10 (p-value). A −Log (p-value) of 1.3 corresponds to an overrepresentation p-value of 0.05. Gene Ontology list is in Table S4. (D) Heatmap depicting fold changes of FRDA patients compared to related carriers (pairs). 77 probes are differentially expressed (p<0.005 Bayesian t-test). Upregulated genes are shown in red and downregulated genes in green; color intensity corresponds to fold-change in expression (probes are listed in Table 1). (E) Overrepresented gene ontology (GO) categories among DE genes in FRDA vs. related carriers (in green the proportion of downregulated DE genes; in red the proportion of upregulated).
We observed an overrepresentation of downregulated probes, confirming previous data in animal models12-14 and human data17 supporting the concept that frataxin deficiency induces a prevalent downregulation of gene expression. Surprisingly, heterozygous FRDA mutation carriers, all of whom were clinically asymptomatic, presented with substantial gene expression changes (784 DE probes, Table S3). Most of these (75%) were also differentially regulated in the same direction – but with larger changes – in FRDA patients when compared to normal controls (overlap significant p<1e-124, Figure 2B). The presence of a biochemical phenotype in heterozygous FRDA mutation carriers supports the hypothesis that the frataxin deficiency observed in the carriers is sufficient to induce global gene expression changes, although it is not accompanied by a detectable clinical phenotype. This is consistent with data from animal models with no or mild clinical symptoms, and with mild (30-50%) frataxin deficiency, who still show a robust gene expression phenotype10, 12, 13.
Gene ontology (GO) analysis of the DE genes in FRDA vs. controls showed an overrepresentation of genes involved in regulation of cell cycle, cell death, and mitochondrial localization among the top GO categories (Figure 2C, Table S4). The top down-regulated pathway by Ingenuity pathway analysis was related to cell cycle and DNA repair (Figure S1), confirming recent findings in human lymphocytes that implicate DNA repair pathways in FRDA pathophysiology17, 18. Importantly, among the most differentially expressed genes in FRDA patients was APTX, which when mutated causes ataxia with oculomotor apraxia 1. The decrease in APTX observed in FRDA patients is linearly related to the decrease in frataxin expression in peripheral blood of FRDA patients and carriers, providing the first molecular link between these clinically similar disorders. Aprataxin is necessary for single and multi-strand DNA repair, which protects DNA from the cumulative affects of oxidative damage19. The relationship between frataxin and aprataxin provides a potential direct mechanism for the observed DNA damage in both of these disorders involving ataxia.
Biomarker discovery
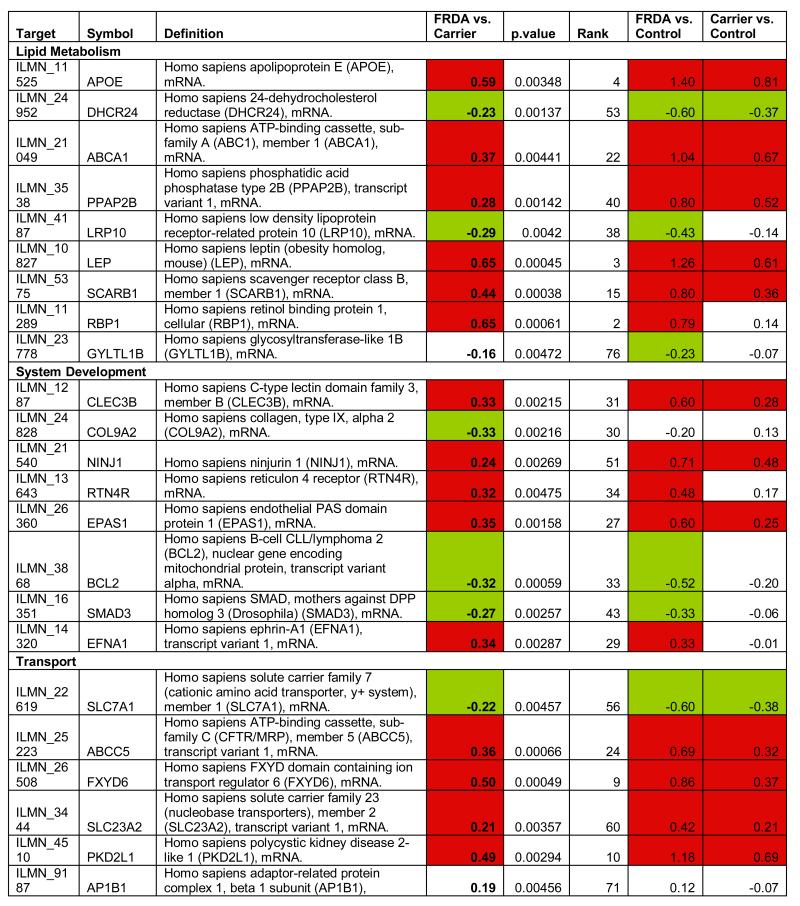
To identify the subset of key genes responsible for the clinical phenotype in FRDA patients, we compared expression profiles from patients with those from their related carriers (paired analysis, see Supplementary Methods). Seventy-seven probes, corresponding to 76 unique genes, were differentially expressed after this stringent analysis (P77 set, Figure 2D, Table 1). The P77 set reflected disease status, not age, disease duration, or GAA expansion size (Supplementary Material). GO analysis of P77 revealed over-representation of genes involved in lipid metabolic processing (mostly upregulated) and significant upregulation of genes involved in sulfur metabolic processes (Figure 2E).
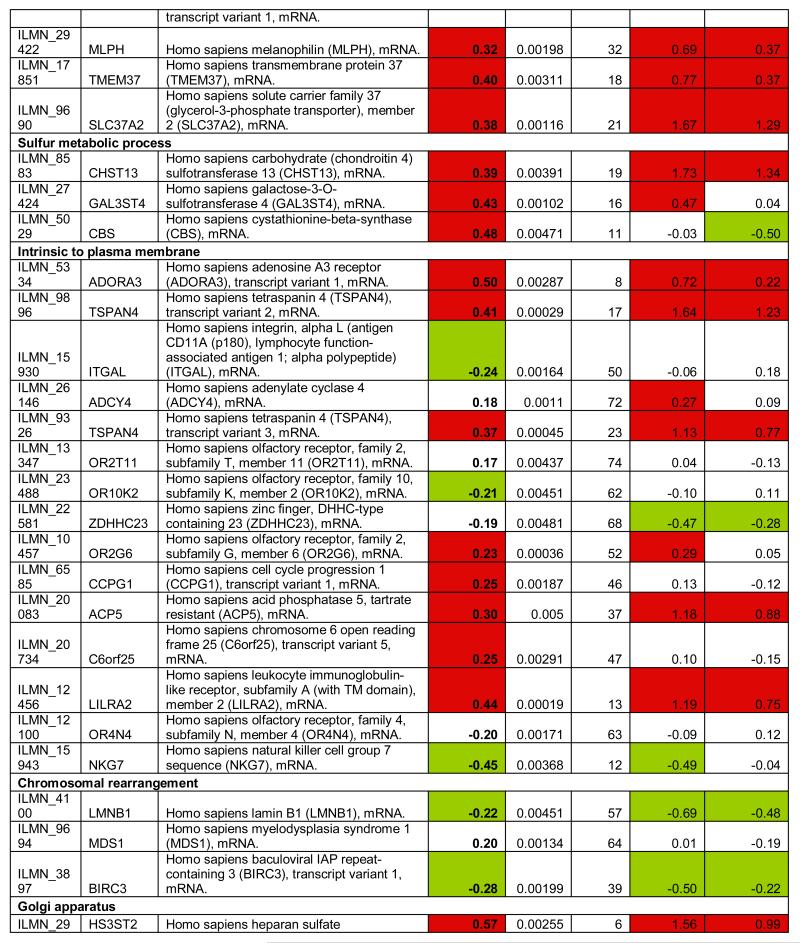
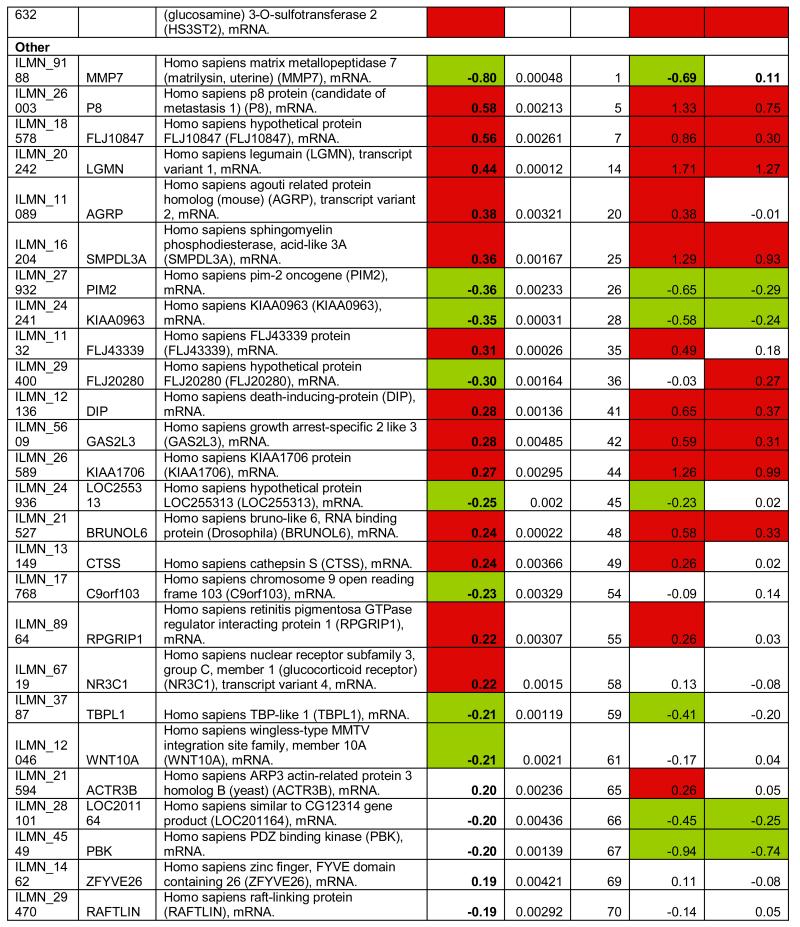
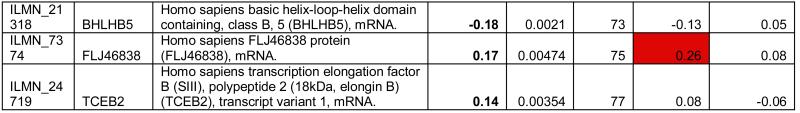
Table 1.
Differentially expressed probes (n=77) significant at p<0.005 (Bayesian t-test) after paired comparison of FRDA (n=10) vs. related carriers (n=10). Target: Illumina probe name; Symbol: Gene Symbol; Definition: Gene definition; FRDA vs. Carrier: (FRDA vs. related carriers, paired analysis); p-value: p-value at the Bayesian t-test); FRDA vs. Control: Corresponding log2 fold change in FRDA vs. Controls; FRDA vs. Carrier: Corresponding log2 fold change in Carriers vs. Controls.
|
|
|
|
To refine and independently validate this biomarker set, we selected 19 genes (putative biomarker set, pBS) after ranking P77 by magnitude of change and selecting the top 18, and adding one additional gene previously identified to be downregulated in FRDA mouse models and in patients’ cells (PGC1A12, Table 1). We tested pBS by real-time quantitative PCR (qPCR, Methods) in two independent series: 1) 4 lymphoblastoid cell lines (4L series), and 2) PBMCs from 10 patient/carrier pairs from an Italian cohort (10I series, Table S5).
Fourteen of the 19 genes tested in the 4L series changed in the same direction as predicted by pBS, a 74% confirmation rate (Figure 3). We were only able to assess 12 of the 19 genes in the 10I series, due to limited RNA availability. Six (50%) of the 12 tested were confirmed by qPCR in this independent series. To further refine this biomarker list to the most generalizable of these genes, we obtained another entirely independent data set from North America and Belgium including 10 patients and 10 related carriers (10B series, Table S5). We were able to test only 7 genes due to limited amount of RNA, and 3 (47%) were confirmed (Figure 3). In conclusion, 7 pBS-derived genes (AGRP, CBS, HS3ST2, TMEM37, PGC1A, FXYD6, and P8), were confirmed in independent lymphoblastoid cell lines and at least one additional patient series, and constitute a core biomarker set. In addition, 6 more genes (LGMN, LILRA2, SCARB1, TSPAN4, PKD2L1, LEP) were confirmed in lymphoblasts only. This latter, additional set of promising targets requires confirmation in larger patient series.
Figure 3. Real-time PCR confirmation of the putative biomarker set.
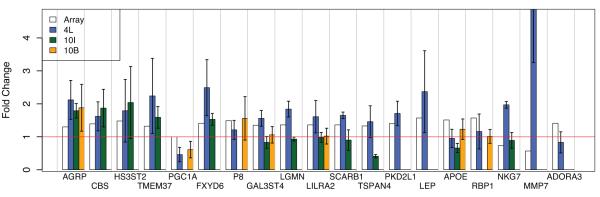
Barplot representing the gene expression fold changes (absolute ratios) of 19 genes selected for confirmation, in 3 independent datasets (see Text): 4L (blue bars), 10I (green bars), and 10B (orange bars). The fold change detected by the array is represented for reference with white bars. Error bars: standard error of the mean. The red line is marking a fold change = 1 (i.e. no change).
To further address the generalizability of this approach, we prospectively analyzed whole blood-derived mRNA from another group of 34 FRDA patients and 17 carriers (CHOP series, Table S6). This microarray dataset is different from the first presented in this report in several respects: 1) it examined RNA from whole blood (vs. cultured PBMC), 2) it used a different array platform 3) most of the carriers are unrelated to patients (whereas they were all related in the first set). We used the 67 probes overlapping between the 2 platforms in order to cluster the CHOP series (Figure 4A). The two resulting branches correctly classify 94% (32/34) of the patients and 10/17 (59%) of the carriers, corresponding to an overall accuracy of 82%. On average, 56% (range: 42-69%) of the 67 genes changed in the CHOP dataset consistently with the original pBS, further supporting the validity of this biomarker set (Figure 4B).
Figure 4. Biomarker validation on an independent series.

(A) Clustering of 51 samples (34 FRDA patients, 17 carriers) based on the 67 probes that are overlapping with the P77 set. The two main branches classify samples with an overall 82% accuracy. Samples (Table S6) are color coded by diagnosis (dark blue: FRDA, light blue: carrier), family (subjects from the same family have the same color, except gray=no family members enrolled), gender (pink: women, blue: men), array batch (arrays from the same batch have the same color), and age category (red: >25, green: <25 years old). (B) Heatmap representing the gene expression changes in the 67 probes that are overlapping with the P77 set. Genes and samples are clustered by similarity. Red denotes upregulation and green downregulation when comparing patients vs. carriers. Fold changes in the original 10 patient/carrier pairs are reported for reference (top color code: blue). Sample numbering is as in Table S6. 42% (in patient #32) to 69% (in patient #26) of the 67 probes show a change similar to the original biomarker set.
Treatment with HDACi ameliorates the biochemical phenotype associated with FRDA in vitro
HDACi are promising compounds that are able to raise frataxin levels in vitro and in vivo3,11. To assess the specific effects of HDACi on the biochemical phenotype associated with frataxin deficiency, we studied the effect of treatment with two compounds showing HDACi activity (c4b, and c106 at 10 μM and a third compound (c9b) from the same family, but that is inert as an HDACi) on the P77 set (Methods and20). We observed that up to 80% of the probes showed a change towards normal levels, after HDACi treatment (Figure 5A-B). The effect paralleled drug efficacy in raising frataxin levels3, with c106 showing the largest effect (Figure 5B).
Figure 5. Drug effect on frataxin levels and FRDA signature.

(A) Heatmap representing the gene expression changes in the P77 probes in 10 patient/carrier pairs (top color code: purple) and the changes induced in these same genes by treatment with compound 106 (top color code: cyan). Red denotes upregulation and green downregulation when comparing patients vs. carriers (purple columns) or treated vs. untreated FRDA cells (cyan columns). Opposite colors in the two sections of the heatmap correspond to amelioration of the biochemical phenotype. (B) Barplot representing the percentage of the P77 genes changed towards normal (yellow) or completely normalized (red) by treatment. Trend towards normalization is defined as a change of at least 30% towards normal levels. An effect is detectable in both patient and carrier samples, for compounds 4b and 106. Compound 106 has the highest percentage of trend towards normalization (~80%) and complete normalization (~60%). (C) Frataxin mRNA levels in PBMCs after treatment with compound 106 at increasing doses (1, 5, 10, 20, and 50 μM) as detected by Illumina microarray probes show a dose-dependent increase spanning 2 log2-scale units in normal individuals (red lines), carriers (light colors) and patients (dark colors). The highest treatment dose (50 μM) is associated with a drop of frataxin levels, possibly because of toxicity; (D) Barplot representing the percentage of genes changed towards normal (yellow) or completely normalized (red) by treatment, in cells from patients and carriers, after treatment with increasing doses of c106. The trend towards normalization plateaus at 5 μM, the percentage of completely normalized genes at 10 μM; (E) qPCR confirmation of the treatment effect in an independent series. Barplot representing the gene expression fold changes (absolute ratios) of 8 genes selected for confirmation, in the 10B series (see Text): bars represent gene changes in cells from FRDA patients vs. carriers (blue bars), and effect of c106 treatment on FRDA cells. (orange bars). The fold change detected by the array is represented for reference with white bars. Error bars: standard error of the mean. The red line is marking a fold change = 1 (no change). Five out of seven genes (besides frataxin) show a reverse change after treatment with c106. For one (APOE) the drug related but not the FRDA-related change was confirmed by qPCR.
We next performed a dose-response study in a subset of 5 patient/carrier/controls using c106, since it induced the strongest expression changes in the overall cohort. Although baseline frataxin levels are at the limit of detection in PBMCs using this microarray platform, frataxin levels showed a clear dose-dependent increase in peripheral blood after treatment with c106, spanning 2 log units in controls, heterozygous and homozygous GAA expansion carriers (Figure 5C), confirming previous data3. We also observed a trend towards normalization of the FRDA disease signature plateaus at 5 μM, and the percentage of completely normalized genes at 10 μM (Figure 5D). This experiment suggests that an in vitro concentration of 5 μM, which is one-half of the HDACi concentration tested in the previous experiments, could ameliorate the differential effects of most genes in the FRDA signature biomarker set, and may serve as a useful guide for current and future pharmacokinetic experiments.
qPCR confirmation of drug effect on biomarker set
We confirmed the effect of HDACi treatment on a subset of the biomarker set in an independent set of 10 patients and carriers (10B series) whose PBMCs were treated in vitro with c106. Five of the seven tested genes (in addition to frataxin) showed the expected change as predicted by our biomarker analysis as well as a change towards normal levels after treatment with c106; for one (APOE), the drug, but not the FRDA-related change was confirmed (Figure 5E). The global effect of HDACi treatment on PBMCs is outlined in the Supplementary Text.
DISCUSSION
Here we show that frataxin deficiency is associated with significant gene expression changes in FRDA patients and mostly parallel, but lesser changes are observed in asymptomatic mutation carriers. The molecular profiling of FRDA patients and carriers allowed the identification of a peripheral biomarker set, P77, which delineates patients from both carriers and controls. These genes are associated with clinical disease status and not just with frataxin deficiency, as would be the situation if only cases and unrelated controls were compared, as is typical. HDACi treatment of peripheral lymphocytes with c106 significantly upregulates frataxin and rescues most of the changes observed in the disease-associated biomarker set in our in vitro system, consistent with their pathological role downstream of frataxin deficiency. Further in vivo testing in patients treated with potential disease-altering therapies now represents a key next step in the process of biomarker validation.
Identifying, refining, and validating peripheral biomarkers represents a key goal in modern translational neuroscience21. Here, we demonstrate a proof of principle in FRDA, the most common inherited ataxia, providing a stringent level of independent biological validation in independent cohorts, and honing in on a core set of confirmed biomarkers from the initial set. Since these are measurable from peripheral blood, they also provide the potential for relatively easy longitudinal measurement, and to track disease progression along with clinical and laboratory evaluation. Further work will be needed to define the extent to which these biomarkers change with disease progression.
Some of the pathways identified, specifically DNA damage repair, as recently demonstrated by Haugen et al17, represent potential novel therapeutic targets. Given that frataxin deficiency leads to mitochondrial dysfunction, which itself causes oxidative stress and DNA damage, it may be hard to distinguish whether the DNA damage observed in chronic patients is a cause or a downstream effect. Here, the identification of aprataxin as a frataxin-related, down-regulated gene, is prima facie evidence supporting the initiating role of DNA damage in FRDA pathophysiology.
Frataxin downregulation induces gene expression changes in both FRDA patients and heterozygous expansion carriers
Our data support the hypothesis that, similar to other diseases due to haploinsufficiency (e.g. ataxia telangiectasia22), heterozygous carriers are asymptomatic, but show a biochemical phenotype, with many changes that are not compensatory, but mirror the pathological process observed in patients. Other laboratory abnormalities have been described in heterozygous expansion carriers23, further supporting the presence of a biochemical phenotype in these otherwise normal subjects. Many of the observed changes have been reported in affected tissues from animal models of frataxin deficiency. For example, RARRES2, HSPA8, RNF7, TRAM1, STAT1, EIF4A1 are downregulated and SULT1A1, IVNS1ABP, ADK are upregulated in both patient cells and hearts from frataxin-deficient mice, and APTX is slightly downregulated in the hearts of frataxin-deficient mice. Notably, LEP (ranked #3 in the P77 set) is increased (+42%) in the skeletal muscle frataxin-deficient mice, where it is reduced by in vivo treatment with c106. Given that these published studies in mouse were performed on very different microarray platforms, one does not necessarily expect an overlap in genes detected as differentially expressed. So, it is notable that several of P77 set genes change in disease models with frataxin knockdown.
A core peripheral molecular phenotype in FRDA
We confirmed a subset of the initial P77 probes in several independent patient series, validating their link to frataxin deficiency and their possible role as core biomarker set. Interestingly, we found an over-representation of lipid-related genes (mostly upregulated) in PBMCs of FRDA patients and, to a lesser extent, of FRDA carriers, confirming our findings of lipid metabolism and energy balance dysregulation in affected tissues from in vivo and in vitro models of frataxin deficiency12.
Haugen et al17 recently reported a gene expression study in peripheral blood from children and adults with FRDA, compared to normal controls. We also identified DNA repair as one of the top dysregulated mechanisms in our cohort, supporting the idea that DNA repair is involved in FRDA pathogenesis. We systematically compared our gene lists (FRDA set and P77 sets) with those reported by Haugen et al (Tables S8-9). The FRDA list identified in this study had a better overlap with the ‘adult’ list17, whereas the P77 list had a better overlap with the ‘children’ list (Figure S4), supporting the idea that the former is more related to a general effect of frataxin deficiency, and the latter to an active pathogenetic process. Although the pathways identified overlap, correlation at the level of individual genes between the two studies is modest. Reasons for this may include differences in experimental design, microarray platform, and statistical analysis. Carriers were not evaluated in Haugen et al. and, based on data from animal models and patients, we hypothesize that only a subset of the gene expression changes associated with frataxin deficiency are responsible for the clinical syndrome, and the comparison between patients and carriers is important for the identification of this critical set of genes.
The need for a biomarker set is particularly strong now that potentially effective therapeutic strategies are in sight. Since therapeutic trials are time-limited, the absence of biomarkers reflecting acute or sub-acute changes in disease status may reduce the power of such studies to detect response to therapy in neurodegenerative disease. In theory, an effective drug treatment would be able to reverse not only frataxin deficiency, but also the downstream changes associated with it, as increasing frataxin levels may be necessary, but not sufficient to reverse the pathogenic biochemical alterations associated with frataxin deficiency. We realize that these findings with regards to drug response are in vitro and more in vivo confirmation of such effects is needed. Here propose a general rubric where biomarker sets in neurodegenerative diseases are identified by gene-expression screening, validated in additional subject pools, and then followed longitudinally over time in the context of clinical trials (Figure S5). Additional work is needed to further refine this biomarker set in larger patient cohorts, to relate it to disease progression in vivo, to assess the effect of compounds already used in the clinical practice (eg. idebenone), and to determine its specificity by comparing it to other neurological diseases.
Supplementary Material
ACKNOWLEDGMENT
The authors thank Drs. Brent Fogel and Gena Konopka for critical reading of the manuscript, Maren Engelhardt, Joseph DeYoung and the Southern California Genotyping Core for technical assistance, Coriell Cell Repositories for providing FRDA and control lymphoblast cell lines. This work was partially supported by research grants from the Dr. Miriam and Sheldon G. Adelson Medical Research Foundation (GC and DHG), Repligen Corporation (to GC and DHG), FARA/MDA (to DRL and SP), and NIH grant NS055781 to JMG. The research leading to these results has received funding from the European Union Seventh Framework Programme (FP7/2007-2013) under grant agreement n° 242193/EFACTS.
Footnotes
AUTHORS’ CONTRIBUTIONS
GC co-designed the study, performed experiments, analyzed and interpreted data, and wrote the manuscript, RB co-designed the study and performed experiments, RV performed experiments, FG analyzed data, SP, HP, MR, FS, AF, DRL, JR, MP contributed patient samples, and discussed data interpretation, JG co-designed the study and discussed interpretation, DHG co-designed the study, discussed interpretation and contributed to the manuscript. All authors have contributed to, seen, and approved the manuscript.
COMPETING INTERESTS STATEMENT
JMG serves as a consultant to Repligen Corporation and HP and JR are employees of Repligen Corporation.
REFERENCES
- 1.Pandolfo M. Friedreich ataxia. Arch Neurol. 2008;65:1296–1303. doi: 10.1001/archneur.65.10.1296. [DOI] [PubMed] [Google Scholar]
- 2.Campuzano V, Montermini L, Molto MD, et al. Friedreich’s ataxia: autosomal recessive disease caused by an intronic GAA triplet repeat expansion. Science (New York, N.Y. 1996;271:1423–1427. doi: 10.1126/science.271.5254.1423. [DOI] [PubMed] [Google Scholar]
- 3.Herman D, Jenssen K, Burnett R, et al. Histone deacetylase inhibitors reverse gene silencing in Friedreich’s ataxia. Nat Chem Biol. 2006;2:551–558. doi: 10.1038/nchembio815. [DOI] [PubMed] [Google Scholar]
- 4.Saveliev A, Everett C, Sharpe T, et al. DNA triplet repeats mediate heterochromatin-protein-1-sensitive variegated gene silencing. Nature. 2003;422:909–913. doi: 10.1038/nature01596. [DOI] [PubMed] [Google Scholar]
- 5.Festenstein R. Breaking the silence in Friedreich’s ataxia. Nat Chem Biol. 2006;2:512–513. doi: 10.1038/nchembio1006-512. [DOI] [PubMed] [Google Scholar]
- 6.Burnett R, Melander C, Puckett JW, et al. DNA sequence-specific polyamides alleviate transcription inhibition associated with long GAA. TTC repeats in Friedreich’s ataxia. Proc Natl Acad Sci U S A. 2006;103:11497–11502. doi: 10.1073/pnas.0604939103. [DOI] [PMC free article] [PubMed] [Google Scholar]
- 7.Boesch S, Sturm B, Hering S, et al. Friedreich’s ataxia: clinical pilot trial with recombinant human erythropoietin. Ann Neurol. 2007 doi: 10.1002/ana.21177. [DOI] [PubMed] [Google Scholar]
- 8.Sturm B, Stupphann D, Kaun C, et al. Recombinant human erythropoietin: effects on frataxin expression in vitro. Eur J Clin Invest. 2005;35:711–717. doi: 10.1111/j.1365-2362.2005.01568.x. [DOI] [PubMed] [Google Scholar]
- 9.Marmolino D, Acquaviva F, Pinelli M, et al. PPAR-gamma agonist Azelaoyl PAF increases frataxin protein and mRNA expression: new implications for the Friedreich’s ataxia therapy. Cerebellum. 2009;8:98–103. doi: 10.1007/s12311-008-0087-z. [DOI] [PubMed] [Google Scholar]
- 10.Rai M, Soragni E, Jenssen K, et al. HDAC inhibitors correct frataxin deficiency in a Friedreich ataxia mouse model. PLoS ONE. 2008;3:e1958. doi: 10.1371/journal.pone.0001958. [DOI] [PMC free article] [PubMed] [Google Scholar]
- 11.Rai M, Soragni E, Chou CJ, et al. Two new pimelic diphenylamide HDAC inhibitors induce sustained frataxin upregulation in cells from Friedreich’s ataxia patients and in a mouse model. PLoS One. 2010;5:e8825. doi: 10.1371/journal.pone.0008825. [DOI] [PMC free article] [PubMed] [Google Scholar]
- 12.Coppola G, Marmolino D, Lu D, et al. Functional genomic analysis of frataxin deficiency reveals tissue-specific alterations and identifies the PPARgamma pathway as a therapeutic target in Friedreich’s ataxia. Hum Mol Genet. 2009;18:2452–2461. doi: 10.1093/hmg/ddp183. [DOI] [PMC free article] [PubMed] [Google Scholar]
- 13.Coppola G, Choi SH, Santos MM, et al. Gene expression profiling in frataxin deficient mice: microarray evidence for significant expression changes without detectable neurodegeneration. Neurobiol Dis. 2006;22:302–311. doi: 10.1016/j.nbd.2005.11.014. [DOI] [PMC free article] [PubMed] [Google Scholar]
- 14.Seznec H, Simon D, Bouton C, et al. Friedreich ataxia: the oxidative stress paradox. Hum Mol Genet. 2005;14:463–474. doi: 10.1093/hmg/ddi042. [DOI] [PubMed] [Google Scholar]
- 15.Pomplun D, Voigt A, Schulz TJ, et al. Reduced expression of mitochondrial frataxin in mice exacerbates diet-induced obesity. Proceedings of the National Academy of Sciences of the United States of America. 2007;104:6377–6381. doi: 10.1073/pnas.0611631104. [DOI] [PMC free article] [PubMed] [Google Scholar]
- 16.Tan G, Napoli E, Taroni F, Cortopassi G. Decreased expression of genes involved in sulfur amino acid metabolism in frataxin-deficient cells. Hum Mol Genet. 2003;12:1699–1711. doi: 10.1093/hmg/ddg187. [DOI] [PubMed] [Google Scholar]
- 17.Haugen AC, Di Prospero NA, et al. Altered gene expression and DNA damage in peripheral blood cells from Friedreich’s ataxia patients: cellular model of pathology. PLoS Genet. 2010;6:e1000812. doi: 10.1371/journal.pgen.1000812. [DOI] [PMC free article] [PubMed] [Google Scholar]
- 18.Thierbach R, Drewes G, Fusser M, et al. The Friedreich’s Ataxia protein frataxin modulates DNA base excision repair in prokaryotes and mammals. Biochem J. 2010 Sep 6; doi: 10.1042/BJ20101116. Epub ahead of print. [DOI] [PMC free article] [PubMed] [Google Scholar]
- 19.Harris JL, Jakob B, Taucher-Scholz G, et al. Aprataxin, poly-ADP ribose polymerase 1 (PARP-1) and apurinic endonuclease 1 (APE1) function together to protect the genome against oxidative damage. Hum Mol Genet. 2009;18:4102–4117. doi: 10.1093/hmg/ddp359. [DOI] [PubMed] [Google Scholar]
- 20.Thomas EA, Coppola G, Desplats PA, et al. The HDAC inhibitor 4b ameliorates the disease phenotype and transcriptional abnormalities in Huntington’s disease transgenic mice. Proc Natl Acad Sci U S A. 2008;105:15564–15569. doi: 10.1073/pnas.0804249105. [DOI] [PMC free article] [PubMed] [Google Scholar]
- 21.Perrin RJ, Fagan AM, Holtzman DM. Multimodal techniques for diagnosis and prognosis of Alzheimer’s disease. Nature. 2009;461:916–922. doi: 10.1038/nature08538. [DOI] [PMC free article] [PubMed] [Google Scholar]
- 22.Watts JA, Morley M, Burdick JT, et al. Gene expression phenotype in heterozygous carriers of ataxia telangiectasia. Am J Hum Genet. 2002;71:791–800. doi: 10.1086/342974. [DOI] [PMC free article] [PubMed] [Google Scholar]
- 23.Ristow M, Giannakidou E, Hebinck J, et al. An association between NIDDM and a GAA trinucleotide repeat polymorphism in the X25/frataxin (Friedreich’s ataxia) gene. Diabetes. 1998;47:851–854. doi: 10.2337/diabetes.47.5.851. [DOI] [PubMed] [Google Scholar]
Associated Data
This section collects any data citations, data availability statements, or supplementary materials included in this article.