

Abstract
The Bcl-2 family contains six anti-apoptotic members, each with a hydrophobic pocket where BH3 helixes (Bcl-2 homology region 3) bind. This binding quenches apoptotic signals from activated BH3 family members. Many tumor cells either have increased expression of one of these six proteins, or become overexpressed under treatment. Herein we provide a protocol for the simultaneous, in vitro screening of a small molecule library against all six anti-apoptotic Bcl-2 family members using a fluoresceinated BH3 peptide. Six fusion proteins made up of glutathione-S-transferase and each of the Bcl-2 members are bound individually to six glutathione bead sets, each set being easily distinguished by their different intensity of red fluorescence. The coated bead sets are washed, combined, and incubated with green fluorescent Bim BH3 peptide and a small molecule in 10 microliter wells for 1 hour. Flow cytometry measures the peptide bound to each bead set without wash steps. The green fluorescence signal for each bed set is resolved, and selective inhibitors are expected to reduce the signal for individual bead sets, with pan-inhibitors affecting all bead sets. Each 384 well plate is analyzed in 12 minutes, typically measuring 200 of 2,000 beads (~10%) of each type per well.
Keywords: Bcl-2, multiplex, fluorescence, screen, protein-peptide interaction
INTRODUCTION
Small molecules can enhance or diminish the interactions between biological molecules, and modern drug discovery uses molecular interaction targets to find such regulators1. The first step in drug discovery is often a fast, cost efficient assay, to ‘screen’ many compounds for ‘hits’, or compounds that give some enhanced or diminished signal for a targeted interaction. The second step is to submit these hits to a dose-response series of the first assay, seeking to prioritize the hits as leads for follow-up. The third step uses an independent molecular or cell-based assay to validate the prioritized compounds.
Use of flow cytometry in drug discovery screens
We have described previously methods that allow flow cytometers to be used in screening cells for molecules that regulate the binding of fluorescent ligands to their receptors on cells, as well as general principles for applying such screening systems in 96 and 384 well plates2. Briefly, to allow quick sampling from a multiwell plate to a cytometer, an autosampler is connected with flexible tubing and a peristaltic pump to a flow cytometer. When the autosampler probe is down in a well, 1-2 microliters of suspension is drawn into it, and when the probe is up, an air bubble is drawn into it, so that a plate is read as a single time-based file of many suspensions of cells, separated by air bubbles. This system for automated flow cytometry is named HyperCyt™. The protocol described here assumes knowledge of the general principles of flow cytometry and HyperCyt™ (see reference 2), and is intended to extend the utility of HyperCyt™ to include the use of protein-coated beads in addition to cells, 384 well plates in addition to 96 well plates, and fluorescent labeling of the beads to allow multiplexing. Once a series of related fluorescent assays have been developed and their limitations have been determined, a multiplex screen can be carried out.
Bcl-2 family proteins dimerize via their BH3 helices
The Bcl-2 (B-cell lymphoma-2) protein was discovered during positional cloning of the t(14;18) chromosomal breakpoint in follicular lymphomas, in which the protein is over-expressed due to proximity of the immunoglobulin heavy chain gene enhancer on chromosome 143-5. This finding, coupled with evidence that overexpression of Bcl-2 can inhibit the apoptotic form of programmed cell death, suggested that cancer can result from a lack of appropriate cell death, in addition to excess cell growth. The family is comprised of both pro-apoptotic and anti-apoptotic proteins, and now includes about 9 core members, which share several homology regions, as well as a larger number of diverse regulators that share only the BH3 domain, which is an amphipathic peptide of 16-20 amino acids6. The 3D structure of the Bcl-2 family protein Bcl- XL cocrystalized with the Bak BH3 peptide was reported in 19977, and guides our thoughts about how these proteins multimerize, and which conditions cause or inhibit cell death. Briefly, overexpression or activation of pro-apoptotic family members increases cell death, whereas overexpression of anti-apoptotic family members inhibits cell death by binding the activated BH3 helices8,9. Chemical inhibitors of this binding have been identified by many approaches, and some of these are in clinical trials as candidate anti-cancer agents10.
Overview of the procedure as applied to a screen for small molecules that inhibit binding of Bim BH3 peptide to six Bcl-2 proteins
The apoptotic family member Bim has a BH3 peptide that binds to all six anti-apoptotic family members, and we have used a fluoresceinated Bim BH3 peptide (F-Bim) in our screen. A schematic diagram of our strategy is shown (Fig. 1). The six anti-apoptotic family members (Bcl-XL, Bcl-2, Bcl-W, Bcl-B, Bfl-1, and Mcl-1) are all expressed separately as GST fusion proteins in bacteria, affinity purified, cleared of glutathione, and mixed individually with six glutathione bead sets. Each set of beads is labeled with a defined quantity of a red fluorophore, which provides a different intensity of red fluorescence (please see REAGENTS and Fig. 1 for further description of these beads). The coated beads are washed, mixed together and incubated with potential inhibitors plus F-Bim in a plate with end-over-end (inverted to upright) rotation for 1 h at 4 °C. The plate is sampled with HyperCyt™, and the resulting series of bubble-separated bead clusters is measured by flow cytometry. The flow cytometry data are acquired as a list mode file, which provides the arrival time, forward scatter, side scatter, and green and red fluorescence intensity of each particle. The file is analyzed and reduced in size subsequently with specialized software that identifies the mean or median fluorescence for each color-coded bead set and the number of bead events associated with each set for each well. To achieve this, the mixed bead sets are gated for singlet beads as shown (Fig. 1b), then for each bead set as shown (Fig. 1c), allowing, for example, the amount of green fluorescence on the beads in gate 3 to be identified as a measure of F-Bim binding to Bcl-XL. Uncoated glutathione beads are also detected in the assay (gate 9) and serve as a measure of fluorescence background, due to the binding of F-Bim directly to beads, or to the scavenging of dissociated GST-Bcl-2 family proteins from the suspension with bound F-Bim. The software also rapidly divides the file into 384 clusters of events (wells), records and calculates the desired measures of the data and exports these as an Excel .csv file. Assay-specific analysis spreadsheets are designed with macros (Microsoft Excel), into which the .csv file is placed, which assemble the desired statistics and graphs, and that flag possible hits for each molecular library plate in a batch mode. Supplementary Note 1 shows 384-well “plate maps” for the screening assay and for 32 dose-response series; Supplementary Data 1 shows an analysis spreadsheet for the screening plate shown in Fig. 3; and Supplementary Data 2 shows an analysis spreadsheet for 32 compounds which had been identified as “hits”, carried out as 32 dose-response series. Most importantly, the screening analysis spreadsheet computes the average negative control for a plate for each protein, determines whether the fluorescence signal goes down at least 40% for any compounds, and flags those compounds. Because Excel does not have a robust analysis for dose-response curves, we have used the program Prism (GraphPad software) to analyze the dose-response data, and then import Prism’s analysis of the dose-responses in batch mode. These steps are currently in the process of being replaced by more automated processes. Most importantly, the dose-response analysis calculates whether the EC50 value is less than 10 μM for each protein, whether the uninhibited signal went down by at least 40% for any compounds, and flags those compounds.
Figure 1. Bead coating and gating.
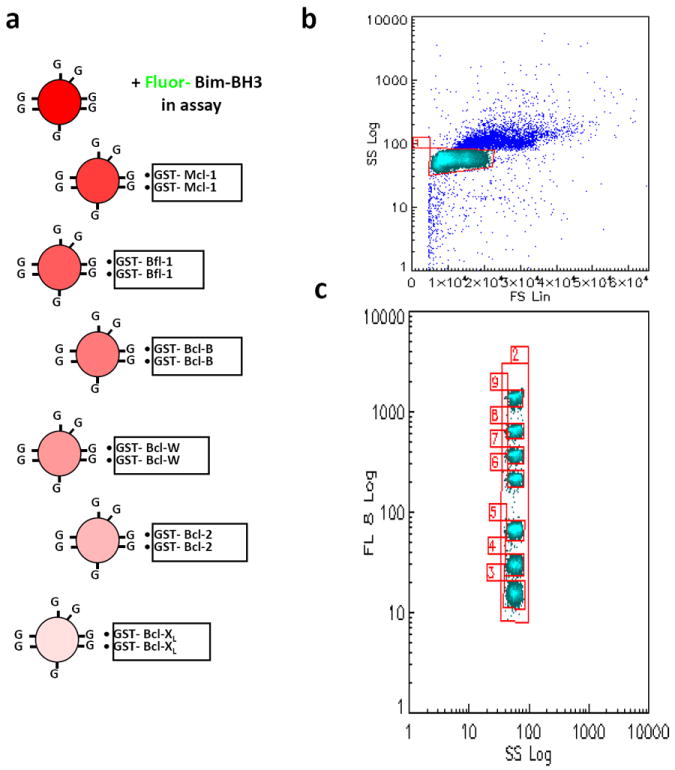
(a) Six GST-Bcl-2 family proteins are individually coated on red-coded GSH bead sets overnight, while a seventh set of GSH beads serves as a measure of nonspecific binding. (b) After the multiplexed assay with green F-Bim has incubated an hour, the mixed beads are measured with a flow cytometer for forward scatter, side scatter, and green and red fluorescence. In a plot of forward scatter versus side scatter, a gate is drawn around the singlet beads (identified as the major light blue ‘dot cloud’ compared to buffer without any beads; doublets occur at slightly higher forward scatter and side scatter, and appear as dark blue dots in this Figure). (c) Gates are drawn around each bead set using their red fluorescence as shown. In our example, the beads in gate 3 were coated with Bcl-XL, and the amount of green fluorescence on them would be a measure of the F-Bim bound to Bcl-XL.
Figure 3. Finding an inhibitor specific for Bcl-B.
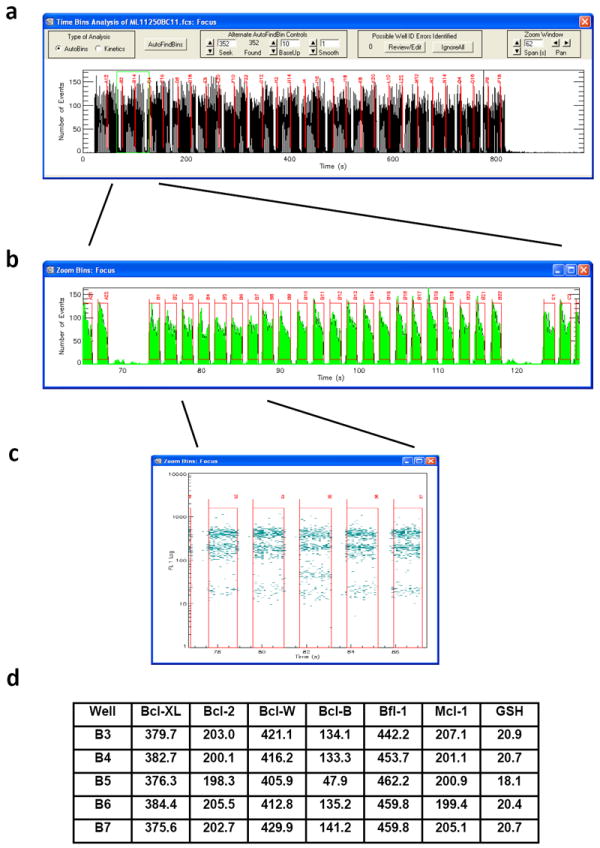
(a) Time bins corresponding to bead-containing wells are partitioned and analyzed in about three seconds for a 384 well plate file; we use no beads in columns 23 and 24, leaving 352 bins with beads. A plot of events (beads per 0.1 s) versus time for a plate is displayed. (b) An enlarged view of Row B. (c) An enlarged view of the wells around well B5, with log FL1 (green fluorescence) on the Y axis. (d) Median fluorescence intensity (MFI) measurements for the wells around well B5. Only the Bcl-B value in B5 is significantly decreased.
Validation of multiplexing using Bcl-2 family proteins
To validate our multiplex approach, binding curves for all six proteins with the fluorescent peptide (Fig. 2a) and competition curves for F-Bim using a known inhibitor (ABT-737) of four of the six proteins (Fig. 2b) were determined. The binding and inhibition constants thus obtained agree with the literature, with due regard for differences in assay procedures11. We report here simultaneous measurements of six protein interactions of targets with a fluorescent peptide probe, which saves time and reagents by multiplexing, and allows compound selectivity to be observed in a single 10 μl well in the primary screen. We have used this approach to screen 194,920 compounds, and have reported the results in PubMed: search PubChem BioAssay for Bcl-2; assay identification numbers (AID numbers) are 950 (Bcl-2), 951 (Bcl-B), 952 (Bcl-W), 1007 (Bcl-XL), 1008 (Bfl-1), 1009 (Mcl-1). Limitations of the primary assay arise statistically from false positives and false negatives as well as from compounds that are fluorescent or interfere with the recognition motif that attaches the protein target to microspheres. The potential for multiple activities within a single well reduces the statistical uncertainty associated with non-selective compounds. The use of a seventh, appropriately configured, control set of beads in each well may serve as a measure of compound fluorescence for the well.
Figure 2. Multiplex binding and competition curves.

(a) Six Bcl-2 family proteins are tested for binding F-Bim using the procedures in this protocol. (b) Using a constant 50 nM F-Bim, the concentration of a known competitor (ABT-737) of four proteins was varied in a dose-response series of assays using the procedures in this protocol. The affinities of F-Bim to each protein, and the ability of ABT-737 to block F-Bim binding to four of them at relatively low concentrations, agree with literature data, and thus constitute the minimal pharmacology necessary to validate this protocol.
Comparison of fluorescence polarization with flow cytometry for screening
Several methodologies including time resolved fluorescence resonance energy transfer (TR-FRET, http://www.htrf.com/technology/htrftheory/tr_basics/), Alpha Screen (http://las.perkinelmer.com/applicationssummary/applications/Principles+of+AlphaScreen.htm), and fluorescence polarization are common methods for detecting the binding of a small fluorescent ligand to a protein, and in general these methods may be considered for conversion to a multiplex flow cytometric format12. In the case of TR-FRET and polarization, the target components would require assembly on beads. In the case of Alpha Screen, with the targeted components bridging two beads, one of the bead components is replaced by a fluorescent component. All of these methods can be highly automated and now have the potential to be performed in 1536 well plates.
A comparison of the bead based assay described herein to fluorescence polarization in solution is informative. The fluorescence from the small ligand is less polarized when unbound, and more polarized when bound to the large protein13. To obtain 50% of the maximal polarization change, and the most sensitive concentration for observing any change in polarization, the protein should be present at the Kd of the interaction. For screening, test compounds are also added: an inhibitor would decrease polarization, and an activator would increase polarization. For the six proteins tested here by HyperCyt™, the fluorescent peptide exhibited an average Kd of 50 nM. Using these concepts, a fluorescence polarization assay might use 2 nM fluorescent ligand and 50 nM protein to obtain 50% of the maximal signal. To obtain 50% of the maximal signal on beads, the fluorescent ligand should be present at the Kd of the interaction, so this report uses 50 nM fluorescent ligand and 2 nM (or less depending upon bead and site density) protein. Flow cytometry thus has the potential to use the precious protein reagent efficiently. Moreover, flow cytometry does not suffer from the limitation that arises as the fluorescent molecule increases in mass so that the difference between the polarization of the free and bound species decreases. In a flow cytometer, the beads are in a narrow stream of assay buffer where the laser beam illuminates only a small volume of buffer surrounding the bead; the cytometer then records the fluorescence of the bead above the buffer fluorescence, allowing homogeneous, no-wash detection of bead fluorescence, typically up to at least 100 nM fluorophore. Screening six proteins per well increases assay efficiency, decreases use of precious reagents, shows selectivity of the small molecule interaction if such exists, and can include appropriate fluorescence control beads. Fluorescence polarization provides an advantage for a single assay, requiring one mix step and a plate reader, versus flow cytometry, which requires a bead coating step, a mix step, and HyperCyt™ plus a flow cytometer.
Using fusion proteins for multiplexed flow cytometric assays
A hallmark multiplexed assay with moderate throughput was previously described in which 15 cytokines were detected simultaneously using a flow cytometer, but the methodology used both a capture antibody, covalently attached to a bead set, and a fluorescent detection antibody for each cytokine14. A simpler system for capturing a protein on a bead set consists of a tagged fusion protein and beads that bind the tag. A competitive screening assay can then be built by mixing (coating) the beads with the tagged protein, washing away excess protein, and incubating the coated beads with a fluorescent binding partner in the absence or presence of small molecules: in the absence of inhibitors, the beads are bright; in the presence of inhibitors, the beads become dim. Successful multiplexing of two proteins demands two bead sets that have different optical signatures, e.g., if the binding partner has green fluorescence, the two bead sets might have different red fluorescence intensities. Each fusion protein is then mixed individually with a bead set, the coated beads are washed separately and mixed together with the green fluorescent binding partner, the suspension is gently mixed to allow the bead sets to approach equilibrium green fluorescence, and the optical signals from the beads are measured with a flow cytometer. We have found that GST (glutathione-S-transferase) tagged fusion protein performs well (see Experimental Design section) although other epitope tagging schemes such as avidin/biotin have also proven useful.
Screening applications
The GST fusion protein multiplex approach described here should be generally applicable for any family of proteins to which a GST tag can be added without disturbing the binding characteristics. The University of New Mexico Center for Molecular Discovery has completed screening of the NIH Molecular Libraries Small Molecule Repository using this method. Data have been reported in PubMed for a series of small G proteins binding a fluorescent GTP analog in addition to the screen described here. PubChem AID (assay identification) numbers are 757 (Rac), 758 (Rab7), 759 (Ras), 760 (Rab2), 761 (Cdc42), 764 (Rac act). In addition to the fluorescent peptide described here, other screens could use other types of fluorescent compounds: analogs of receptor ligands, nucleotides or nucleotide oligomers, sugars, lipids, and GFP-tagged proteins, for example. Hits in screening are retested in a dose-response assay, 32 of which can be performed on one 384-well plate, to confirm the activity of a hit.
For dose-response analysis, we have elected to obtain most of the possibly useful substructures or scaffolds in the library, and then use the dose-response series to eliminate false positives and place the confirmed compounds in order of their potency. Following a single determination for each compound in the primary screen, compounds that were available were retested by a dose-response series. Table 1 shows the number of molecules which we defined as producing 40% inhibition with an EC50 ≤10 μM. Active molecules were lost at this stage based on the hit criteria, fluorescent artifacts, and molecules that interfered with the GSH to GST interaction. A ‘counterscreen’ has been deposited in PubChem (BioAssay AID 1324) with 19 compounds assessed as affecting the GSH to GST interaction. Moreover, in addition to using blank beads as control, experience suggests that a bead displaying an inactive protein in the multiplex family may provide additional information regarding compound fluorescence. A detailed analysis of this screen and follow up is in press, “High throughput screen for chemical inhibitors of anti-apoptotic Bcl-2 proteins by multiplex flow cytometry”, in ASSAY and Drug Development Technologies.
Table 1.
Primary screening and confirmatory dose response results
| Screening | Cmpds tested | Number of Hits (Pubchem AID) | Total hitsa | |||||
|---|---|---|---|---|---|---|---|---|
| Bcl-2 | Bcl-B | Bcl-xL | Bcl-W | Bfl-1 | Mcl-1 | |||
| Primary | 194829 | 116 (950) | 142 (951) | 82 (1007) | 48 (952) | 237 (1008) | 196 (1009) | 385 a |
| Confirmatory Dose-Response | 834 | 9 (1328) | 6 (1327) | 6 (1322) | 18 (1330) | 97 (1320) | 3 (1329) | 27 a |
Bfl-1 hits were not included in the number of total hits since the dose response results from the original Bfl-1 preparation were not replicated with a new preparation in the FP dose response analysis; total hits is thus the number of unique compounds affecting one or more of the other five anti-apoptotic Bcl-2 family members. For explanation, see Curpan, et al., ADDT in press.
EXPERIMENTAL DESIGN
Choice of fusion protein
During the incubation the tagged proteins must not dissociate significantly from the beads. We have investigated the six histidine, biotin, and GST (glutathione-S-transferase) tags. Fortuitously the GST tag exhibits very slow dissociation from glutathione bead surfaces, possibly due to rebinding as well as dimerization of the GST moieties, making the GST tag a good choice for multiplexed screening15,16.
Determining cut-off values for dose-response assays
Because the data were obtained in a multiplex format, any compound tested for a given protein was automatically tested for all six proteins with a 40 % inhibition, a Kd ≤ 10 μM, and the error of the Kd within an order of magnitude of the Kd. Importantly, although the assay data in PubChem were analyzed only for inhibitory hits, a number of compounds proved to exhibit simultaneous inhibition of binding to one protein and augmentation of binding to another protein. Compounds could thus be assigned different bioassay profiles, such as 1) selective inhibitors (inhibitor of Bfl-1 alone or in combination with others), 2) selective activators; 3) mixed activator and inhibitor (e.g., an inhibitor of Bfl-1 and an activator of Bcl-B).
Optimizing coating conditions
The multiplex GST fusion protein assembly described here depends on two binding constants for each fusion protein, one for the bead-borne GSH to the GST fusion protein, and one for the fusion protein to the F-Bim. We have observed that while some fusion proteins bind to GSH beads adequately, they dissociate too rapidly for one hour of incubation as used here and thus give low fluorescence; incubation time can be adjusted to determine if this is so. If the incubation time is too short, however, the binding of the fluorescent probe may not reach equilibrium and give suboptimal fluorescence. Thus, the incubation time and concentration must be optimized to obtain conditions giving a maximal, stable signal. Some GST fusion proteins may exhibit less reliable binding to the glutathione beads. However, since many GST pull-down assays have been reported, it is probable that most GST fusion proteins will bind the beads well. We are fortunate that the Kd values for the binding of F-Bim to the proteins cover a small range, from 6 nM to 60 nM (Fig. 2a). The assay, using 50 nM F-Bim, has the potential of being somewhat more sensitive to inhibitors for some proteins than others (see Box 1).
Box 1. Assay Sensitivity to Targets with Different Kd Values.
Assuming that the bead fluorescence follows the formula of a simple binding curve, then F = Bmax [L]/(Kd + [L]), where F is the fluorescence of the bead, Bmax is the maximal fluorescence of the bead, [L] is the concentration of the fluorescent ligand, and Kd is the dissociation constant of the ligand for the protein. 50 nM F-Bim would give 0.62 Bmax for a protein with a 30 nM Kd, and 0.33 Bmax for a protein with a 100 nM Kd. If a pure competitor compound is added at its Kd, it would theoretically reduce the binding to the 30 nM Kd fusion protein from 0.62 to 0.46 Bmax, a 26% loss, and reduce the binding to the 100 nM Kd fusion protein from 0.33 to 0.20 Bmax, a 40% loss. Thus, a hit for the 30 nM interaction could be set at 28% inhibition, while a hit for the 100 nM interaction could be set at 40% inhibition, to give more comparable selection of inhibitory compounds than our 40% inhibition for all targets. If the range of Kd values were larger for another multiplex, the multiplex could be divided into two multiplex assays, each spanning a smaller range of Kd values. Allosterism is also possible.
Optimizing incubation conditions
While GST fusion proteins are readily prepared by affinity purification, some differences in activity of the fusions will occur. The amount of each GST fusion protein used to coat the bead sets for 24 plates as described was 16 μg, 40 μg, 15 μg, 25 μg, 29 μg and 20 μg for Bcl-XL, Bcl-2, Bcl-W, Bcl-B, Bfl-1 and Mcl-1, respectively. Amounts are adjusted to give uninhibited mean fluorescence intensity (MFI) values of 100-400, corresponding to about 100,000-400,000 standard fluorophores per bead, which is convenient for screening purposes. Our proteins were stable for 3 days at 0-4 °C, but each system should be checked for stability.
Controls
The NIH Molecular Libraries Small Molecule Repository is plated in 320 wells of 384 well plates to allow a pair of controls at each end of each row. We chose to use two negative controls on each row, but just one determination a day for the positive control (an excess blocking concentration of nonfluorescent Bim) in order to save on the cost of Bim. One particular problem, fluid carryover of fluorescent compound from one well to the next, was addressed in part by the seventh uncoated bead set to assist in identifying nonspecific fluorescence for a given well. The fluid carryover depends in part upon the length of the delivery tubing in HyperCyt™ 17, and alternate delivery geometries are under exploration. Beads coated with inactive proteins from the multiplex family may serve as complementary controls.
Number of replicates required
As the beads are more homogeneous than cells, we have observed that Z’ scores are typically better for bead-based assays than for cell-based assays. This assay routinely gives Z’ scores of 0.69 to 0.82, which implies statistically meaningful results for a single point assay. If an assay gives lower Z’ scores, more controls may need to be run, or replicates might be necessary. We then choose to define a hit at low stringency, accepting that the dose-response series will be done on many false positives, while ensuring that we will miss only a few true positive compounds.
MATERIALS
REAGENTS
Test compounds: prepared as 10-3 M stocks in dimethylsulfoxide
Buffer components: HEPES hemisodium salt (gives pH 7.5) (Sigma, cat. No. H7637; Sigma’s formula weight is now based on the sodium, but we are interested in the concentration of HEPES); KCl (Sigma cat. No. P4504); NaCl (Sigma, cat. No. S9625); MgCl2 (Sigma, cat. No. M9272); Tween-20 (BioRad, cat. No. 170-6531); and bovine serum albumin (BSA) (Sigma, cat. No. A3059)
-
Peptides (see REAGENT SETUP for solutions)
Bim BH3 peptide (Abgent): CEIWIAQELRRIGDEFNAYYAR;
CAUTION: verify peptide solubility.
Fluorescent Bim BH3 peptide (Commonwealth Biotechnology, special synthesis): fluorescein isothiocyanate-6-aminohexanoic acid-DMRPEIWIAQELRRIGDEFNAYYAR
Glutathione beads (Microgenics, now Thermo Fisher Scientific, special order. We bought 10 ml each of ten sets, each set with a different quantity of red fluorescent dye internal to the bead, giving ten intensities of red fluorescence.) Each polystyrene bead set (intensity of red fluorescence) is supplied at 1.4 × 10⁵ beads/μl. The beads have a diameter of about 4 microns, with about 1.2 million glutathione sites per bead, determined as described earlier using GST-green fluorescent protein16. The earlier work used dextran beads with a different method of glutathione linkage, and a different assay buffer; we now get a Kd of 10 nM for GST-green fluorescent protein using overnight coating at 4°C.
Fluorescence standard beads (Bangs Laboratories, cat. No. 825B) This kit contains five sets of beads, with a measured green fluorescence for each set in the FITC, or fluorescein, channel, using a 488 nm laser for excitation and (in our instrument) a 530 nm +/- 20 nm emission filter. The fluorescence is given in mean equivalents of soluble fluorophores (MESF) ranging from 40,000 soluble fluorescein equivalents to 1,100,000 soluble fluorescein equivalents, and is used to calibrate the instrument response daily.
-
GST fusion protein aliquots, about 20 μg per frozen aliquot of 4 μl in buffer containing 10% vol/vol ethylene glycol, for 24 plates. These have been previously described11.
CAUTION: note the differences in peptide binding for Bcl-B in Figures 2a and 2b, which were performed more than a year apart. Proteins should be checked for activity before the screen and before any follow up assays.
EQUIPMENT
Assay plate (Greiner Bio-One, cat. No. 784101; 384 well, 30 μl maximum volume)
Sealing covers for plates (GeneMate, cat. No. T-2417-6; we press seal these with a roller)
Microcentrifuge (Eppendorf, cat. No. 5417R; others will work)
Rotating mixer (Fisher, cat. No. 14-059-346; plates are held on with rubber bands)
Biomek FXP (Beckman-Coulter) multi-tip dispensing instrument, or robot, with a pin tool device (V&P Scientific)
Flow cytometer (see EQUIPMENT SETUP)
HyperCyt™ instrument (see EQUIPMENT SETUP)
Computer with Microsoft Windows 2000 or Windows XP, 512 MB or more of RAM, 500 MB or more of free disk space, and a USB port
Peltier cooler for standard size plates (Inheco, TEC Control 96 and CPAC Ultra Flat)
REAGENT SETUP
Buffer
A buffered intracellular ionic mimic: 30 mM HEPES, 100 mM KCl, 20 mM NaCl, 1 mM MgCl2, 0.01% Tween-20, and 0.1% bovine serum albumin (BSA). Freeze in 50 ml aliquots, thaw slowly without a microwave oven on the day of assay.
Peptide solutions
Peptides are stored as aliquots at a concentration of 1 mM in DMSO at -80°C, and diluted in buffer to give 1% DMSO or less on the day of assay. Fluorescein retains its fluorescence for a day in workplace fluorescent lighting.
EQUIPMENT SETUP
Flow cytometer
For a multiplexed assay, in addition to the 488 laser, a second red diode laser (635 nm) is required, and for 384 wells, the data acquisition software must include a time parameter capable of binning data at 100 ms intervals continuously for 15 min or more. The cytometers we have successfully used include a CyAn ADP (Dako, now Beckman-Coulter), an LSRII (Becton-Dickinson), and an Accuri C6 (Accuri).
HyperCyt™ instrument (IntelliCyt)
This instrument includes an autosampler, a peristaltic pump, 25-G stainless steel tube inlet probes, a Peltier cooling device for plates, and PVC tubing.
Software for HyperCyt™
The software, commercially available from IntelliCyt (www.intellicyt.com), includes two programs that are needed to run the HyperCyt™ platform: HyperCytSampler controls the autosampler, while HyperCytDataAnalysis is used to bin the time-resolved files stored in flow cytometry standard 2.0 or 3.0 formats, and then reduce and correlate the data file with compounds as described later.
HyperCyt™ setup
This is set up as described earlier2. The cooling device replaces the supplied stand for holding the plate, and should be raised to ensure that the plate occupies the same position for sampling as it would have done on the supplied stand.
PROCEDURE
All steps are performed at 0-4 °C
-
Block the bead sets from nonspecific binding. For each of seven GSH (glutathione) bead sets, pipet 340 μl of buffer (Reagent Setup) into a microcentrifuge tube and add 140 μl of the bead set. Mix the beads well, without foaming, and allow the BSA and Tween-20 (present in the buffer) to block nonspecific binding while the beads settle for 20 min. TIMING 30 min, once per day
See TROUBLESHOOTING.
-
Coat the bead sets with GST-fusion proteins. Thaw aliquots of the six GST-fusion proteins, and coat six of the seven blocked bead sets. Mix each blocked bead set (now 480 μL each) with its fusion protein (we used 4 μl aliquots of each protein) well, without bubbles, and let the seven separate suspensions settle on ice overnight. (The seventh bead set remains uncoated, and will serve as a scavenger for unbound GST-proteins, with associated fluorescence, during the assay.) The amount of each GST fusion protein in the 4 μl aliquot used to coat the bead sets for 24 plates as described was 16 μg, 40 μg, 15 μg, 25 μg, 29 μg and 20 μg for Bcl-XL, Bcl-2, Bcl-W, Bcl-B, Bfl-1 and Mcl-1, respectively. Amounts of fusion proteins were adjusted to give specific mean fluorescence intensity (MFI) values of 100-400, corresponding to about 100,000-400,000 standard fluorophores per bead based on comparison to the Bangs Labs standard beads, which is convenient for screening purposes. TIMING 1-42 hours, once per day*
▲ CRITICAL STEP It is usual to keep the beads suspended during coating, but one of our fusion proteins (GST-Mcl-1) lost about 50% of its binding activity while rotating end-over-end gently overnight with no bubbles formed, and another one (GST-Bcl-2) gave clumped beads. All of the proteins exhibited good binding and no bead clumping with overnight settling, so we let them settle. Test your system for the best coating conditions.
■ PAUSE POINT The pause can be as long as the proteins are stable.
Mix to resuspend the beads, pipet 75 μl of each coated bead set into a fresh microcentrifuge tube, and pellet the bead sets separately at 6,000g for 2 min. Remove the supernatants and resuspend all the beads together in 200 μL of buffer. This is enough for four 384-well plates. TIMING 20 min
Pellet the mixture by centrifugation as above, remove the supernatant, resuspend the beads in 8.5 ml of buffer, and transfer them to a cold trough/reservoir for distribution to an assay plate by the Biomek FXP. TIMING 10 min
Program the Beckman Coulter Biomek FXP robot to deliver 5 μL of bead suspension, 0.1 μL of compound or control in dimethyl sulfoxide using the pin tool device, and 5 μL of 100 nM F-Bim to each well, and mix them. Use the eight tip pod to deliver the coated beads from a cold trough, which is slow but not wasteful of the expensive reagent, and the 384 tip pod for addition of F-Bim and mixing. Columns 23 and 24 on the plate have no beads added. This results in a temporal gap in data acquisition at the end of each row that facilitates accurate identification of rows and wells within rows during post-acquisition data analysis. TIMING 2 min, once per day
-
Cover and rotate the plate end-over-end slowly to maintain suspension at 4 °C for 1 hour. For our fusion proteins, the competitive data remain very similar between one and three hours. Our system rotates the plate at 10 rpm. TIMING 1 hour*
See TROUBLESHOOTING.
■ PAUSE POINT The pause can be as long as your assay output remains stable.
-
Adjust the voltage/gain of the photomultiplier tube (pmt) for the fluorescein channel (488 nm excitation, 530 +/- 20 nm emission) so that the median fluorescence intensity (MFI) reads 100 when the standard beads with 100,000 mean equivalents of standard fluorophores (MESF) are applied, and adjust the voltage/gain of the pmt for the red channel (635 nm excitation, 665 nm +/- 10 nm emission) so that the bead sets are well separated. TIMING 15 min, once per day
See TROUBLESHOOTING.
Move the plate to the plate cooler on the HyperCyt™ autosampler deck for high throughput sampling and flow cytometric measurements. Fill the sample tubing with 50 nM F-Bim and allow it to coat the interior tubing wall for 20 s just before the plate run. TIMING 2 min
-
Start the plate run. The autosampler moves from well to well under the control of HyperCytSampler software, sampling for 1 s from each well and pausing 0.4 s in the air before sampling the next well. The series of 384 bubble-separated samples is delivered to the flow cytometer and is measured as a single data file that is saved in flow cytometry standard 2.0 or 3.0 formats, typically ~10 megabytes/file. Our numbers of beads and sampling times result in more than 200 beads of each type per well on average, and we consider fewer than 50 beads of a given set to be inadequate. If this occurs, the plate can be mixed again and run with a 50% longer sample sip time for each well. TIMING 12 min per plate
See TROUBLESHOOTING.
-
Open a data file with HyperCytDataAnalysis software and gate the bead sets. In a two parameter dot plot of forward scatter versus side scatter (in which each bead is rendered as a dot) for a plate, gate the singlet beads as shown in Fig. 1b; doublet beads are the dark blue dots on this dot plot with slightly higher forward scatter and side scatter. TIMING 30 sec, once per day
See TROUBLESHOOTING.
Select to display only the beads inside the gate, and in a two parameter plot of log side scatter versus log red fluorescence intensity (FL8, 635 nm laser, 665 +/- 10 nm emission), make a second gate around all the bead sets as shown in Fig. 1c, gate 2. This allows all the bead sets to be displayed as a density map during subsequent gating. TIMING 30 sec once per day
Gate the individual bead sets as shown in Fig.1c (the gates for the first plate remain good for the other 23 plates that day), and identify time bins. The gates are drawn manually. Since we have chosen to let columns 23 and 24 of a 384 well plate have no beads, we have only 352 wells to bin. HyperCytDataAnalysis software is then used to identify 352 time bins, which are all displayed in a window in ~3 seconds as shown in Fig. 3a: this plots events (beads per 0.1 s) versus time; the time bins must be repartitioned and reanalyzed for each plate. Each time bin corresponds to a well. An expanded display of data is provided to check for errors in time binning, and to re-draw the bins if necessary. We show Row B as an example (Fig. 3b). Note the low bead carryover observed when the two bead-free wells (not binned) at the end of each row were sampled. We have included the complete analysis file for this plate as Supplementary Data 1. TIMING 2 min per plate
Generate a reduced data file using HyperCytDataAnalysis software. It is instructive to view part of Row I with log FL1 (green fluorescence intensity) on the Y-axis (Fig. 3c). For this plate, it appears to the eye that three proteins had a median fluorescence intensity (MFI) near 400, three a MFI near 200, and the GSH (or scavenger) beads a MFI near 20. It also appears that in bin B5, beads from some set(s) have less fluorescence. The program then calculates the number of beads and the MFI for each bead set in every time bin, and displays these data in tabular form. TIMING 30 sec per plate
Correlate these data with the compound list used for that plate, and export the correlation to a Microsoft Excel spreadsheet as a comma-separated values (.csv) file. The MFI values for wells B3-B7 (Fig. 3d) show that the compound in well B5 apparently inhibited F-Bim binding to Bcl-B more than 50%, and did not inhibit the other proteins significantly, thus suggesting specificity for one protein target for this inhibitor. This reduced data file is typically 42 kilobytes for a plate. TIMING 20 sec per plate
-
Calculate the assay responses and quality statistics using the equations given earlier, which described another competitive binding assay2. Assay response in the form of % inhibition of binding equals 100 × {1-[(MFItest − MFIpc) / (MFIncavg-MFIpc)]}, where MFItest, MFIpc and MFIncavg are the MFI of individual wells containing test compounds, the MFI of a positive control, and the average MFI from all the negative control wells, respectively. In the presented assay, the Bim BH3 inhibitor is conserved by performing only one blocking control (positive control, Bim at 100 μM) per day in a microcentrifuge tube for all the plates. Analysis spreadsheets (Microsoft Excel) are designed with macros that assemble the desired statistics and graphs, and that flag possible hits. Supplementary data 1 is an example of a screening analysis template for the plate shown in Fig. 3. TIMING 30 sec per plate
*Step 2 can be prolonged to 42 hours for our proteins, and step 6 can be extended to 3 hours for our proteins.
•TIMING
Although a single person has done this assay alone in our laboratory, we assume a pair of people working together with one person loading reagents into the plates and analyzing the data, and the other person running HyperCyt™ and the cytometer as follows:
Step 1: 30 min, once per day
Step 2: 1-42 hours; overnight is convenient, once each day*
Step 3: 20 min
Step 4: 10 min
Step 5: 2 min, once per day
Step 6: 1 hour for our approach to equilibrium; other assays may differ*
Step 7: 15 min, once per day
Step 8: 2 min
Step 9: 12 min per plate
Step 10: 30 sec, once each day
Step 11: 30 sec, once each day
Step 12: 2 min per plate
Step 13: 30 sec per plate
Step 14: 20 sec per plate
Step 15: 30 sec per plate
We run up to 40 plates per day or more with two people working and have achieved over 100 plates per day with 4 people working shifts and 4 flow cytometers.
*Step 2 can be prolonged to 42 hours for our proteins, and step 6 can be extended to 3 hours for our proteins.
TROUBLESHOOTING
-
Step 1, observed at Step 9
Problem: Low number of beads in all wells for a particular bead set.
Possible reason: Poor bead suspension.
Solution: Mix the stock suspensions gently, taking care not to create foam, for 1 minute, and then fill a ‘clear’ screw cap microcentrifuge tube half full with a given set (level of red fluorescence) of GSH beads, so that good suspension of the bead stocks can be observed. The suspensions can also be sonicated for 20-30 sec in a bath sonicator.
-
Step 6, observed at Step 9
Problem: The bead number is low in some wells for one or more sets of beads.
Possible reason 1: For some proteins, the coated beads may stick to the polystyrene walls.
Solution: Beads may be viewed in wells through an inverted microscope; these beads are the same size as platelets, and settle very slowly, but are easily seen in suspension and on the bottom of wells. Passivate (block) the surfaces of the plates with Tween-20 and BSA for 20 min. Increasing the sampling sip time from 0.9 s to 1.3 s doubled the number of beads sampled per well.
Possible reason 2: HyperCyt™ probe or tubing is clogging.
Solution: Change the probe and tubing. Each day rinse the system for 20 min with buffer containing detergent. Large clumps of beads or cells will sporadically break off and be recorded by the cytometer, but the frequency and size of these will decrease. A sign of back pressure on the flow stream is that the air gaps between slugs of beads in the peristaltic pump tubing are much shorter (i.e., more compressed) on the cytometer side of the pump than on the plate side of the pump. Clumps of particles can also accumulate on the larger diameter plastic tubing as it leaves the short steel connector tube to enter the cytometer. Removing the steel connector should allow the pressurized cytometer sheath fluid to back out of the plastic tubing, and if it is still clogged, cut off a centimeter of tubing to obtain flow, and then reconnect HyperCyt™.
Possible reason 3: There is a Biomek error in pipeting.
Solution: Load the plate again. This is quite uncommon with proper daily maintenance.
-
Step 7
Problem: Poor resolution of the 7 separate bead types.
Possible reasons: The red laser may need to be aligned, or may be using a suboptimal delay time in milliseconds from the forward scatter trigger for acquisition.
Solution: Align the red laser, and if necessary, optimize the delay time. We have observed delay time to change when the brand of sheath fluid, and thus viscosity, is changed.
-
Step 9
Problem: Fluorescence intensity is low for the first few wells.
Possible reason: The fluorophore is lost by adsorption to the HyperCyt™ sample tubing walls.
Solution: Run more fluorophore through the tubing to equilibrate fluorophore adsorption just before starting a plate.
-
Step 10
Problem 1: A pattern of too few beads exists across one or more rows of the plate.
Possible reason: One or more of the tips on the eight tip pod on the Biomek is inaccurate.
Solution: Remove bubbles from the pressure tubing on the Biomek, and use a new set of tips.
Problem 2: Events remain high, but fluorescence decreases across a plate.
Possible reason: The level of F-Bim in the Biomek is too low or the F-Bim plate is tilted.
Solution: Use 20 ml of F-Bim in a single well plate for the Biomek as a minimum, and level the plate.
Problem 3: A number of wells in a row have higher fluorescence intensity than the negative control in all bead sets.
Possible reason: A compound has high fluorescence, which bleeds to the next wells.
Solution: Run the row or plate backwards, or program HyperCytSampler to designate the first highly fluorescent well to be the last well sampled for that plate.
ANTICIPATED RESULTS
The purpose of a screen is to identify molecules that will enhance or diminish the interactions between biological molecules in a cost-effective fashion. In the literature, an assay describing the binding between any two entities will be found to differ with respect to time, temperature, ionic conditions and source of materials from different laboratories. The basic conditions to be met for a screen are a) a binding curve that reproduces a Kd that was found by others, and b) a competition dose-response series using a known competitor that reproduces an EC50 value that was found by others, with due respect for nonspecific binding; both these criteria were met in this protocol as shown in Fig. 2.
There is a potential for the screened compounds to inhibit the GSH to GST interaction, and compounds that give an identical dose-response curve for all six proteins are checked. If the compound inhibits the binding of 2 nM GST-GFP to uncoated beads, the data are inconclusive, and the competitor is flagged as a potential GSH to GST inhibitor and/or as a possibly promiscuous protein binder, i.e., a false positive. For this determination, 2 nM GST-GFP should be incubated overnight with the beads as in Step 2, giving beads coated with GST-GFP. Then the assay can be carried out with and without addition of suspect compounds. We recognize as active compounds (compounds that have activity in the assay and no significant activity in counterscreen assays that don’t involve GST-GFP interactions as an assay component) only those molecules that weakly interfere (based on magnitude and affinity) with GST-GFP fluorescence compared to the target F-Bim fluorescence.
During assay development with relatively few beads, the loss of beads due to adsorption on pipet tips and tube walls can become overwhelming, e.g., expecting 20,000 beads in a well, yet counting only 200 at the cytometer. We suggest the use of 0.01 to 0.1% detergent in the buffer to minimize adsorptive losses. Our ‘blocking’ of the beads in Step 1 contributes to this function among others.
In summary, we believe that this assay gives results comparable to the more commonly used fluorescence polarization and time-resolved fluorescence resonance energy transfer methods, with the advantage of the ability to multiplex data from a series of protein targets, including uncoated GSH beads as a measure of control for non-specific fluorescence due to fluorescent compound adsorption.
Supplementary Material
Acknowledgments
This work was supported by NIH grants 1X01 MHO79850-01, CA113318, and U54 MH074425/MH084960, the New Mexico Molecular Libraries Screening Center/University of New Mexico Center for Molecular Discovery, and the University of New Mexico Shared Flow Cytometry Resource and Cancer Research and Treatment Center (P30 CA118100). We acknowledge the contributions of Ramona Halip, Cristian Bologa, and Tudor Oprea to the analysis of primary and dose-response screens.
Footnotes
AUTHOR CONTRIBUTIONS P.C.S., method of glutathione bead synthesis and assay development, manuscript preparation; S.M.Y., assay development and implementation; M.B.C., instrument programming and maintenance; A.W., analysis spreadsheets for screening and dose-response; D.Z., fusion protein creation and purification; J.C.R., leader of Burnham team investigating Bcl-2 family and conceptualization of assay; B.S.E., leader of NMMLSC/UNMCMD high throughput screening core and codeveloper of HyperCyt™ platform; L.A.S., NMMLSC/UNMCMD principal investigator, manuscript preparation, codeveloper of HyperCyt™ platform, and target assay conceptualization.
COMPETING INTERESTS STATEMENT The authors B.S.E. and L.A.S. declare competing financial interests as coinventors of HyperCyt™ and cofounders of IntelliCyt Corporation.
Contributor Information
Peter C Simons, Email: psimons@salud.unm.edu.
Susan M Young, Email: smyoung@salud.unm.edu.
Mark B Carter, Email: mbcarter@salud.unm.edu.
Anna Waller, Email: awaller@salud.unm.edu.
Dayong Zhai, Email: dyzhai@burnham.org.
John C Reed, Email: jreed@burnham.org.
Bruce S Edwards, Email: bedwards@salud.unm.edu.
References
- 1.Gad SC. Drug Discovery Handbook. John Wiley and Sons; Hoboken: 2005. [Google Scholar]
- 2.Edwards BS, Young SM, Oprea TI, Bologa CG, Prossnitz ER, Sklar LA. Biomolecular screening of formylpeptide receptor ligands with a sensitive, quantitative, high-throughput flow cytometry platform. Nat Protoc. 2006;1:59–66. doi: 10.1038/nprot.2006.9. [DOI] [PubMed] [Google Scholar]
- 3.Tsujimoto Y, Cossman J, Jaffe E, Croce CM. Involvement of the bcl-2 gene in human follicular lymphoma. Science. 1985;228:1440–1443. doi: 10.1126/science.3874430. [DOI] [PubMed] [Google Scholar]
- 4.Bakhshi A, Jensen JP, Goldman P, Wright JJ, McBride OW, Epstein AL, Korsmeyer SJ. Cloning the chromosomal breakpoint of t(14;18) human lymphomas: clustering around JH on chromosome 14 and near a transcriptional unit on 18. Cell. 1985;41:899–906. doi: 10.1016/s0092-8674(85)80070-2. [DOI] [PubMed] [Google Scholar]
- 5.Cleary ML, Smith SD, Sklar J. Cloning and structural analysis of cDNAs for bcl-2 and a hybrid bcl-2/immunoglobulin transcript resulting from the t(14;18) translocation. Cell. 1986;47:19–28. doi: 10.1016/0092-8674(86)90362-4. [DOI] [PubMed] [Google Scholar]
- 6.Youle RJ, Strasser A. The BCL-2 protein family: opposing activities that mediate cell death. Nat Rev Mol Cell Biol. 2008;9:47–59. doi: 10.1038/nrm2308. [DOI] [PubMed] [Google Scholar]
- 7.Sattler M, Liang H, Nettesheim D, Meadows RP, Harlan JE, Eberstadt M, Yoon HS, Shuker SB, Chang BS, Minn AJ, Thompson CB, Fesik SW. Structure of Bcl-xL-Bak peptide complex: recognition between regulators of apoptosis. Science. 1997;275:983–986. doi: 10.1126/science.275.5302.983. [DOI] [PubMed] [Google Scholar]
- 8.Chen L, Willis SN, Wei A, Smith BJ, Fletcher JI, Hinds MG, Colman PM, Day CL, Adams JM, Huang DC. Differential targeting of prosurvival Bcl-2 proteins by their BH3-only ligands allows complementary apoptotic function. Mol Cell. 2005;17:393–403. doi: 10.1016/j.molcel.2004.12.030. [DOI] [PubMed] [Google Scholar]
- 9.Adams JM, Cory S. The Bcl-2 apoptotic switch in cancer development and therapy. Oncogene. 2007;26:1324–1337. doi: 10.1038/sj.onc.1210220. [DOI] [PMC free article] [PubMed] [Google Scholar]
- 10.Reed JC, Pellecchia M. Apoptosis-based therapies for hematologic malignancies. Blood. 2005;106:408–418. doi: 10.1182/blood-2004-07-2761. [DOI] [PubMed] [Google Scholar]
- 11.Zhai D, Jin C, Satterthwait AC, Reed JC. Comparison of chemical inhibitors of antiapoptotic Bcl-2-family proteins. Cell Death Differ. 2006;13:1419–1421. doi: 10.1038/sj.cdd.4401937. [DOI] [PubMed] [Google Scholar]
- 12.Nakamura K, Zawistowski JS, Hughes MA, Sexton JZ, Yeh LA, Johnson GL, Scott JE. Homogeneous time-resolved fluorescence resonance energy transfer assay for measurement of Phox/Bem1p (PB1) domain heterodimerization. J Biomol Screen. 2008;13:396–405. doi: 10.1177/1087057108318281. [DOI] [PubMed] [Google Scholar]
- 13.Owicki JC. Fluorescence polarization and anisotropy in high throughput screening: perspectives and primer. J Biomol Screen. 2000;5:297–306. doi: 10.1177/108705710000500501. [DOI] [PubMed] [Google Scholar]
- 14.Carson RT, Vignali DA. Simultaneous quantitation of 15 cytokines using a multiplexed flow cytometric assay. J Immunol Methods. 1999;227:41–52. doi: 10.1016/s0022-1759(99)00069-1. [DOI] [PubMed] [Google Scholar]
- 15.Simons PC, Young SM, Gibaja V, Lee WC, Josiah S, Edwards BS, Sklar LA. Duplexed, bead-based competitive assay for inhibitors of protein kinases. Cytometry A. 2007;71:451–459. doi: 10.1002/cyto.a.20398. [DOI] [PubMed] [Google Scholar]
- 16.Tessema M, Simons PC, Cimino DF, Sanchez L, Waller A, Posner RG, Wandinger-Ness A, Prossnitz ER, Sklar LA. Glutathione-S-transferase-green fluorescent protein fusion protein reveals slow dissociation from high site density beads and measures free GSH. Cytometry A. 2006;69:326–334. doi: 10.1002/cyto.a.20259. [DOI] [PubMed] [Google Scholar]
- 17.Bartsch JW, Tran HD, Waller A, Mammoli AA, Buranda T, Sklar LA, Edwards BS. An investigation of liquid carryover and sample residual for a high-throughput flow cytometer sample delivery system. Anal Chem. 2004;76:3810–3817. doi: 10.1021/ac049870f. [DOI] [PubMed] [Google Scholar]
Associated Data
This section collects any data citations, data availability statements, or supplementary materials included in this article.