Abstract
Two kinds of individual eye models, involving and without involving the angle between visual axis and optical axis, are established by means of optical design. We use them to study the properties of the transverse chromatic aberration (TCA) and longitudinal chromatic aberration (LCA) over the visible spectrum. Then the effects of the LCA and TCA on the visual quality of human eyes are evaluated. The statistical averages of TCA and LCA over the visible spectrum for Chinese myopic eyes are obtained. Results show that both TCA and LCA restrict the visual performance, and LCA is more detrimental than TCA.
OCIS codes: (330.7326) Visual optics, modeling; (330.7325) Visual optics, metrology; (330.4595) Optical effects on vision
1. Introduction
In recent years, there has been an increased interest in the study of the visual quality, especially the aberrations of human eyes. The human eye's optical media exhibit significant chromatic dispersion [1], which is detrimental to visual performance. It is common to separate the chromatic aberration in longitudinal chromatic aberration (LCA), and transverse chromatic aberration (TCA). LCA manifests as a change in the focal point as a function of the wavelength and is also referred to as chromatic focal shift, while TCA occurs when chief rays of the spectrum passing through the center of the pupil strike on the retinal surface at different positions.
The LCA has been studied for a long time. In 1947, Wald and Griffin [2] measured the LCA of 14 eyes over the spectrum from 405nm to 750nm and found that the average magnitude is about 2.32D. This study proceeded over a broad spectrum mostly covering the visible spectrum, but it is inevitable to introduce subjective error in the process of subjective participation. With the development of wavefront technology, it is possible to measure the LCA objectively. In 1999, Susana Marcos et al. [3] obtained the magnitude of LCA through measuring the wavefront aberration and it was about 1.26D over the spectrum from 450nm to 650nm.
For the measurement of TCA, two-color, vernier alignment technique is the most common. In 1995, Rynders [4] obtained the statistical distribution of the subjective TCA for 170 eyes over the spectrum from 497nm to 605nm by means of a two-dimensional, two-color, vernier alignment technique. Through rearranging to make the horizontally oriented lines and vertically oriented lines in the same target, it is allowed to measure horizontal TCA and vertical TCA respectively. Results show that the absolute magnitude of TCA is 0.82arcmin in average. However, this experiment needs the participation of subjects, and only the TCA over the fixed spectrum band can be obtained while this spectrum band does not cover the visible spectrum properly.
Furthermore, several studies attempted to evaluate the effect of the LCA and TCA on the visual quality. Susana Marcos et al. [3] theoretically computed the effect of LCA and TCA on the visual quality and evaluated which one was more detrimental to the visual performance of human eye. They found that TCA could degrade the visual quality as much as LCA. Correcting TCA and leaving LCA uncorrected could improve the visual quality more than correcting the LCA and leaving the TCA uncorrected.
In this paper, two kinds of individual eye models, with and without involving the angle between visual axis and optical axis are established for 80 myopic eyes with the optical design software ZEMAX, combined with the measurement data of subjects including wavefront aberrations, axial lengths and corneal topography. With the eye models, we investigate the properties of the TCA and LCA over the visible spectrum from 400nm to 760nm and evaluate the effects on visual quality. This method is objective, which avoids possible errors of subjective measurements.
It is reported clinically that the patients who have received refractive surgery may possess a varied color perception. Therefore it is meaningful to statistically investigate the chromatic aberrations of myopic eyes before and after the surgery. This paper shows our preliminary results in this aspect.
2. Methods
A group of 80 eyes (41 OD and 39 OS) of 46 Chinese subjects is selected. Among them 68 eyes are from 34 subjects. All of these eyes are myopic with spherical refractions in the range of −0.75D to −8.5D. The subjects have neither ocular disease nor corneal surgery. The wavefront aberrations and the corneal topographies are respectively measured by Hartmann-Shack wavefront aberrometer [5] – Wavescan (VISX, Santa Clara, CA, USA) and Pentacam (Oculus GmbH, Wetzlar, Germany) in the case of darkroom with natural pupils of the diameter range from 6mm to 7.5mm. During the measurements, subjects are asked to stare at the target in the apparatus to make the visual axis of the eye coincident with the optical axis of the apparatus. The axial lengths are measured by the Ultrasonic A/B Scanner (MEDA Co., Tianjin, China). We construct two kinds of individual eye models, involving and without involving the angle between visual axis and optical axis, with the measurement data to investigate the properties of the TCA and the LCA respectively.
2.1 Construction of the fundamental eye model
Considering the characteristics of Gullstrand-Le Grand eye model [6] and Liou eye model [7] comprehensively, we choose the former, because the anterior lens surface of Liou eye model is over-bent in accommodation. On the other hand, Gullstrand-Le Grand eye model is realistic, in accommodation, with the curvature radius of anterior lens surface varying from 6.0mm to 10.2mm [8]. Due to the intrinsic defocus of Gullstrand-Le Grand eye model, we improve the original eye model with the help of ZEMAX. The eye model is optimized by setting the thicknesses of vitreous and the “conic” of the posterior lens surface as variables. After optimization, the eye model generates an ideal Airy disc, with the Modulation Transfer Function (MTF) close to diffraction limit curve. Table 1 shows the structural parameters of the improved Gullstrand-Le Grand eye model, the fundamental eye model, in details. In the next sections we use the fundamental eye model to establish the individual eye models which are with defocus, astigmatism and other aberrations.
Table 1. Structural parameters of the fundamental eye model.
| Surface | Curvature Radius (mm) | Conic | Thickness (mm) | Refractive Index (555nm) |
|---|---|---|---|---|
| Anterior Cornea | 7.8 | 0 | 0.55 | 1.3647 |
| Posterior Cornea | 6.5 | 0 | 3.05 | 1.3254 |
| Anterior Lens | 10.2 | 0 | 4.0 | 1.4072 |
| Posterior Lens | −6 | −9.65 | 16.66 | 1.3240 |
| Retina | −12.5 | 0 |
2.2 Study on LCA by the individual eye model of visual axis coincident with optical axis
Corneal surface is the most powerful refracting surface in the eye, providing 2/3 of the eye’s focusing power. Especially, the angle between visual axis and optical axis is determined by the shape of the corneal surface [9]. In this research, curvature radii and elevation maps of corneal surfaces are obtained with Pentacam. The Pentacam is a rotating Scheimpflug camera and the rotational measuring procedure generates Scheimpflug images. It calculates 3-dimensional model of the anterior eye segment from 25000 true elevation points. The elevation of corneal surface can be expressed as the Zernike Fringe Sag type [10], expressed as:
| (1) |
Where c is the corneal surface curvature provided by Pentacam, is the Zernike Fringe polynomial, is the coefficient on the Zernike Fringe polynomial, N is the number of Zernike coefficients in the series and is a constant. The fitting procedure is implemented with MATLAB. To build up the individual eye model, we substitute the curvature radii and elevation data of the anterior and posterior corneal surfaces for the correspondent surface data in the fundamental eye model.
The thicknesses of cornea, anterior chamber and vitreous in the fundamental eye model are then substituted with the correspondent measurement values of the axial lengths provided by the ultrasonic thickness gauge.
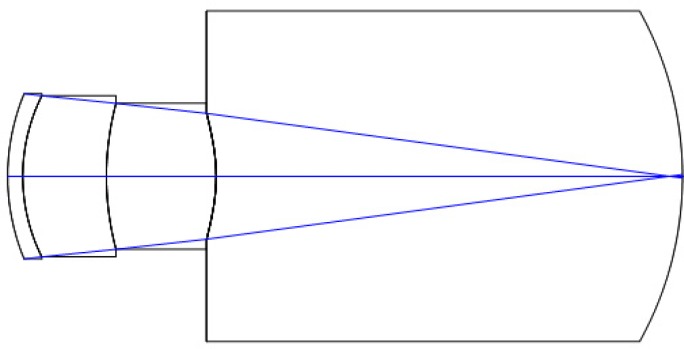
In ZEMAX, we set entrance pupil diameter to be 6mm and wavelength to be 555nm for the eye model. One of the procedures of building up individual eye model is to transfer the wavefront aberrations to the fundamental eye model [11]. In the measurement of wavefront aberrations, the pupil diameters of subjects are different. To ensure the consistency, a conversion of aberrations from the actual pupil diameter to the fixed pupil diameter of 6mm is carried out by programming in MATLAB. Although it is more correct to take the wavefront aberrations over the actual pupil diameter in the first place, the error introduced by the conversion is quite small [12]. In order to make the wavefront aberrations of the eye model equal to that of the actual eye, we take the aberrations as the target of the merit function and optimize the anterior surface of the crystalline lens of the eye model. In this way the individual eye model of visual axis coincident with optical axis is established. Figure 1 shows the layout of the model. It can be seen that there is an obvious defocus due to the myopia.
Fig. 1.
Individual eye model of visual axis coincident with optical axis.
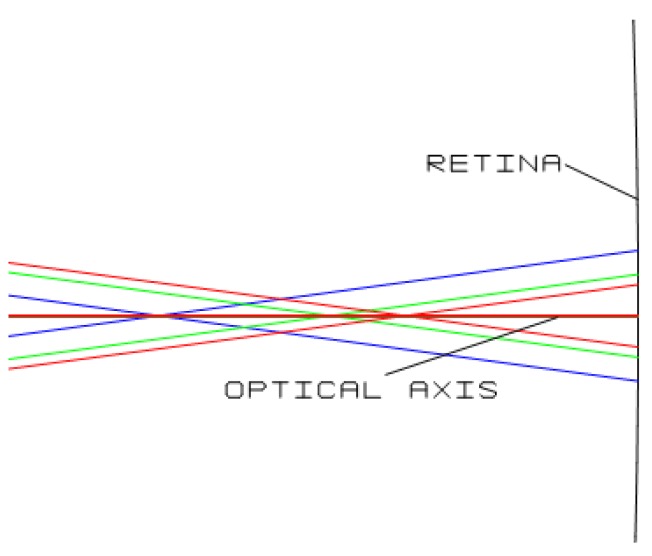
To investigate the properties of LCA over the visible spectrum, the working spectrum of eye model is set from 400nm to 760nm with the primary wavelength of 555nm. Figure 2 shows the LCA of the individual eye model over the visible spectrum by means of ray trace. The ray of primary wavelength (green) does not focus to the image surface (retina) exactly because of myopia, and the ray of 400nm (blue) focuses in front of the focal point of the ray of primary wavelength while the ray of 760nm (red) focuses in the behind. The distance between focal points is the magnitude of LCA over the visible spectrum.
Fig. 2.
LCA of the individual eye model.
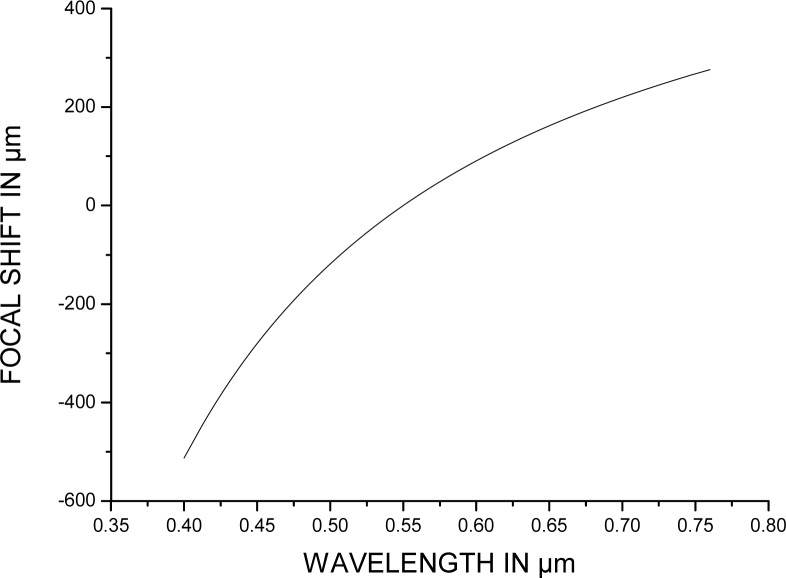
In ZEMAX, the chromatic focal shift plot shows the distance between the focal point of the ray at certain wavelength and that at the primary wavelength with unit of μm, which represents the LCA. Figure 3 is the plot of an individual eye model where abscissa is the wavelength and the ordinate is the chromatic focal shift. It can be seen that the trend of LCA is flatter in long wavelengths band compared to that in short wavelengths band.
Fig. 3.
Chromatic focal shift plot of individual eye model.
In term of the Newton formula, we can also express the LCA with refraction in diopters (D):
| (2) |
Where is the magnitude of the chromatic focal shift over the visible spectrum, fand are the focal length in object space and in image space respectively.
The effect of LCA on the image quality of human eyes is the expansion of the image spot on retina. Ideally, the image spot of the ray of primary wavelength (555nm) ought to be airy disk in the case of diffraction limitation. The existence of LCA enlarges the scale of image spot. The relational expression of the diameter of the spot as the chromatic focal shift is [13]:
| (3) |
Where d is the diameter of spot, L is the entrance pupil diameter,f is the focal length in object space, and is the magnitude of chromatic focal shift over the spectrum from 400nm to 555nm or from 555nm to 760nm. We choose the one yielding bigger image spot on retina as reference. The calculation is under the photopic condition (L = 3mm).
2.3 Study on TCA by the individual eye model involving the angle between visual and optical axis
The visual axis of human eye does not coincide with the optical axis, so the TCA is not zero at the fovea. The angle between visual axis and optical axis is determined by the elevation data of the anterior corneal surface [9]. The raw elevation data measured by Pentacam can be fit to a parametric model, expressed as the sum of two terms:
| (4) |
Where is a regular basis representing the overall shape of the corneal surface, and is a residual, accounting for irregularities and departures from the overall shape of the basis. It is reasonable to choose the best fitting shape of the corneal surface as the basis and make the residual as low as possible. In this way, the analysis of the basis will provide meaningful overall properties. From earlier studies, the overall shape of the corneal surface is close to ellipsoid [14]. To fit the basis properly, we use the Cartesian coordinate system and set the z-axis of the coordinate system along the visual axis. In this coordinate system, the basis surface can be expressed as a general quadric format:
| (5) |
Then we set a new coordinate system in which the quadric takes its canonical form expressed as:
| (6) |
The center of the ellipsoid is the origin of this coordinate, with three axes along three orthogonal axes of the ellipsoid and the -axis along the optical axis. We transform the general quadric system to the canonical system by means of orthogonal transformation, including one rotation and one translation. The rotation angle is just equivalent to the angle between visual axis and optical axis. This fitting procedure is implemented with MATLAB.
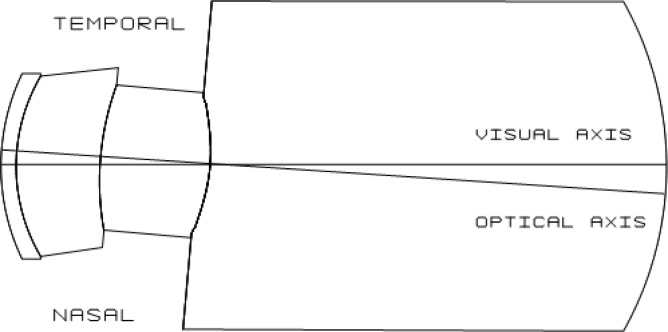
We separate the angle into horizontal and vertical component, and set the angles for the eye model in horizontal and vertical direction respectively. The visual axis and optical axis of human eye cross near the nodal point, which is generally around the posterior surface of lens. So we set the center of posterior lens surface as the center of rotation. Figure 4 is the layout of the individual eye model involving the angle. In this optical system the visual axis trends to the nasal side with respect to the optical axis.
Fig. 4.
Individual eye model involving the angle.
The working spectrum of eye model is set from 400nm to 760nm with the primary wavelength of 555nm. Due to the visual axis and optical axis are misaligned, chief rays of the spectra passing through the center of the pupil strike on the retinal surface at different intersections. The distance between intersections is the magnitude of TCA. We appoint the signs of TCA as follows: in the horizontal direction, if the intersection for the short wavelength is on the left of that for the long wavelength, the sign is positive. In the vertical direction, if the intersection for the short wavelength is on the top of that for the long wavelength, the sign is positive. With this appointments, the orientation of the visual axis for right eyes trends to the nasal side with respect to optical axis when the sign of the horizontal TCA is negative, otherwise the orientation of the visual axis trends to the temporal side. For the left eyes the results are opposite. In the vertical direction the orientation of the visual axis trends to the up side with respect to optical axis if the sign of the vertical TCA is positive, otherwise the orientation of the visual axis trends to down side.
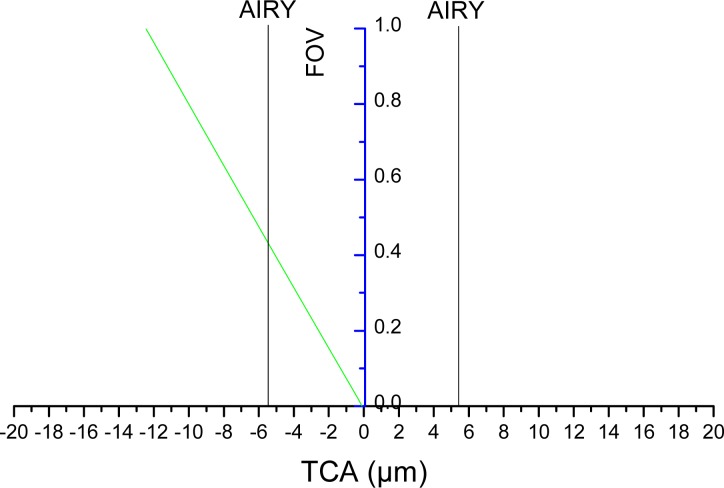
In ZEMAX, the lateral color plot provides the magnitude of TCA. Figure 5 is the lateral color plot of the individual eye model where the abscissa indicates the magnitude of TCA (μm) and the ordinate represents the field of view (FOV) with 1.0 standing for the whole FOV. In this case, the angle between visual axis and optical axis is obtained by means of orthogonal transformation, which is 4.64° in horizontal direction and 1.5° in vertical direction. Therefore, we set 4.64° FOV in X-direction and 1.5° FOV in Y-direction for the eye model. The black lines show the scale of airy disk under the photopic condition.
Fig. 5.
Lateral color plot of individual eye model.
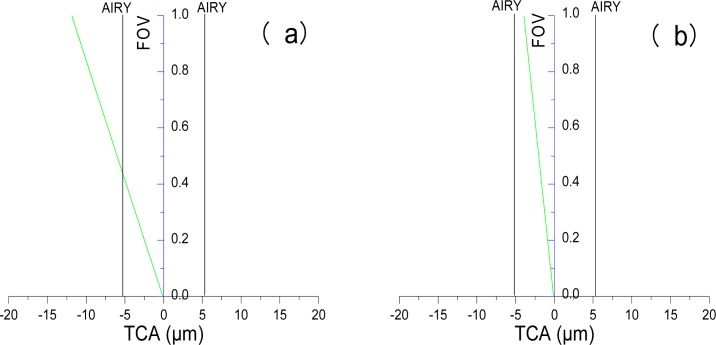
The magnitude of horizontal or vertical TCA can be obtained by setting FOV in the correspondent direction only. Figures 6(a) and 6(b) are the lateral color plots with the set of 4.64° FOV in X-direction and the set of 1.5° FOV in Y-direction respectively.
Fig. 6.
Lateral color plot of individual eye model, (a) 4.64°FOV in X-direction, (b) 1.5°FOV in Y-direction.
3. Results
3.1 Statistical results of TCA
TCA over the visible spectrum from 400nm to 760nm of 80 eyes with myopia are investigated based on the individual eye model involving the angle, and the results of horizontal, vertical and the absolute TCA are listed in columns 4 to 7 in Table 2. The magnitudes are read from “lateral color”, and the signs are obtained by ray tracing. Besides, the spherical refractions (Ps) and the cylinder refractions (Pc) are listed in columns 2 and 3, respectively. To evaluate the effect of the TCA on the visual quality of human eyes, the diameters of airy disk under the photopic condition are also listed in column 8. The last two rows give the average and the maximum values respectively.
Table 2. Statistics of spherical refraction (Ps), cylinder (Pc), horizontal TCA in arcmin, vertical TCA in arcmin, absolute TCA in arcmin, absolute TCA in μm, diameters of airy disk, chromatic focal shift, LCA in D, and diameter of image spot caused by LCA over the visible spectrum under the photopic condition.
| NO. | Ps (D) | Pc (D) | Hor. TCA (arcmin) | Vert. TCA (arcmin) | Abs. TCA (arcmin) | Abs. TCA (μm) | Dia. of airy disk (μm) | Chr. focal shift (μm) | LCA (D) | Dia. of image spot (mm) |
|---|---|---|---|---|---|---|---|---|---|---|
| 1 | −7.00 | −1.00 | −2.11 | 1.76 | 2.75 | 15.76 | 8.27 | 801 | 2.07 | 70.28 |
| 2 | −6.00 | −2.00 | −0.70 | 0.13 | 0.71 | 3.96 | 7.99 | 807 | 2.06 | 70.22 |
| 3 | −3.75 | 0 | −0.56 | −1.83 | 1.91 | 10.25 | 7.90 | 784 | 2.12 | 70.38 |
| 4 | −5.00 | −1.00 | −1.16 | 0.85 | 1.44 | 7.44 | 7.74 | 791 | 2.11 | 70.6 |
| 5 | −4.50 | 0 | −1.73 | 1.56 | 2.33 | 11.19 | 7.97 | 781 | 2.11 | 70.13 |
| 6 | −3.75 | 0 | −1.65 | 0.00 | 1.65 | 8.40 | 7.57 | 779 | 2.13 | 70.23 |
| 7 | −4.75 | −1.25 | −1.22 | 0.29 | 1.26 | 6.89 | 7.99 | 754 | 2.23 | 70.92 |
| 8 | −6.00 | −1.00 | −1.15 | 0.89 | 1.45 | 7.34 | 7.38 | 774 | 2.16 | 70.67 |
| 9 | −8.50 | −1.75 | −1.24 | −1.26 | 1.77 | 10.39 | 8.33 | 772 | 2.15 | 70.27 |
| 10 | −5.00 | −1.00 | −1.62 | 1.08 | 1.95 | 9.96 | 7.52 | 792 | 2.1 | 70.4 |
| 11 | −4.25 | 0 | −0.64 | −0.20 | 0.67 | 3.67 | 8.07 | 796 | 2.1 | 70.53 |
| 12 | −5.25 | −0.75 | −0.57 | 0.11 | 0.58 | 3.26 | 8.13 | 743 | 2.22 | 69.98 |
| 13 | −3.50 | −1.00 | −1.00 | 2.13 | 2.36 | 12.26 | 7.74 | 740 | 2.24 | 70.15 |
| 14 | −8.00 | −0.75 | −1.66 | 1.25 | 2.08 | 11.28 | 7.88 | 789 | 2.09 | 69.64 |
| 15 | −5.50 | −1.25 | −2.06 | 0.32 | 2.08 | 10.32 | 7.39 | 789 | 2.08 | 69.84 |
| 16 | −5.25 | 0 | −2.69 | 0.97 | 2.86 | 15.09 | 7.75 | 775 | 2.17 | 70.91 |
| 17 | −4.50 | −1.25 | −0.72 | 0.50 | 0.88 | 4.74 | 8.04 | 769 | 2.19 | 70.75 |
| 18 | −3.50 | −1.25 | −2.33 | 1.41 | 2.72 | 14.49 | 7.88 | 798 | 2.08 | 70.49 |
| 19 | −6.25 | 0 | −1.58 | −1.41 | 2.11 | 11.12 | 7.69 | 801 | 2.08 | 70.41 |
| 20 | −8.50 | −1.00 | −0.09 | −0.33 | 0.34 | 1.96 | 8.13 | 807 | 2.07 | 70.64 |
| 21 | −3.25 | −2.75 | −0.42 | 0.06 | 0.43 | 2.32 | 8.12 | 800 | 2.09 | 70.62 |
| 22 | −6.25 | −2.00 | −1.20 | 1.35 | 1.81 | 10.98 | 8.54 | 786 | 2.13 | 70.69 |
| 23 | −6.00 | −0.75 | −1.82 | 0.06 | 1.82 | 9.00 | 7.27 | 792 | 2.09 | 70.21 |
| 24 | −5.00 | 0 | −1.75 | 0.98 | 2.01 | 10.66 | 7.77 | 766 | 2.13 | 69.71 |
| 25 | −7.50 | 0 | −2.42 | 1.47 | 2.83 | 14.99 | 7.61 | 769 | 2.15 | 70.16 |
| 26 | −5.50 | −1.00 | −0.80 | 0.17 | 0.82 | 4.30 | 7.75 | 730 | 2.23 | 69.67 |
| 27 | −4.75 | 0 | −0.52 | −0.14 | 0.54 | 3.10 | 8.29 | 729 | 2.23 | 69.62 |
| 28 | −5.25 | −0.75 | −1.31 | 0.90 | 1.59 | 8.13 | 7.47 | 796 | 2.1 | 70.46 |
| 29 | −3.00 | 0 | −0.59 | −0.94 | 1.11 | 5.66 | 7.68 | 794 | 2.13 | 71.1 |
| 30 | −4.50 | −1.00 | −2.25 | 1.28 | 2.59 | 13.12 | 7.52 | 800 | 2.09 | 70.59 |
| 31 | −3.25 | −2.75 | −1.86 | 0.31 | 1.88 | 9.73 | 7.74 | 791 | 2.08 | 70.05 |
| 32 | −5.50 | −1.00 | −1.81 | −0.39 | 1.85 | 9.92 | 8.06 | 820 | 2.1 | 71.72 |
| 33 | −5.75 | −2.00 | −1.44 | −1.44 | 2.04 | 11.46 | 8.01 | 806 | 2.1 | 71.09 |
| 34 | −8.25 | −1.00 | −1.58 | 1.29 | 2.04 | 12.01 | 8.35 | 796 | 2.23 | 70.29 |
| 35 | −7.00 | −1.00 | −0.69 | 0.99 | 1.21 | 6.69 | 7.96 | 765 | 2.18 | 70.5 |
| 36 | −5.00 | 0 | −1.55 | 0.59 | 1.66 | 8.99 | 7.94 | 774 | 2.14 | 70.23 |
| 37 | −3.25 | 0 | −1.15 | 0.62 | 1.31 | 6.80 | 7.78 | 771 | 2.13 | 69.91 |
| 38 | −5.25 | −1.00 | −1.11 | 0.24 | 1.14 | 6.14 | 7.84 | 785 | 2.09 | 69.83 |
| 39 | −5.25 | 0 | −1.82 | 0.19 | 1.83 | 9.85 | 7.64 | 797 | 2.05 | 69.74 |
| 40 | −5.25 | −1.00 | −0.52 | 0.33 | 0.61 | 3.19 | 7.20 | 824 | 2.13 | 73.95 |
| 41 | −7.00 | −2.00 | −1.70 | −1.62 | 2.35 | 11.88 | 7.01 | 827 | 2.03 | 70.95 |
| 42 | −6.75 | −1.25 | 1.27 | −0.49 | 1.36 | 7.82 | 8.24 | 731 | 2.23 | 69.63 |
| 43 | −6.25 | −1.00 | 1.42 | −1.40 | 1.99 | 10.54 | 7.84 | 731 | 2.26 | 69.29 |
| 44 | −3.75 | 0 | 1.60 | 0.68 | 1.74 | 8.92 | 7.59 | 784 | 2.15 | 70.87 |
| 45 | −5.75 | −1.00 | 1.46 | −0.34 | 1.50 | 8.32 | 8.04 | 783 | 2.14 | 70.63 |
| 46 | −7.00 | −1.00 | 1.29 | 0.84 | 1.54 | 7.88 | 7.48 | 785 | 2.13 | 70.71 |
| 47 | −7.75 | −1.75 | 1.48 | −0.44 | 1.55 | 8.86 | 8.22 | 758 | 2.19 | 70.3 |
| 48 | −3.75 | 0 | 2.35 | 0.74 | 2.47 | 12.37 | 7.50 | 756 | 2.21 | 70.59 |
| 49 | −3.75 | −1.00 | 1.09 | −0.28 | 1.12 | 6.09 | 8.01 | 782 | 2.14 | 70.59 |
| 50 | −4.75 | 0 | 1.21 | −0.45 | 1.29 | 6.84 | 7.99 | 782 | 2.15 | 70.82 |
| 51 | −4.00 | 0 | 2.31 | 0.50 | 2.36 | 12.38 | 7.90 | 820 | 2.06 | 71.09 |
| 52 | −7.25 | −1.00 | 2.28 | −2.20 | 3.17 | 16.69 | 7.71 | 825 | 2.13 | 74.2 |
| 53 | −6.25 | 0 | 0.99 | 0.24 | 1.02 | 5.04 | 7.37 | 772 | 2.2 | 71.32 |
| 54 | −4.50 | 0 | 2.30 | −1.75 | 2.89 | 15.20 | 7.84 | 772 | 2.18 | 70.99 |
| 55 | −5.25 | 0 | 1.03 | −0.92 | 1.38 | 7.51 | 7.98 | 781 | 2.13 | 70.45 |
| 56 | −0.75 | −1.25 | 2.18 | −1.27 | 2.53 | 12.73 | 7.69 | 787 | 2.09 | 69.95 |
| 57 | −6.25 | −1.00 | 1.30 | 1.24 | 1.79 | 9.41 | 7.62 | 781 | 2.16 | 70.94 |
| 58 | −3.25 | −2.75 | 1.88 | 1.59 | 2.46 | 12.56 | 7.77 | 772 | 2.13 | 70.05 |
| 59 | −6.75 | −1.00 | 1.57 | 0.79 | 1.76 | 10.64 | 8.52 | 780 | 2.13 | 70.24 |
| 60 | −6.50 | −1.00 | 0.50 | −0.02 | 0.50 | 2.50 | 7.36 | 790 | 2.07 | 69.85 |
| 61 | −5.00 | 0 | 1.72 | −1.44 | 2.25 | 12.00 | 7.76 | 782 | 2.12 | 70.16 |
| 62 | −2.75 | 0 | 0.89 | −0.69 | 1.12 | 5.70 | 7.65 | 797 | 2.12 | 70.86 |
| 63 | −7.00 | −1.25 | 2.76 | −1.35 | 3.08 | 16.14 | 7.52 | 793 | 2.09 | 69.78 |
| 64 | −5.75 | −1.00 | 1.29 | −0.51 | 1.39 | 7.32 | 7.73 | 780 | 2.09 | 69.57 |
| 65 | −4.75 | 0 | 0.71 | 0.33 | 0.78 | 4.52 | 8.37 | 788 | 2.12 | 70.47 |
| 66 | −5.25 | 0 | 1.05 | −0.64 | 1.24 | 6.33 | 7.54 | 778 | 2.12 | 70.13 |
| 67 | −2.75 | 0 | 0.43 | −1.14 | 1.22 | 6.20 | 7.82 | 792 | 2.11 | 70.47 |
| 68 | −5.25 | −1.00 | 0.62 | 1.23 | 1.38 | 7.38 | 7.87 | 788 | 2.12 | 70.64 |
| 69 | −5.00 | −1.50 | 2.21 | −0.84 | 2.36 | 12.41 | 7.82 | 790 | 2.12 | 70.71 |
| 70 | −5.25 | −1.75 | 0.64 | 0.04 | 0.65 | 3.51 | 7.92 | 784 | 2.13 | 70.47 |
| 71 | −7.50 | −1.00 | 0.82 | −0.11 | 0.82 | 4.44 | 7.87 | 778 | 2.17 | 71.02 |
| 72 | −4.75 | 0 | 1.42 | 1.11 | 1.80 | 9.62 | 7.86 | 779 | 2.14 | 70.47 |
| 73 | −2.50 | 0 | 0.71 | −0.43 | 0.83 | 4.22 | 7.72 | 810 | 2.11 | 70.29 |
| 74 | −4.50 | −1.00 | 2.19 | 0.18 | 2.20 | 11.24 | 7.56 | 786 | 2.12 | 70.22 |
| 75 | −4.50 | −1.00 | 1.77 | 0.29 | 1.79 | 9.42 | 7.75 | 785 | 2.11 | 70.36 |
| 76 | −6.00 | 0 | 1.57 | 0.69 | 1.72 | 9.49 | 7.78 | 785 | 2.13 | 70.54 |
| 77 | −5.50 | 0 | 1.75 | 0.63 | 1.86 | 10.09 | 7.58 | 784 | 2.15 | 70.8 |
| 78 | −3.75 | −1.00 | 1.16 | 1.61 | 1.98 | 10.46 | 7.49 | 771 | 2.18 | 70.67 |
| 79 | −5.25 | −1.50 | 0.71 | 1.09 | 1.30 | 6.80 | 7.48 | 753 | 2.22 | 70.61 |
| 80 | −7.75 | −1.00 | 1.67 | −1.30 | 2.11 | 10.26 | 6.69 | 741 | 2.07 | 64.47 |
| Ave. | 1.38 ± 0.61 | 0.82 ± 0.56 | 1.67 ± 0.68 | 8.86 ± 3.56 | 7.79 | 782 | 2.13 | 70.42 | ||
| Max. | 3.17 | 16.69 | 8.54 | 827 | 2.26 | 74.20 |
In Table 2, NO.1 to NO.41 eyes are the right eyes with the signs of horizontal TCA being negative, and the rest 39 eyes are the left eyes with the signs of horizontal TCA being positive. The absolute values are taken for the calculation of the average of TCA. The average of horizontal TCA is 1.38 ± 0.61 arcmin while the average of vertical TCA is 0.82 ± 0.56 arcmin. The statistical average of the absolute TCA over the visible spectrum is 8.86 ± 3.56μm, corresponding to 1.67 ± 0.68 arcmin in angular expression, and the maximum is 16.69μm or 3.17 arcmin. TCA varies widely across subjects.
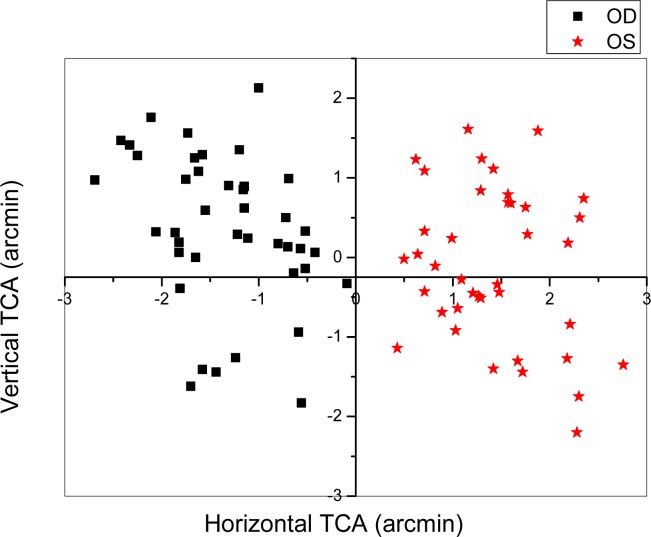
The distributions of the horizontal and vertical TCA are also plotted in Fig. 7 according to the data in Table 2. The abscissa indicates the horizontal TCA while the ordinate indicates vertical TCA. The black square represents the right eye and the red star represents the left eye. It can be seen in horizontal direction that the distribution of TCA is at the negative half of the x-axis for all right eyes, and it is at the positive half for all left eyes. This indicates that the orientations of the visual axis in horizontal direction trend to the nasal side for all eyes. In vertical direction, the signs of TCA are irregular, indicating that the orientations of visual axis in vertical direction are indeterminate.
Fig. 7.
Distribution of the horizontal TCA and vertical TCA over the visible spectrum from 400nm to 760nm for 80 eyes.
As shown in Table 2, the diameter of airy disk is about 7.79μm in average. There are 31 eyes with the magnitudes of TCA less than the diameter of airy disk accounting for 38.75% of all eyes, 35 eyes with the magnitudes ranging from 1 to 1.5 times as large as the diameter of airy disk accounting for 43.75%, and 14 eyes with the magnitudes larger than 1.5 times of the diameter of airy disk accounting for 17.5%. Statistically, the magnitude of TCA is slightly larger than the diameter of airy disk, but the maximum is about 2.17 times as large as the diameter of airy disk. We conclude that the effect of TCA on the visual quality of human eyes cannot be ignored.
3.2 Statistical results of LCA
LCA over the visible spectrum from 400nm to 760nm of 80 eyes are investigated based on the individual eye model of visual axis coincident with optical axis. The chromatic focal shift, the magnitudes of LCA and the diameters of image spot caused by LCA under the photopic condition are listed in columns 9, 10 and 11 in Table 2, respectively.
The statistical average of LCA over the visible spectrum is 2.13 ± 0.05D, corresponding to the chromatic focal shift of 782 ± 21μm in average. It can be seen that the LCA varies little across subjects. Under the photopic condition, the diameter of image spot caused by the LCA is 70.42μm in average, which is about 8 times larger than the average of TCA (8.86μm) and 4 times larger than the maximum of TCA (16.96μm). This indicates that both TCA and LCA restrict the visual performance and LCA is more detrimental than TCA.
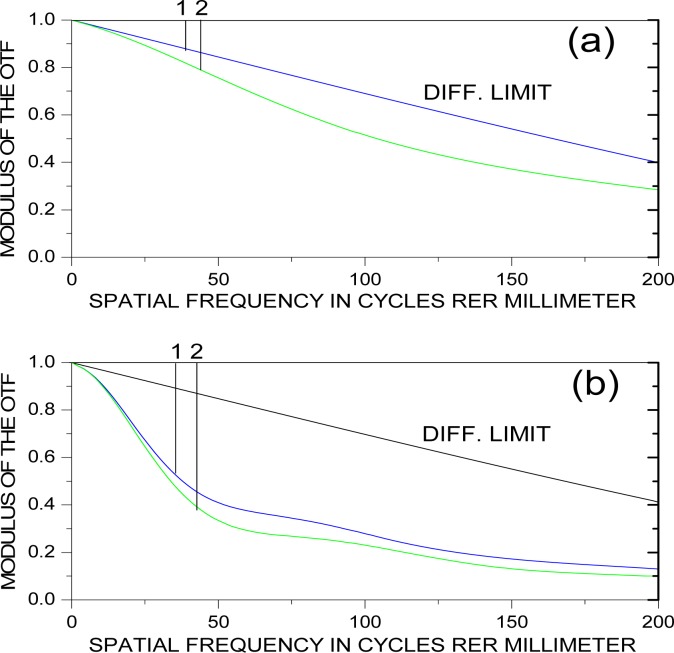
To further illustrate the effects of LCA and TCA on the visual quality we present the MTF curves of the eye model in both single wavelength (555nm) and visible light (from 473nm to 601nm as [3]). The eye model used is the fundamental eye model to simulate the monochromatic-aberration-free eyes. The variation of the MTF at 0° FOV represents the influence of LCA-only on the visual quality, and that at 3° FOV represents the influence of the sum of TCA and LCA. This is because the influence of the angle between visual axis and optical axis is just as the influence of the FOV at the same angle, and we cannot separate the TCA from the total chromatic aberrations in the eye model. The angle of 3° is the average angle formed by visual axis and optical axis in this research. Figure 8 shows the MTF curves with (a) by single wavelength setting and (b) by visible light setting. Symbols of 1 and 2 represent the FOV at 0° and 3° receptively, and the black curve represents the diffraction limit. It can be seen that curve 1 in (b) drops seriously compared to that in (a), indicating the serious influence of LCA on the visual quality. Curve 2 is slightly lower than curve 1 in (b), indicating the minor influence of TCA on the visual quality in the presence of LCA. Sowmya Ravikumar et al. [15] demonstrated that in the presence of typical levels of monochromatic aberrations, the effect of TCA was greatly reduced. Our result is somehow in an agreement with their conclusion.
Fig. 8.
MTF for the fundamental eye model, (a) with single wavelength.(b) with polychromatic light.
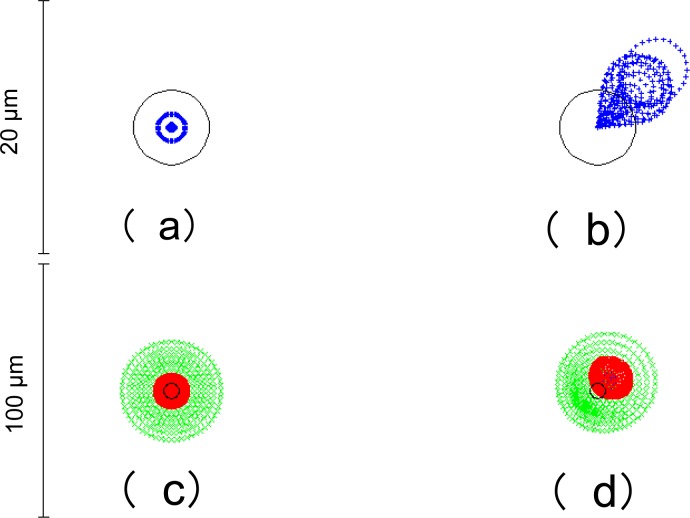
The spot diagrams of this eye model are presented in Fig. 9. Where (a) and (b) are the spot diagrams in single wavelength of 555nm at 0° FOV and 3° FOV respectively, while (c) and (d) are the spot diagrams in visible light at 0° FOV and 3° FOV respectively. The black circles show the scale of airy disk. It can be seen in a comparison of (c) and (d) that the influence of TCA is negligible in the presence of LCA.
Fig. 9.
Spot diagram for the fundamental eye model, (a) and (b) with single wavelength, (c) and (d) with polychromatic light.
Figure 10 is the spot diagrams of the eye with typical magnitude of monochromatic aberrations, the astigmatism and spherical aberration of one of the subjects. Where (a) is for the eye model without involving the angle between visual axis and optical axis, and (b) is for the eye model involving the angle. It can be seen as compared with Fig. 9 that the influence of the monochromatic aberrations on visual quality is less than the influence of LCA.
Fig. 10.
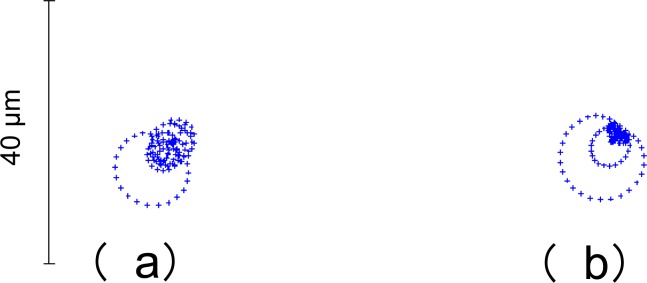
Spot diagrams of the eye with typical magnitude of monochromatic aberrations. (a) Without involving the angle, (b) involving the angle.
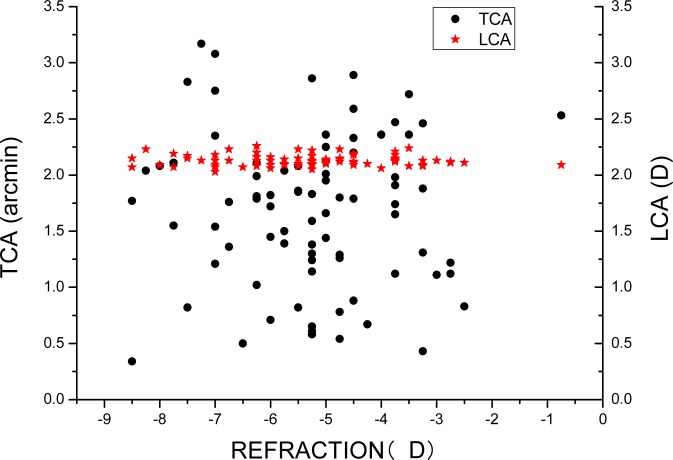
Figure 11 shows the relevance between TCA and refraction, and between LCA and refraction. The abscissa is the refraction of subjects in D, and the ordinate is the magnitude of TCA in arcmin and LCA in D. The black dots represent the TCA while the red stars represent the LCA. It can be seen that both of TCA and LCA have no obvious relevance to the refraction.
Fig. 11.
The relevance between refraction and chromatic aberration.
4. Conclusions
The properties of TCA and LCA over visible spectrum from 400nm to 760nm of 80 myopic eyes are studied by constructing two kinds of individual eye models, involving and without involving the angle formed by visual axis and optical axis.
The statistical average of TCA is 1.67 ± 0.68 arcmin, which is smaller than but comparable to the results presented in [3,4]. TCA varies widely across subjects. In horizontal direction, the sign of TCA is negative for all right eyes, and it is positive for all left eyes, indicating the orientation of the visual axis trending to the nasal side. In vertical direction, the sign of TCA is irregular indicating the orientation of visual axis is indeterminate.
The statistical average of LCA is 2.13 ± 0.05D which is similar to the results in [2,3]. The trend of LCA is flatter in long wavelength band as compared to that in short wavelength band. LCA varies little across subjects.
The effects of both LCA and TCA on the visual quality are evaluated with the scale of image spot and the MTF curves. The magnitude of TCA is slightly larger than the diameter of airy disk, but the maximum is about 2.17 times as large as the diameter of airy disk. The effect of TCA on the image quality cannot be ignored. Under the photopic condition, the diameter of image spot caused by LCA is 70.42μm in average, which is about 8 times larger than the average magnitude of TCA (8.86μm) and 4 times larger than the maximum (16.96μm). Therefore, both TCA and LCA restrict the visual performance, and LCA is more detrimental than TCA.
It is shown with the MTF analysis that the chromatic aberrations degrade the visual performance to a certain extent, with the effect of LCA more serious. In the presence of LCA the influence of TCA is greatly reduced.
Acknowledgment
This work is supported by the National Nature Science Foundation of China (No. 81170873), and the National Nature Science Foundation of China (No. 11104149).
References and links
- 1.Sivak J. G., Mandelman T., “Chromatic dispersion of the ocular media,” Vision Res. 22(8), 997–1003 (1982). 10.1016/0042-6989(82)90036-0 [DOI] [PubMed] [Google Scholar]
- 2.Wald G., Griffin D. R., “The change in refractive power of the human eye in dim and bright light,” J. Opt. Soc. Am. 37(5), 321–336 (1947). 10.1364/JOSA.37.000321 [DOI] [PubMed] [Google Scholar]
- 3.Marcos S., Burns S. A., Moreno-Barriusop E., Navarro R., “A new approach to the study of ocular chromatic aberrations,” Vision Res. 39(26), 4309–4323 (1999). 10.1016/S0042-6989(99)00145-5 [DOI] [PubMed] [Google Scholar]
- 4.Rynders M., Lidkea B., Chisholm W., Thibos L. N., “Statistical distribution of foveal transverse chromatic aberration, pupil centration, and angle psi in a population of young adult eyes,” J. Opt. Soc. Am. A 12(10), 2348–2357 (1995). 10.1364/JOSAA.12.002348 [DOI] [PubMed] [Google Scholar]
- 5.Liang J., Williams D. R., “Aberrations and retinal image quality of the normal human eye,” J. Opt. Soc. Am. A 14(11), 2873–2883 (1997). 10.1364/JOSAA.14.002873 [DOI] [PubMed] [Google Scholar]
- 6.Atchison D. A., Smith G., “Chromatic dispersions of the ocular media of human eyes,” J. Opt. Soc. Am. A 22(1), 29–37 (2005). 10.1364/JOSAA.22.000029 [DOI] [PubMed] [Google Scholar]
- 7.Liou H.-L., Brennan N. A., “Anatomically accurate, finite model eye for optical modeling,” J. Opt. Soc. Am. A 14(8), 1684–1695 (1997). 10.1364/JOSAA.14.001684 [DOI] [PubMed] [Google Scholar]
- 8.Y. Zhang, Applied Optics (Publishing House of Electronics Industry, 2008), Chap. 14. [Google Scholar]
- 9.Navarro R., González L., Hernández J. L., “Optics of the average normal cornea from general and canonical representations of its surface topography,” J. Opt. Soc. Am. A 23(2), 219–232 (2006). 10.1364/JOSAA.23.000219 [DOI] [PubMed] [Google Scholar]
- 10.Zemax Optical Design Program User’s Guide (Zemax Development Corporation, 2005), Chap. 11, pp. 229–230. [Google Scholar]
- 11.Guo H., Wang Z., Zhao Q., Quan W., Wang Y., “Individual eye model based on wavefront aberration,” Optik (Stuttg.) 116(2), 80–85 (2005). 10.1016/j.ijleo.2004.12.005 [DOI] [Google Scholar]
- 12.Dai G. M., “Scaling Zernike expansion coefficients to smaller pupil sizes: a simpler formula,” J. Opt. Soc. Am. A 23(3), 539–543 (2006). 10.1364/JOSAA.23.000539 [DOI] [PubMed] [Google Scholar]
- 13.Li R., Wang Z., Liu Y., Mu G., “A method to design aspheric spectacles for correction of high-order aberrations of human eye,” Sci. China Technol. Sci. 55(5), 1391–1401 (2012). 10.1007/s11431-012-4762-4 [DOI] [Google Scholar]
- 14.Burek H., Douthwaite W. A., “Mathematical models of the general corneal surface,” Ophthalmic Physiol. Opt. 13(1), 68–72 (1993). 10.1111/j.1475-1313.1993.tb00428.x [DOI] [PubMed] [Google Scholar]
- 15.Ravikumar S., Thibos L. N., Bradley A., “Calculation of retinal image quality for polychromatic light,” J. Opt. Soc. Am. A 25(10), 2395–2407 (2008). 10.1364/JOSAA.25.002395 [DOI] [PubMed] [Google Scholar]


