Abstract
Multi diameter single fiber reflectance (MDSFR) spectroscopy is a non-invasive optical technique based on using multiple fibers of different diameters to determine both the reduced scattering coefficient (μs′) and a parameter γ that is related to the angular distribution of scattering, where γ = (1-g2)/(1-g1) and g1 and g2 the first and second moment of the phase function, respectively. Here we present the first in vivo MDSFR measurements of μs′(λ) and γ(λ) and their wavelength dependence. MDSFR is performed on nineteen mice in four tissue types including skin, liver, normal tongue and in an orthotopic oral squamous cell carcinoma. The wavelength-dependent slope of μs′(λ) (scattering power) is significantly higher for tongue and skin than for oral cancer and liver. The reduced scattering coefficient at 800 nm of oral cancer is significantly higher than of normal tongue and liver. Gamma generally increases with increasing wavelength; for tumor it increases monotonically with wavelength, while for skin, liver and tongue γ(λ) reaches a plateau or even decreases for longer wavelengths. The mean γ(λ) in the wavelength range 400-850 nm is highest for liver (1.87 ± 0.07) and lowest for skin (1.37 ± 0.14). Gamma of tumor and normal tongue falls in between these values where tumor exhibits a higher average γ(λ) (1.72 ± 0.09) than normal tongue (1.58 ± 0.07). This study shows the potential of using light scattering spectroscopy to optically characterize tissue in vivo.
OCIS codes: (060.2310) Fiber optics; (170.6510) Spectroscopy, tissue diagnostics; (170.6935) Tissue characterization; (300.6550) Spectroscopy, visible
1. Introduction
Reflectance spectroscopy is frequently used to determine the absorption and scattering coefficients of biological tissue. A range of fiber-optic devices with different probe geometries have been developed to retrieve these optical properties, within various regimes of tissue-light propagation [1–3]. The absorption coefficient of tissue is related to physiological parameters such as micro-vascular blood oxygenation, blood volume fraction and microvessel diameter, as well as to the concentration of chromophores such as bilirubin and cytochrome C. Scattering in tissue results from variations in refractive index between the various cell and tissue components and their surroundings.
At large source-detector separations, light transport can be considered diffuse and is therefore only dependent on the absorption coefficient (μa) and the reduced scattering coefficient (μs′), given by where is the first moment of the scattering phase function (PF), also called the scattering anisotropy. At these large distances, light transport is insensitive to the exact shape of the PF. However, in device configurations with small source-detector separations, an additional, PF dependent variable γ is necessary to describe the effect of large angle scattering events on the reflectance signal [4–7]. This parameter γ is defined as
| (1) |
where g2 is the second Legendre moment of the PF [5].
Our group has previously developed single fiber reflectance spectroscopy (SFR), where one fiber serves as both source and detector. One advantage of this geometry is that SFR is sensitive to superficial tissues and their microvasculature, which are susceptible to early changes in morphology caused by (pre-)malignant disease. Furthermore, the diameter of a single fiber probe is such that it can be easily guided through the working channel of and endoscope to sample internal organs. The analysis of SFR spectra is performed using a semi-empirical model (cf. Eq. (2)) that describes the PF-dependent relationship between SFR signal and the dimensionless reduced scattering (which is defined as the product of the reduced scattering coefficient and the fiber diameter μs′ df) [6]. This semi-empirical model was based on Monte-Carlo simulations and validated in tissue mimicking phantoms [8,9]. SFR spectroscopy allows us to determine tissue absorption without prior knowledge of the scattering coefficient [10]. Recently, SFR has been extended to multi-diameter single fiber reflectance spectroscopy (MDSFR), in which two fiber diameters can be used to determine the μs′ and γ [7,11,12]. An MDSFR measurement consists of several co-localized SFR measurements using different fiber diameters [11], which are each individually corrected for absorption [10], resulting in the reflectance in the absence of absorption,, for every SFR measurement. The co-localized, multi-fiber diameter values are then simultaneously fitted to the model described in Eq. (2),
| (2) |
where ηlim is the diffuse limit of the single fiber collection efficiency and [p1 p2 p3] are γ(λ)-dependent coefficients, the values of which are derived from Monte Carlo simulations. The spectral shape of μs′(λ) is constrained according to a biologically realistic power law decay. Solving the equation with two unknown variables for two different fiber diameters allows wavelength dependent quantification of both μs′ and γ. The MDSFR approach has been validated both in silico and in optical phantoms containing polystyrene microspheres over a wide range of biologically relevant values for μs′(λ) and γ(λ), with and without the presence of absorbers [7,12].
In the current study we present, for the first time, differences in the wavelength dependence of μs′ and γ in vivo, measured using MDSFR. We have acquired MDSFR spectra in vivo from tumor, normal tongue tissue, skin and liver in an orthotopic xenograft model for oral cancer in mice using consecutive SFR measurements of two different fiber diameters (0.4 and 0.8 mm).
2. Methods
2.1 MDSFR reflectance model
First, the Beer-Lambert law is used to correct the measured SFR intensities (df) for absorption to obtain (df):
| (3) |
where (df) is given by Eq. (2), μa, Tiss is the absorption coefficient of tissue and <L> is the effective photon path length, given by [8]
| (4) |
The absorption coefficient of tissue is expressed as the sum of the absorption of blood μa,blood and the absorption of bilirubin :
| (5) |
The absorption coefficient of blood can be described as the product of the specific blood absorption coefficients and blood volume fraction:
| (6) |
where StO2 is the blood oxygen saturation, bvf is blood volume fraction assuming the concentration of hemoglobin in whole blood to be 150 g/L, and and are the specific absorption coefficients of oxygenized and deoxygenized blood, respectively. Ccor is the correction factor that accounts for flattening of spectral features resulting from the inhomogeneous distribution of blood in tissue and the confinement of blood in vessels [13,14]. For whole blood, the correction factor is given by:
| (7) |
and is related to the average vessel diameter Dv. The total tissue absorption μa,tiss can then be described as the absorption of blood μa,blood, dependent on blood volume fraction, and the absorption of bilirubin, which is the product of the specific absorption coefficient and the bilirubin concentration cbil:
| (8) |
The small but distinct GFP fluorescence emission peak present in the white light reflectance spectra of tumor was accounted for using a fit component to be included in the reflectance model:
| (9) |
This EmGFP basis spectrum was previously acquired by fluorescence measurements of the tongue tumors, corrected for optical properties and system transmission. We attempted to include the absorption of GFP (determined from in-vitro cells) in the SFR analysis in the same way bilirubin is treated in Eq. (5). This did not result in a significant improvement of the fit, and GFP absorption was therefore omitted form the fit procedure.
The aim of this first step of the analysis is to remove the effects of absorption on the individual SFR spectra. It was shown previously that accurate absorption coefficients from individual SFR spectra can be obtained without prior knowledge of the tissue scattering properties [7,10] if an optimized set [p1 p2 p3 CPF] is used, i.e. p1 = 1.55, p2 = 0.969, p3 = 6.82, and CPF = 0.944. The background scattering model used in this first step of individual analysis of each SFR spectrum is based on a 4th order polynomial, i.e.
| (10) |
This model allows sufficient degrees of freedom to correct for the physically incorrect assumption that [p1 p2 p3 CPF] are independent of γ. This aspect of the model will be further addressed in the discussion section. After removal of the effect of absorption on the individual SFR spectra, the MDSFR analysis is performed by solving Eq. (2) for multiple fiber diameters simultaneously. Here, the reduced scattering coefficient is modeled using the power law function:
| (11) |
and Eq. (2) and Eq. (4) are adapted to yield a wavelength-dependent γ, by replacing the coefficients [p1 p2 p3] with in Eq. (2) [11] and in Eq. (4). A Levenberg-Marquart non-linear fit procedure is used to estimate the variables μs′(λ) and γ(λ) from the MDSFR spectra of two different fiber diameters simultaneously.
Finally, since the MDSFR analysis yields estimates of μs′(λ) and γ(λ), these values can now be used in the individual SFR fits to re-estimate the absorption coefficient. In the first step, the absorption coefficient was estimated without knowledge of the scattering properties by assuming fixed (wavelength independent) values for [p1 p2 p3 CPF] and using a 4th order polynomial for μs′(λ); the accuracy of that approach is now verified by using the extracted wavelength dependent estimates of γ and using a biologically realistic shape for μs′(λ), i.e. a power law.
2.2 Experimental setup
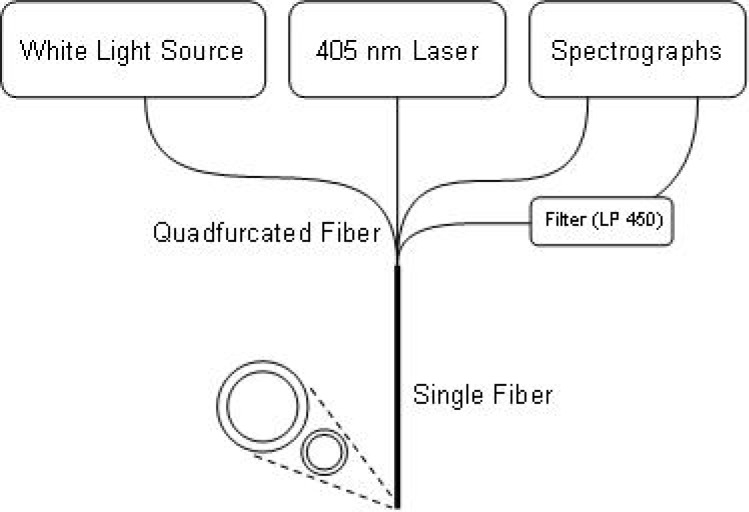
The illustration in Fig. 1 represents a single probe-unit of the MDSFR spectroscopic setup.During reflectance measurements, white light emitted by a halogen light source [HL-2000-FHSA; Ocean Optics; Duiven, NL] is directed through the first fiber of a quadfurcation into a solid core fiber-optic probe and guided onto the tissue. A small fraction of the light is reflected from the tissue into the acceptance cone of the probe fiber and directed via a second fiber of the quadfurcation into a spectrometer [SD-2000; Ocean Optics; Duiven, NL] for detection and further analysis. After the reflectance measurement, a low power fluorescence measurement is performed, using a 405 nm laser directed into another fiber of the quadfurcation to illuminate the tissue through the same probe. The emitted fluorescence is then guided through the last fiber of the quadfurcation, which leads through a 450 nm long-pass filter into a second spectrograph [QE-65000; Ocean Optics; Duiven, NL]. The fluorescence measurement is incorporated to ensure the presence of tumor cells, lenti-virally infected with GFP, in the measurement volume. The complete MDSFR system consists of two identical probe-units containing fiber diameters of 0.4 and 0.8 mm. The fiber probes are sequentially placed in contact with the tissue under investigation. All probes are polished under an angle of 15° to minimize internal specular reflections from the probe tip. A calibration procedure was performed as described previously [7], consisting of a measurement in water in a dark container (Iwater) and a measurement in a liquid phantom containing 20% Intralipid diluted to yield μs′(800nm) = 1.2 mm−1, (), where
| (12) |
and is the absolute SFR signal obtained through Monte Carlo simulations.
Fig. 1.
Schematic diagram of the measurement setup. Reflectance and fluorescence are measured through a single fiber of either 0.4 or 0.8 mm. Two identical setups are used to accommodate 2 fiber diameters.
2.3 Animal model
The study protocol was approved by the Animal Welfare Committee of the Leiden University Medical Center. Housing of BALB/cByJ nu/nu female mice (aged 4-6 weeks; Charles River Laboratories), the experiments and euthanazation were performed in accordance with the guidelines of this committee. Chlorophyll free food and sterilized water were provided without restriction. A set of 19 mice were injected with OSC19 cells lenti-virally transfected with luc and GFP (6x10⁴ cells, Biocat, Heidelberg, Germany) [15,16]. After an incubation period of 10-13 days, animals were included in the study and anesthetized with 2-3% Isoflurane. Reflectance spectra were acquired from tumor, normal tongue tissue (both 5 measurements), and skin and liver (both 3 measurements). The consecutive measurements were taken by removing and carefully repositioning the fiber between measurements, without imparting undue pressure on each tissue. For tumor, the fiber tip was positioned directly on top of the visible tumor. An additional MDSFR measurement of liver was carried out immediately before animals were sacrificed. After the animals were sacrificed, the tongue was harvested for microscopic tissue analysis.
2.4 Data reduction and statistical analysis
To verify the presence of tumor tissue in the measurement volume with the probe on top of the tumor, co-localized fluorescence spectra are acquired with both the 0.4 and 0.8 mm fiber. Since the quantum yield of CopGFP, incorporated to identify tumor tissue, is high, qualitative analysis of these spectra was sufficient to exclude measurements where tumor tissue was not present in the measurement volume. Two animals did not develop a visual tumor, and lacked GFP fluorescence in all five tumor measurements for both fiber diameters. These animals were excluded from the analysis of optical properties of tumor tissue.
Variation in probe pressure and probe location in consecutive measurements may lead to slight variations in outcome, which can interfere with a proper analysis of the averaged MDSFR data. Therefore, all SFR spectra with R(800 nm) deviating >2σ from the average value of R(800 nm) of the consecutive measurements on each tissue site, were removed from the analysis after the first analysis step. To account for remaining variations in subsequent SFR measurements, the standard deviation of R(800 nm) for each fiber diameter was used as a weight factor in the non-linear MDSFR fit procedure. Therefore, SFR fiber measurements with large variations contribute less to the best-fit outcome. Statistical analysis of optical properties for various tissues is done by using a paired Student T-test with P<0.05 as the level of significance.
3. Results
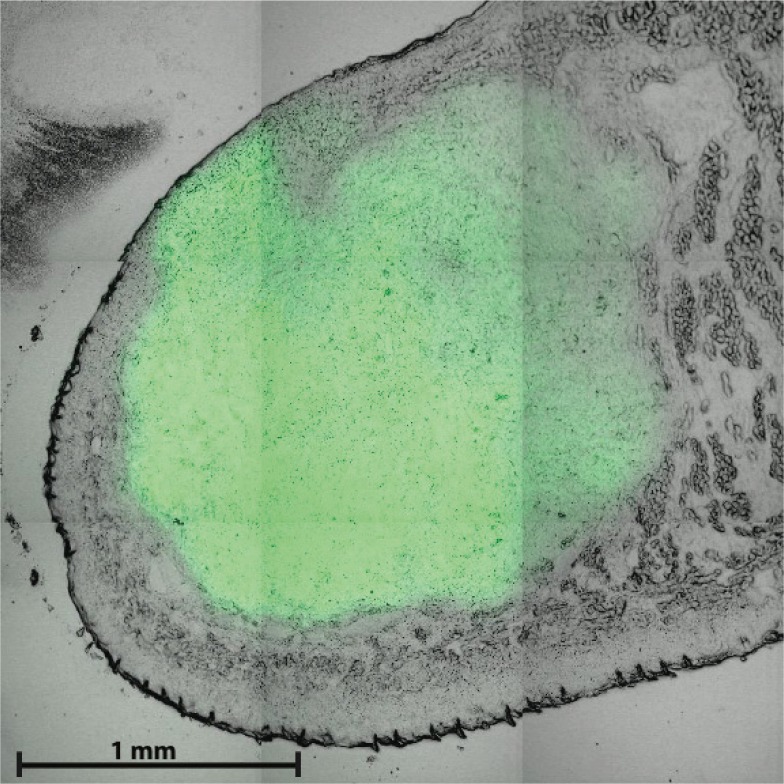
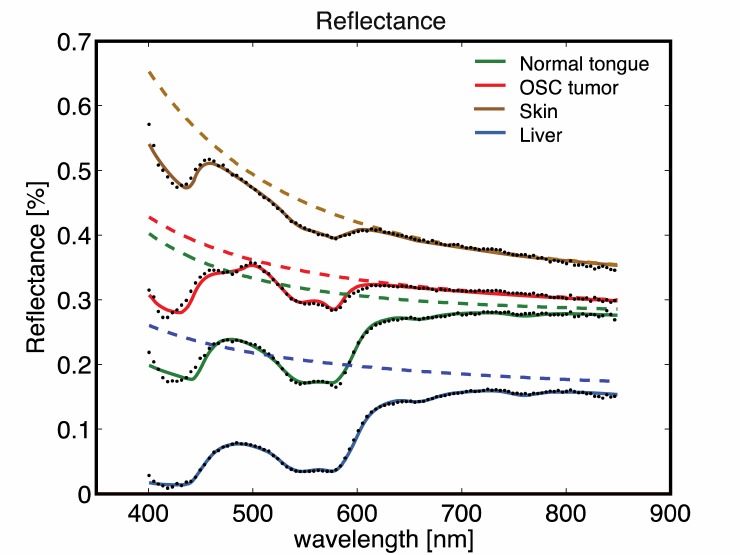
After an incubation period of 10-13 days, 17 mice had a visible tumor at the tip of the tongue. Figure 2 shows a representative example of a combined confocal fluorescence and white light transmission microscopy image of a frozen section cut vertically through the center of the tongue. In this example the fiber tip was positioned in contact with the surface of the tongue in the upper left region of the image where tumor cells are close to the surface of the tongue. The image shows a thin but variable layer of epithelium overlying the GFP-fluorescent tumor at the tip of the tongue.A total of 588 reflectance spectra taken from 19 mice were analyzed in this study. Figure 3 shows representative reflectance spectra of tumor, tongue, skin and liver tissue, together with their best fits and calculated absorption-corrected reflectance for a 0.8 mm fiber (after the 3rd analysis step, based on power-law scattering and wavelength-dependent γ).
Fig. 2.
Confocal fluorescence microscopy image of mouse tongue, using 488 nm excitation and 520-540 nm detection, showing the distribution of GFP-expressing OSC tumor in green and transmitted 488 nm light in grey. Scale bar 1 mm.
Fig. 3.
Typical 0.8 mm SFR data. Plotted are the measured RSF (black dots), individual SFR fits (solid lines) and calculated(dashed lines) for normal tongue, tumor, skin and liver tissue.
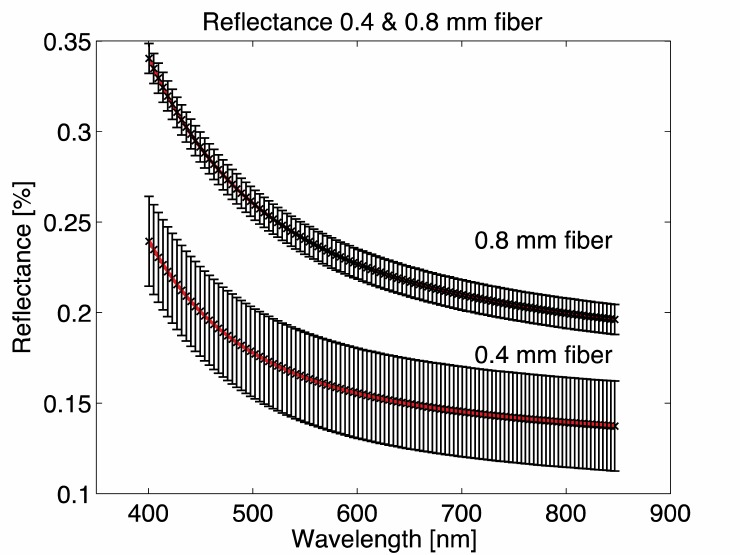
In this example, the spectra taken on skin show a significantly higher reflectance over the whole wavelength range compared to normal tongue and tumor tissue, while reflectance for liver is lowest. spectra (dashed lines in Fig. 3) of five consecutive co-localized measurements per fiber diameter are averaged, and these averaged spectra and their standard deviations serve as input for the MDSFR analysis. Figure 4 shows the average spectra of normal tongue tissue in a single mouse, fitted with the MDSFR model. As expected, a larger fiber diameter results in a higher reflectance.
Fig. 4.
Averaged SFR spectra of normal tongue tissue; fiber diameters are 0.4 and 0.8 mm.
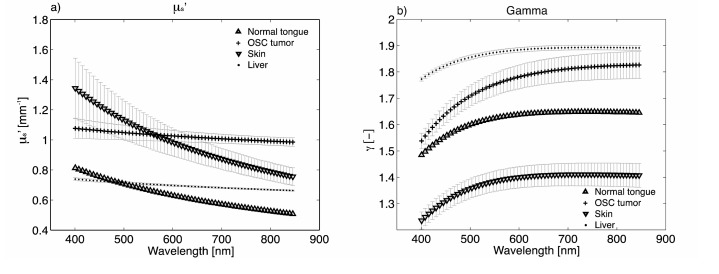
Figures 5(a) and 5(b) show μs′(λ) and γ (λ) resulting from MDSFR fits on different tissues for a representative mouse. For all locations, μs′ decreases with increasing wavelength [17]. It is helpful to describe μs′ in terms of two parameters, the reduced scattering coefficient at 800 nm μs′(800nm), and its wavelength dependent slope, which is often termed the scattering power (resp. a1 and a2 in Eq. (11)).
Fig. 5.
μs′ (a) and γ (b) for different tissues, measured in 1 representative mouse.
It has been shown that the scattering power is related to the refractive index correlation function of the measured tissue, and therefore has a direct relation with tissue structure [18–20]. In general we can conclude from all measurements that skin is most easily distinguishable from the other tissues by having a higher value for the scattering power. The difference between tumor and normal tongue tissue are more subtle, but tumor tends to have a lower scattering power than normal tongue tissue. Liver also shows a very low scattering power. The wavelength dependence of γ (Fig. 5(b)) shows an increase with wavelength for the low wavelength region, for all tissue types. For higher wavelengths, γ either plateaus or decreases after reaching a maximum, except for tumor tissue, for which γ continues to increase with wavelength.
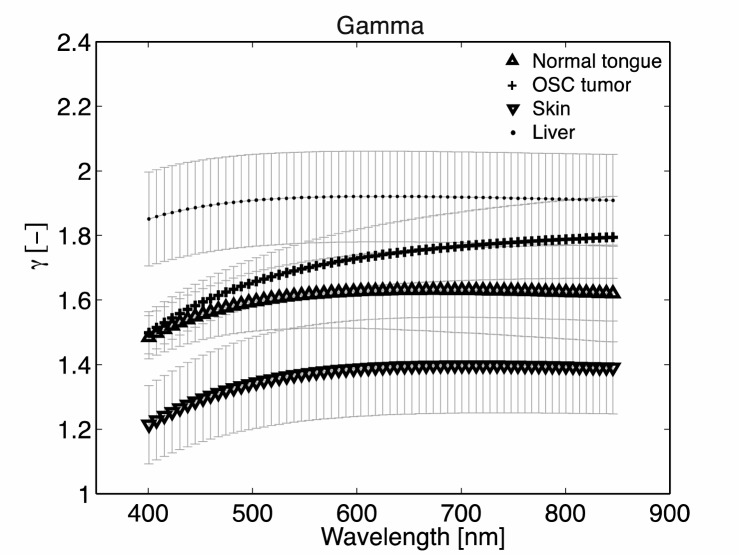
In Fig. 6, we show the average γ(λ) for the four different tissue types, based on the measurements on all 19 mice.
Fig. 6.
Gamma per tissue, averaged over n = 19.
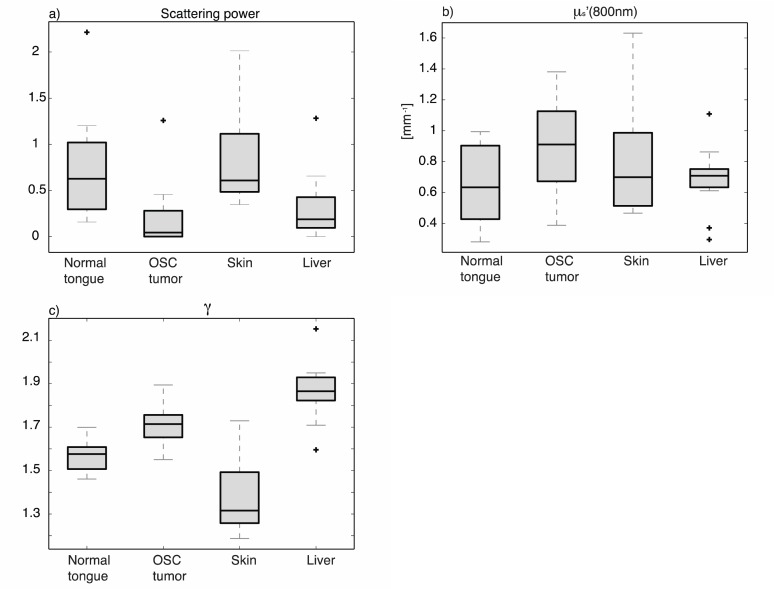
Figures 7(a), 7(b), and 7(c) show the median and quartiles of μs′(800), the scattering power, and γ averaged over the 400-850 nm wavelength range, for normal tongue, tumor tissue, skin and liver.Both Fig. 6 and Fig. 7(c) clearly show that γ is lowest for skin and highest for liver. Furthermore, γ for tumor increases monotonically with increasing wavelength, and increases more over the measured wavelength range than for normal tissue, although this difference is not significant. Table 1 summarizes the average values for scattering power, μs′(800) and average gamma for the four tissue types.
Fig. 7.
Average scattering power (a), μs′ (800nm) (b) and Gamma (c) of 19 mice, for 4 different tissues.
Table 1. Scattering Power, μs′(800nm) and Average Gamma for Four Different Tissues.
| Scattering power | μs′(800nm) [mm−1] | Gamma | |
|---|---|---|---|
| Normal tongue | 0.63 ± 0.35 | 0.64 ± 0.25 | 1.58 ± 0.07 |
| OSC tumor | 0.13 ± 0.16 | 0.90 ± 0.29 | 1.72 ± 0.09 |
| Skin | 0.86 ± 0.49 | 0.81 ± 0.37 | 1.37 ± 0.14 |
| Liver | 0.24 ± 0.20 | 0.71 ± 0.08 | 1.87 ± 0.07 |
From Fig. 7(a) and Table 1, it can be seen that the scattering powers of tumor and liver are significantly lower than for normal tongue and skin (Paired t-test, P<0.05). The μs′(800nm) for tumor is significantly higher than for normal tongue and liver. The average value for γ of skin differs significantly from all other tissues.
An interesting observation is that although the reflectance is highest for skin, the μs′(λ) is not. This suggests that the angular distribution of scattering represented by γ(λ) can strongly influence the observed reflectance. The low γ(λ) for skin indicates that scattering is more directed backwards for skin than for other tissues, resulting in a higher total reflectance. For liver the opposite occurs; the low reflectance in this tissue is not a result of a low μs′(λ), but the high γ(λ) which indicates that most of the scattered light is directed forward.
4. Discussion and conclusion
In this paper we have presented the first in vivo measurements of μs′(λ) and γ(λ) obtained using multi-diameter single fiber reflectance spectroscopy. We determined μs′(λ) and γ(λ) for 4 different types of mouse tissue, including skin, liver, normal tongue and oral squamous cell carcinoma. Measurements of μs′(λ) and γ(λ) show distinct differences between tissue types.
4.1 Comparison to previous studies: μs′(λ)
A number of previous studies have performed measurements to determine the optical (scattering) properties of tissues in ex vivo and in vivo tissue samples. The often significant limitations of measuring tissue optical properties in ex vivo samples is well recognized [21]. The measurement of tissue optical properties in vivo has for the most part been based on the use of diffuse reflectance spectroscopy or the measurement of interstitial fluence rate and angularly resolved radiance [21]. A range of tissue types have been investigated, in general for wavelengths above 630 nm. In the wavelength region between 630 and 850 nm the reduced scattering coefficient typically ranges from 0.4 – 1.31 mm−1, with tissues such as brain and stomach yielding higher values. These values are well within the range of those found in the present study. Thus far, the only data reported for shorter wavelengths is in the stomach [22] where the absolute value of μs′ is slightly higher than the range we obtained for our investigated tissues, but this is likely to be a consequence of the different tissue type.
The scattering power is related to the shape of the refractive index correlation function and has recently been suggested to be an important factor in identifying tissue structure. Ex vivo data of various organs have been published [23,24]. Yi and Backman have reported for rat liver a scattering power of 1.64 ± 0.11, measured by inverse spectroscopic optical coherence tomography on excised organs. Hall et al. found the scattering power for fixed muscle tissue slices of mice to be 1.30 ± 0.12 by measuring the angular distribution of light scattered through the sample, and fitting these observations to Monte Carlo simulations to obtain the optical properties of the sample under investigation. Although our in vivo scattering powers are low compared to these values, they are still within the range of 0<a2<2, which is typical for tissue [25]. A recently published paper on in vivo measurements of the correlation length in colorectal field carcinogenesis reported scattering powers of 0.2<a2<0.5 [26]. This aligns well with the relatively low a2 values we have found in the present in vivo study. Whether the differences in scattering power are related to differences between in vivo and ex vivo scattering properties or due to differences in the optical methods remains a topic of investigation.
4.2 Comparison to previous studies: γ(λ)
We observe marked differences when comparing our findings of the wavelength dependence of γ to the in vivo data published by Thueler et al [22]. We have extracted γ values between 1.2 and 1.9 with γ generally increasing with wavelength; γ varied between 1.5 and 1.9 for tongue and tumor tissue, and between 1.2 and 1.5 for skin, which are within the range of expected values for tissue [7,27,28]. Thueler et al report measurements on stomach epithelium with an approximately constant γ with values around 2.0, and a slight increase in the low wavelength region. Whether these differences in γ are related to differences between tissue types or due to differences in the used optical methods remains to be investigated.
It is interesting to consider that the spectral shape of γ can be linked to the correlation function of the refractive index in the tissue under investigation. The spectral shape of γ is determined by the first two Legendre moments of the phase function, which are wavelength dependent. The phase function and its derived metrics anisotropy (g1) and γ are, similar to the (reduced) scattering coefficient, related to the refractive index correlation function [20,23]. The tissue refractive index correlation function has recently been modeled by the Whittle-Matern correlation function, which contains 3 variables: the deterministic factor D, the length scale of the correlation lc, and the scaling factor Nc. While the scattering power is directly related to the deterministic factor D, the length scale of the correlation lc is related to both μs′ and γ. In theory it is possible to express γ and its wavelength dependence in terms of lc, and use the combined measurements of μs′ and γ to calculate the physical properties of the correlation function, D and lc. However, this is beyond the scope of this paper and will be presented in future work.
4.3 Step-analysis of fit procedure
MDSFR is based on the reflectance in the absence of absorption. In the vast majority of in vivo situations, where absorption is present, one first needs to determine the contribution of absorption to the total reflectance intensity using the model that we previously developed for individual SFR measurements. To achieve this, our analysis of tissue absorption and scattering in an individual SFR measurement was based on a background scattering model consisting of a polynomial (n = 4), together with an optimized set of wavelength-independent coefficients representing γ [10]. The choice of such a non-physical background scattering model is necessary in order to correct for the ill-posed assumption that γ is wavelength independent; the background scattering model needs sufficient freedom in this first step to correct for this assumption. It is important to emphasize that in the first step, we only need to remove the effect of absorption on the individual SFR spectra by implementing the approach reported previously [11]. The MDSFR analysis itself is then performed with the physically realistic power-law scattering model (that follows from the definition of the Whittle-Matern correlation function), which yields values for the reduced scattering coefficient (defined by the scattering power and μs′(800nm)) and γ. To verify that the absorption was correctly estimated in the first step, the extracted values for γ from the MDSFR analysis were used to re-analyse the individual SFR measurements using the power-law scattering model and the extracted wavelength-dependent γ. We found that the absorption spectra extracted in the first step were almost identical to the absorption spectra extracted using the power-law scattering model and the wavelength dependent γ, as indicated by an average Pearson correlation coefficient of R2 = 0.99 between extracted absorption spectra.
Clearly when more information becomes available about the wavelength dependence of γ, that knowledge could be used to spectrally constrain γ and thus complete an MDSFR fit in a single step fitting routine.
4.4 Limitations
4.4.1 Probe replacement
A potential limitation of the present study is caused by the fact that multiple fibers with different diameters are used sequentially. Therefore, slight differences in measurement volume are not only due to different fiber diameters but can also occur from measuring a slightly different spot in each measurement. Sequentially measuring the exact same tissue location with the exact same pressure for various fiber diameters is not only time consuming, but also makes the current measurement procedure cumbersome and sensitive to measurement artifacts. Clearly the use of a single measurement probe that is capable of rapidly changing its effective aperture would be a major step forward. New technological developments should overcome this problem in the near future and provide true co-localized measurement positions for various fiber diameters [29]. Despite the uncertainty in probe repositioning, the standard deviations for an individual mouse on the MDSFR fitted values for μs′ and γ (Figs. 5(a) and 5(b)) are all within 10% of the fitted value (with the exception of μs′ for skin), which is very encouraging.
4.4.2 Layered tissue
It is well known that skin and oral mucosa are comprised of layered tissue. In skin the stratum corneum and epidermis overlay the underlying dermis. In the oral cavity the normal tongue is comprised of a superficial keratinized layer with underlying epithelial layer and deeper lying connective tissue comprised of orthogonal muscle fiber bundles. The two, 0.4 and 0.8 mm, fibers are expected to probe the relatively homogeneous layers of tissue comprising mouse epithelium and dermis in the skin and the tongue epithelium and underlying connective tissue in normal tongue. OSC in the tongue develops beneath the superficial keratinized layer but can potentially be overlain by a layer of epithelial tissue of variable thickness. Microscope images of sections of OSC in the tongue (Fig. 2) show variation in thickness of the tissue layer covering the tumor between animals. Although tumor size and position varied somewhat between animals, placing the fiber probe on a position where the tumor was visible minimized the distance between tumor and fiber tip. Since the measurement volume and depth increase with increasing fiber diameter, the smallest fiber diameter was specifically chosen to be 0.4 mm to incorporate tumor within the measurement volume. However, the contribution of the top layer of the tongue epithelium to the total acquired signal will be slightly different for each fiber diameter. Given these concerns we analyzed spectra acquired using each fiber diameter at a single location. This analysis showed consistent values for scattering power between fiber diameters. While this result suggests that the influence of epithelium overlying the tumor is small, it could be a reason why we observe only a relatively small difference in scattering signature between normal tongue and tumor tissue. The potential confounding effect of overlying epithelium could be removed in the future by studying a chemically induced model of oral cancer in animals or interrogating superficial human OSC.
4.5 Future developments
Quantification of tissue optical properties does not only yield direct diagnostic information, it also facilitates the use of quantitative in vivo fluorescence measurements. To quantify the concentration of an (exogenous) fluorophore in tissue, for example to monitor photodynamic therapy, knowledge of local tissue optical properties is necessary to correct for the effects of scattering and absorption on the collected fluorescence [30]. Our setup allows for reflectance and fluorescence measurements to be taken with the same probe, providing a method to determine fluorescence corrected for the influence of tissue optical properties, which opens the way to quantitatively compare fluorescence from different tissues and patients.
In conclusion, we have presented the first in vivo MDSFR analysis of four different tissue types, based on measurements of 19 animals. Analysis of scattering power, reduced scattering at 800nm and average γ resulted in significant differences for the four tissue types studied. Future work will address the relation between μs′(λ) and γ(λ) and the properties of the tissue refractive index correlation function D and lc.
References and links
- 1.Reif R., A’Amar O., Bigio I. J., “Analytical model of light reflectance for extraction of the optical properties in small volumes of turbid media,” Appl. Opt. 46(29), 7317–7328 (2007). 10.1364/AO.46.007317 [DOI] [PubMed] [Google Scholar]
- 2.Amelink A., Sterenborg H. J. C. M., Bard M. P. L., Burgers S. A., “In vivo measurement of the local optical properties of tissue by use of differential path-length spectroscopy,” Opt. Lett. 29(10), 1087–1089 (2004). 10.1364/OL.29.001087 [DOI] [PubMed] [Google Scholar]
- 3.Zonios G., Perelman L. T., Backman V., Manoharan R., Fitzmaurice M., Van Dam J., Feld M. S., “Diffuse reflectance spectroscopy of human adenomatous colon polyps in vivo,” Appl. Opt. 38(31), 6628–6637 (1999). 10.1364/AO.38.006628 [DOI] [PubMed] [Google Scholar]
- 4.Tian H., Liu Y., Wang L., “Influence of the third-order parameter on diffuse reflectance at small source-detector separations,” Opt. Lett. 31(7), 933–935 (2006). 10.1364/OL.31.000933 [DOI] [PubMed] [Google Scholar]
- 5.Bevilacqua F., Depeursinge C., “Monte Carlo study of diffuse reflectance at source−detector separations close to one transport mean free path,” J. Opt. Soc. Am. A 16(12), 2935–2945 (1999). 10.1364/JOSAA.16.002935 [DOI] [Google Scholar]
- 6.Kanick S. C., Gamm U. A., Schouten M., Sterenborg H. J., Robinson D. J., Amelink A., “Measurement of the reduced scattering coefficient of turbid media using single fiber reflectance spectroscopy: fiber diameter and phase function dependence,” Biomed. Opt. Express 2(6), 1687–1702 (2011). 10.1364/BOE.2.001687 [DOI] [PMC free article] [PubMed] [Google Scholar]
- 7.Gamm U. A., Kanick S. C., Sterenborg H. J., Robinson D. J., Amelink A., “Quantification of the reduced scattering coefficient and phase-function-dependent parameter γ of turbid media using multidiameter single fiber reflectance spectroscopy: experimental validation,” Opt. Lett. 37(11), 1838–1840 (2012). 10.1364/OL.37.001838 [DOI] [PubMed] [Google Scholar]
- 8.Kanick S. C., Robinson D. J., Sterenborg H. J., Amelink A., “Monte Carlo analysis of single fiber reflectance spectroscopy: photon path length and sampling depth,” Phys. Med. Biol. 54(22), 6991–7008 (2009). 10.1088/0031-9155/54/22/016 [DOI] [PubMed] [Google Scholar]
- 9.Kanick S. C., Sterenborg H. J., Amelink A., “Empirical model of the photon path length for a single fiber reflectance spectroscopy device,” Opt. Express 17(2), 860–871 (2009). 10.1364/OE.17.000860 [DOI] [PubMed] [Google Scholar]
- 10.Kanick S. C., Robinson D. J., Sterenborg H. J. C. M., Amelink A., “Method to quantitate absorption coefficients from single fiber reflectance spectra without knowledge of the scattering properties,” Opt. Lett. 36(15), 2791–2793 (2011). 10.1364/OL.36.002791 [DOI] [PubMed] [Google Scholar]
- 11.Kanick S. C., Gamm U. A., Sterenborg H. J. C. M., Robinson D. J., Amelink A., “Method to quantitatively estimate wavelength-dependent scattering properties from multidiameter single fiber reflectance spectra measured in a turbid medium,” Opt. Lett. 36(15), 2997–2999 (2011). 10.1364/OL.36.002997 [DOI] [PubMed] [Google Scholar]
- 12.Gamm U. A., Kanick S. C., Sterenborg H. J., Robinson D. J., Amelink A., “Measurement of tissue scattering properties using multi-diameter single fiber reflectance spectroscopy: in silico sensitivity analysis,” Biomed. Opt. Express 2(11), 3150–3166 (2011). 10.1364/BOE.2.003150 [DOI] [PMC free article] [PubMed] [Google Scholar]
- 13.van Veen R. L. P., Verkruysse W., Sterenborg H. J. C. M., “Diffuse-reflectance spectroscopy from 500 to 1060 nm by correction for inhomogeneously distributed absorbers,” Opt. Lett. 27(4), 246–248 (2002). 10.1364/OL.27.000246 [DOI] [PubMed] [Google Scholar]
- 14.Rajaram N., Gopal A., Zhang X., Tunnell J. W., “Experimental validation of the effects of microvasculature pigment packaging on in vivo diffuse reflectance spectroscopy,” Lasers Surg. Med. 42(7), 680–688 (2010). 10.1002/lsm.20933 [DOI] [PMC free article] [PubMed] [Google Scholar]
- 15.Yokoi T., Yamaguchi A., Odajima T., Furukawa K., “Establishment and characterization of a human cell line derived from a squamous cell carcinoma of the tongue,” Tumor Res. 23, 43–57 (1988). [Google Scholar]
- 16.Carlotti F., Bazuine M., Kekarainen T., Seppen J., Pognonec P., Maassen J. A., Hoeben R. C., “Lentiviral vectors efficiently transduce quiescent mature 3T3-L1 adipocytes,” Mol. Ther. 9(2), 209–217 (2004). 10.1016/j.ymthe.2003.11.021 [DOI] [PubMed] [Google Scholar]
- 17.Cerussi A. E., Berger A. J., Bevilacqua F., Shah N., Jakubowski D., Butler J., Holcombe R. F., Tromberg B. J., “Sources of absorption and scattering contrast for near-infrared optical mammography,” Acad. Radiol. 8(3), 211–218 (2001). 10.1016/S1076-6332(03)80529-9 [DOI] [PubMed] [Google Scholar]
- 18.Turzhitsky V., Mutyal N. N., Radosevich A. J., Backman V., “Multiple scattering model for the penetration depth of low-coherence enhanced backscattering,” J. Biomed. Opt. 16(9), 097006 (2011). 10.1117/1.3625402 [DOI] [PMC free article] [PubMed] [Google Scholar]
- 19.Turzhitsky V., Radosevich A., Rogers J. D., Taflove A., Backman V., “A predictive model of backscattering at subdiffusion length scales,” Biomed. Opt. Express 1(3), 1034–1046 (2010). 10.1364/BOE.1.001034 [DOI] [PMC free article] [PubMed] [Google Scholar]
- 20.Rogers J. D., Capoğlu I. R., Backman V., “Nonscalar elastic light scattering from continuous random media in the Born approximation,” Opt. Lett. 34(12), 1891–1893 (2009). 10.1364/OL.34.001891 [DOI] [PMC free article] [PubMed] [Google Scholar]
- 21.A. Kim and B. C. Wilson, Optical-Thermal Response of Laser-Irradiated Tissue (Springer, 2011), Chap. 8. [Google Scholar]
- 22.Thueler P., Charvet I., Bevilacqua F., St. Ghislain M., Ory G., Marquet P., Meda P., Vermeulen B., Depeursinge C., “In vivo endoscopic tissue diagnostics based on spectroscopic absorption, scattering, and phase function properties,” J. Biomed. Opt. 8(3), 495–503 (2003). 10.1117/1.1578494 [DOI] [PubMed] [Google Scholar]
- 23.Yi J., Backman V., “Imaging a full set of optical scattering properties of biological tissue by inverse spectroscopic optical coherence tomography,” Opt. Lett. 37(21), 4443–4445 (2012). 10.1364/OL.37.004443 [DOI] [PMC free article] [PubMed] [Google Scholar]
- 24.Hall G., Jacques S. L., Eliceiri K. W., Campagnola P. J., “Goniometric measurements of thick tissue using Monte Carlo simulations to obtain the single scattering anisotropy coefficient,” Biomed. Opt. Express 3(11), 2707–2719 (2012). 10.1364/BOE.3.002707 [DOI] [PMC free article] [PubMed] [Google Scholar]
- 25.Xu M., Alfano R. R., “Fractal mechanisms of light scattering in biological tissue and cells,” Opt. Lett. 30(22), 3051–3053 (2005). 10.1364/OL.30.003051 [DOI] [PubMed] [Google Scholar]
- 26.Gomes A. J., Ruderman S., DelaCruz M., Wali R. K., Roy H. K., Backman V., “In vivo measurement of the shape of the tissue-refractive-index correlation function and its application to detection of colorectal field carcinogenesis,” J. Biomed. Opt. 17(4), 047005 (2012). 10.1117/1.JBO.17.4.047005 [DOI] [PMC free article] [PubMed] [Google Scholar]
- 27.Bevilacqua F., Piguet D., Marquet P., Gross J. D., Tromberg B. J., Depeursinge C., “In vivo local determination of tissue optical properties: applications to human brain,” Appl. Opt. 38(22), 4939–4950 (1999). 10.1364/AO.38.004939 [DOI] [PubMed] [Google Scholar]
- 28.Chamot S., Migacheva E., Seydoux O., Marquet P., Depeursinge C., “Physical interpretation of the phase function related parameter γ studied with a fractal distribution of spherical scatterers,” Opt. Express 18(23), 23664–23675 (2010). 10.1364/OE.18.023664 [DOI] [PubMed] [Google Scholar]
- 29.Hoy C. L., Gamm U. A., Sterenborg H. J., Robinson D. J., Amelink A., “Use of a coherent fiber bundle for multi-diameter single fiber reflectance spectroscopy,” Biomed. Opt. Express 3(10), 2452–2464 (2012). 10.1364/BOE.3.002452 [DOI] [PMC free article] [PubMed] [Google Scholar]
- 30.Wilson B. C., Patterson M. S., Lilge L., “Implicit and explicit dosimetry in photodynamic therapy: a New paradigm,” Lasers Med. Sci. 12(3), 182–199 (1997). 10.1007/BF02765099 [DOI] [PubMed] [Google Scholar]


