Abstract
Genetically-encoded methods for protein conjugation are of high importance as biological tools. Here we describe the development of a new class of dyes for genetically encoded tagging that add new capabilities for protein reporting and detection via HaloTag methodology. Oligodeoxyfluoroside (ODFs) are short DNA-like oligomers in which the natural nucleic acid bases are replaced by interacting fluorescent chromophores, yielding a broad range of emission colors using a single excitation wavelength. We describe the development of an alkyl halide dehalogenase-compatible chloroalkane linker phosphoramidite derivative that enables the rapid automated synthesis of many possible dyes for protein conjugation. Experiments in vitro test enzymatic self-conjugation of nine different DNA-like dyes to proteins with HaloTag domains, and the data confirm rapid and efficient covalent labeling of proteins. Notably, a number of the ODF dyes are found to increase in brightness or change color upon protein conjugation. Tests in mammalian cellular settings reveal that the dyes are functional in multiple cellular contexts, both on the cell surface and within the cytoplasm, allowing protein localization to be imaged in live cells by epifluorescence and laser confocal microscopy.
Introduction
Elucidating the movements, locations, interactions, and chemical microenvironments of proteins inside the living cell is crucial for detailed understanding of biomolecular mechanisms and cellular functions. The study of protein interactions and trafficking has been revolutionized by the application of genetically encoded fluorescent proteins, which are available in multiple colors for labeling of separate species.1 More recently, the strategy of small-molecule fluorescent labeling of genetically encoded proteins has become prominent;2-5 this approach can offer the advantage of time resolution of labeling, as the dye can be added at any time during the cell cycle or during organismal development. Most small-molecule approaches take advantage of enzyme mechanisms to covalently attach an appropriate substrate to an engineered protein domain; prominent examples make use of enzymes such as dihydrofolate reductase;6 O6-alkylguanine alkyltransferase,7,8 beta-lactamase,9 and lipoic acid ligase.10 Among the most widely used approaches is that of the HaloTag, which requires only the conjugation of a simple haloalkane moiety to the desired label.11 The original haloalkane dehalogenase is a bacterial enzyme that removes halides from aliphatic hydrocarbons by a nucleophilic displacement mechanism and forms a covalent ester bond between haloalkane and Asp106 in the enzyme.12 A critical mutation in the catalytic active site (H272F) in the HaloTag variant renders the covalent ester bond stable to hydrolysis.11 The engineered HaloTag domain is 34 kiloDaltons in size and is readily co-expressed as a chimera with arbitrary proteins of interest using commercially available vectors. Standard small-molecule fluorophores are available in haloalkyl-derivatized form for labeling proteins of interest.13
The recent rapid growth of fluorescence instrumentation and techniques for biomolecular analysis and imaging has highlighted a need for new optical capabilities in fluorescence labels. Labels that can be physicochemically switched, or act as sensors, or are sensitive to the environment are all under study, but few examples14,15 are yet available for genetically-encoded tagging. Another missing capability is multispectral emission, which refers to sets of differently-colored dyes that share a common excitation. This property enables the simultaneous real-time tracking of multiple labeled species even in rapidly moving systems,16,17 and simplifies equipment since only a single filter set is needed for imaging. One potential fluorophore class that exhibits this multispectral behavior is inorganic quantum dots, which can be excited in the UV and exhibit size-tunable emissions. They can be conjugated to proteins;18 however, difficulties in uniform chemical modification and intracellular delivery, along with their large size and cytotoxicity, can place limits on their applications in cellular settings.18b,19 In general, biological research would benefit from having small, discrete organic labels that exhibit some of these new capabilities, and the ability to employ them in genetically encoded tagging would be broadly useful.
We have undertaken a program to develop a broad class of fluorescent labels using the modular design of DNA.20,21 The DNA bases in these short oligomeric dyes (termed oligodeoxyfluorosides, or ODFs) are replaced by fluorophores; the phosphodiester backbone in ODFs confers aqueous solubility and acts as a scaffold to hold the fluorophores close, promoting complex electronic interactions. The modular structure of ODFs, composed of sequences of fluorophore monomers, facilitates the rapid construction of thousands of dyes with distinct, selectable optical properties,20,22 and enables rapid automated synthesis on a DNA synthesizer. Multiple forms of energy and excitation transfer, such as FRET, exciplex, excimer, H-dimer, and other mechanisms have been observed, yielding dyes with extraordinarily large Stokes shifts, high quantum yields and long fluorescence lifetimes. A broad spectrum of ODFs can be excited at a single wavelength, which offers the possibility of real-time multicolor application in biological systems.17 ODFs have also been identified or designed that respond with fluorescence changes to light exposure,22 or to specific small molecules,23 or to enzyme activities.24
To date, ODFs have only been conjugated to proteins (antibodies in the reported case) nonspecifically, via click reactions to functionalized lysine residues.25 ODFs chemically resemble DNA, and thus one might make use of methodologies of protein conjugation that have been developed for DNA itself;26-29 however, to our knowledge, DNA has yet to be conjugated to proteins via the haloalkane dehalogenase approach. Here we have developed a general strategy for genetically-encoded labeling of proteins with ODF fluorophores (and potentially with DNA as well), by employing the HaloTag haloalkane dehalogenase enzyme. We adapt this technology for covalent tethering of ODF fluorescence dyes directly to proteins in vitro as well as proteins of interest expressed in live cells, and apply it to multispectral cellular imaging.
Experimental Section
Synthesis of halolinker phosphoramidite B8
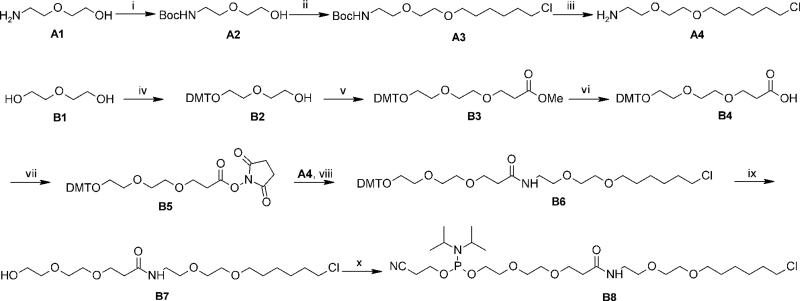
The chlorolinker phosphoramidite derivative B8 was prepared after coupling precursors A4 and B5 (Scheme 1), which were derived from 2-(2-aminoethoxy)ethanol and diethylene glycol, respectively. The NHS ester-mediated coupling product (B6) was further converted in two steps to the desired phosphoramidite derivative, suitable for automated DNA synthesis. Details of the synthesis and characterization data are given in the Supporting Information (SI) file.
Scheme 1.
Reagents and conditions: i) Boc2O, anhyd. EtOH, 0 °C to rt., 2 h, 99%. ii) NaH, 6-chloro-1-iodohexane, THF/DMF, 0 °C to rt, o/n, 69%. iii) TFA, CH2Cl2, 0 °C to rt, 2 h, 81%. iv) DMT-Cl, Et3N, CH2Cl2, rt, 6 h, 67 %. v) Methyl acrylate, NaH, THF, 0 °C, 1 h, 75 %. vi) LiOH, MeOH/H2O, rt, 2h, 93 %. vii) N-hydroxysuccinimide, DCC, CH2Cl2, 0 °C to rt, o/n, 95%. viii) DIPEA, CH2Cl2, rt, o/n, 82%. ix) AcOH, H2O, rt, 2h, 68%. ×) DIPEA, 2-cyanoethyl N,N-diisopropylchlorophosphoramidite, CH2Cl2, 0 °C, 45 min, 98%.
Synthesis of fluorescent monomer F
The bromo-substituted diphenylamino-fluorenyl-benzothiazole dye 6 was prepared from dibromofluorene as outlined in Scheme 2. This was coupled via Pd-mediated Heck chemistry to a common TBDPS-protected dehydrotetrahydrofuran derivative of d-deoxyribose to yield F (compound 7). See SI file for details of the synthetic methods as well as NMR and MS characterization data.
Scheme 2.
Reagents and conditions: i) MeI, KOH, KI, DMSO, rt, 24h, 97%. ii) nBuLi, DMF, THF, -78 °C, 1+2h, 90%. iii) diphenylamine, Cs2CO3, Pd(OAc)2, t-Bu3P, toluene, reflux, 24 h, 67%. iv) 2-Amino-5-bromobenzenethiol 5, TsOH, toluene, reflux, 2 d, 80%. v) Cy2NMe, 3′-O-TBDPS-1,2-dehydro-2-deoxy-d-ribofuranose, Pd(t-Bu3P)2, Bu4NBr, dioxane, 90 C, 36 h. vi) TBAF, AcOH, THF, 0 °C, 1 h, 25% (3 steps). viii) Na(OAc)3BH, HOAc, CH3CN, THF, -10 °C, 1 h. viii) DMT-Cl, pyridine, DIPEA, rt, 3 h, 82%.
Synthesis of fluorescent ODF-HaloTag ligands
ODF-HaloTag ligands were synthesized on an Applied Biosystems 394 DNA/RNA synthesizer, using 3′-phosphate CPG columns at 1 Gmole scale with the DMT-off method. Coupling of each monomer used standard 3′ to 5′ cyanoethyl phosphoramidite chemistry with extended coupling time (999 s). The oligomers were cleaved (from CPG resin) and deprotected by overnight incubation with 0.05 M K2CO3 in methanol. The purification was carried out utilizing a Shimadzu Series HPLC with an Alltech C5 column with acetonitrile and TEAA buffer (100 mM, pH 7.2) as eluents. The identities of ODF-HaloTag ligands were confirmed by absorption spectra and MALDI-TOF-MS analysis. See SI for details.
Construction and expression of HaloTag fusion protein vectors
The vector encoding α-tubulin-HaloTag fusion protein was constructed by inserting the α-tubulin gene between the NcoI and BamHI sites of commercially available HaloTag plasmid pFN21A (Promega, G2821), a mammalian expression vector. The plasmid encoding cell surface-HaloTag fusion protein was obtained from Dr. S. Gambhir (Stanford University), and was constructed by inserting the HaloTag protein gene into the pDisplay vector (Invitrogen). The resulting plasmids were then transformed into Top-10 bacterial cells using a standard heat shock method. The transfected cells were propagated in LB media at 37 °C. Isolated plasmids were characterized by agarose DNA gel and DNA sequencing analysis. See SI for details.
Optical and microscopy studies
Absorption measurements were carried out on a Varian Cary 100 Bio UV Visible spectrophotometer. Fluorescence emission spectra were measured on a Jobin Yvon-Spex Fluorolog 3 spectrophotometer by exciting ODFs at 344 nm and collecting the emission between 365 nm to 750 nm. The fluorescence emission spectra of protein-ODF conjugates were performed on FLEXstation II-384-fluorescent plate reader. The cellular imaging was performed on a Leica sp5 confocal microscope with a PL APO 63x oil objective. During imaging HeLa cells were in phenol-free DMEM. The ODFs were excited at 405 nm with an argon laser source.
Cell culture, transfection and labeling
HeLa cells were cultured in DMEM w/ glutamine (Gibco #11995) with 10% v/v fetal bovine serum and 1% v/v Pen/Strep. All cells were maintained under 5% CO2 at 37 °C. For live cell imaging, cells were plated in Lab-Tek 8-well chambered coverglass slides (Nunc 155409) 24 h before transfection. Thereafter HeLa cells were transfected with HaloTag fusion plasmids (2.0 μg DNA per well) using Lipofectamine 2000 transfection reagent (Invitrogen) following the manufacturer's protocol. After transfection, cells were incubated in growth media for 48 h. The protein labeling was performed by incubating HeLa cells in 200 μL growth media DMEM (without FBS and Pen/Strep) containing 5.0 μM ODF HaloTag ligand for 15 min at 37 °C. After labeling, staining media was removed and cells were washed two times with PBS, and a final washing was performed by incubating cells in phenol- free media (DMEM) at 37 °C for 30 min. Before imaging, the medium was replaced with fresh phenol-free medium.
Results
Design and synthesis of ODF-HaloTag substrates
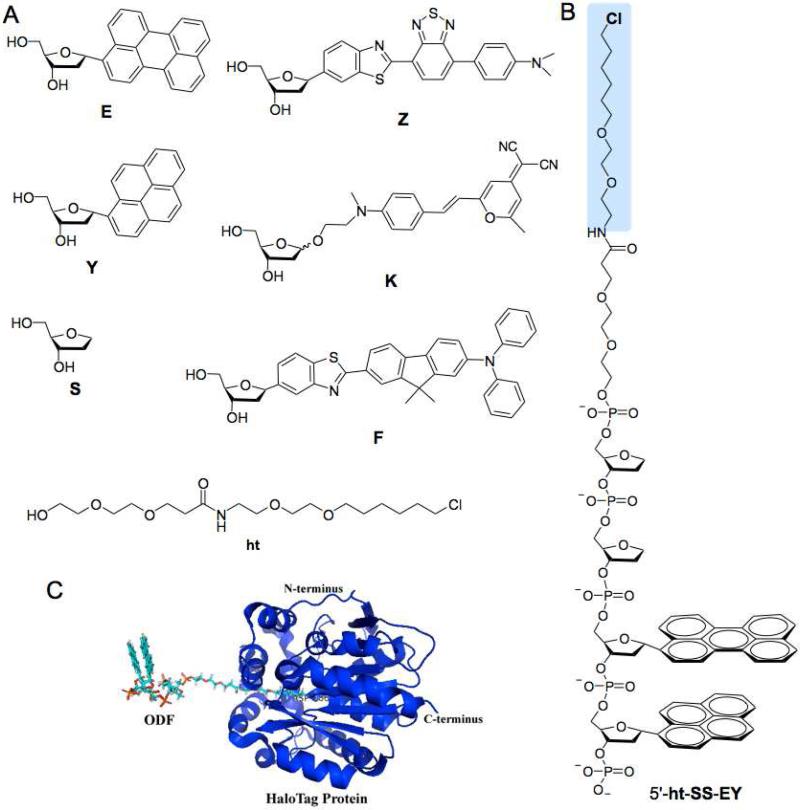
To prepare ODF fluorescent dyes as possible substrates for the HaloTag dehalogenase, we required a haloalkane linker that could be placed at the end of an ODF sequence. Probably the most straightforward way to conjugate DNA is to incorporate the conjugate during DNA synthesis; with this in mind, we designed a new phosphoramidite reagent (designated ht) which has a chlorohexyl group at the terminus of a longer linker (Figure 1). The synthesis of chlorolinker phosphoramidite reagent (B8) was efficient and straightforward (Scheme 1 and Supporting Information (SI)); the amino-functionalized chlorolinker (A4) was derived from 2-(2-aminoethoxy)ethanol (A1) in two steps, which was then coupled with DMT-protected NHS ester of diethylene glycol propionic acid (B5). Two routine steps subsequently yielded the desired phosphoramidite reagent (B8).
Figure 1.
Structures in this study. A) Monomers used for making chloroalkyl-ODF HaloTag ligands. B) Structure of a typical ODF-HaloTag ligand with the sequence of 5′-htS2EY (haloalkyl group marked in blue). C) Illustration of conjugate between the engineered dehalogenase enzyme and an ODF ligand (5′-htS2EY).
Having the functional group in hand, we then prepared a test set of ODF dyes with a range of emission colors. The fluorescent building blocks (previously described monomers E, Y, K, Z)20,25,30,31 (Fig. 1) were synthesized according to literature procedures. In order to include more opportunities for green emission in the ODF-HaloTag ligands, we synthesized one new green-emitting monomer (F, Fig. 1) following the synthetic procedure shown in Scheme 2. Monomer F absorbs maximally at 393 nm and emits fluorescence at 495 nm with a quantum yield of 0.37 (see Figure S1 in the SI). In addition to the five fluorescent monomers, we also added a commercially available tetrahydrofuran spacer (S) to increase both the water solubility of the ODF and the distance between ODF and the protein, to avoid unfavorable interactions that might hinder reaction.
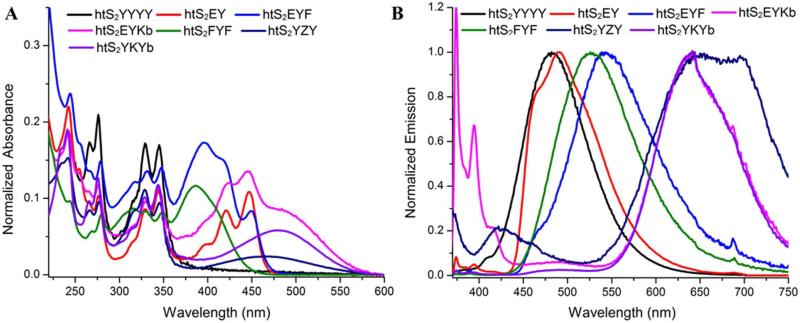
A set of seven different ODF sequences was chosen, containing varied combinations of the five fluorescent monomers, as possible HaloTag substrates. The chloroalkyl-ODF compounds were prepared on DNA synthesizer using 3′-phosphate-ON CPG columns (see SI). After HPLC purification, they were characterized by MALDI mass spectrometry (Table S1) as well as by their absorption and emission spectra. The ODF monomers were used in their anomerically pure forms except for monomer K, which was a mixture of α- and β-anomers as reported.20a By HPLC we were able to separate both the anomers of K in ODFs that contained it (htS2EYK and htS2YKY); these were studied separately in further experiments (see below). The absorption spectra of the nine ODF-HaloTag ligands showed diverse absorption profiles but they all had strong absorption at 344 nm (Figure 2a). As a result, we used this wavelength for fluorophore excitation in subsequent fluorescence analyses.
Figure 2.
Spectra of ODF-HaloTag ligands. A) Absorption spectra, and B) normalized fluorescence emission spectra. Conditions: 2.0 μM ODF-HaloTag ligand in PBS (ex. 344 nm).
The fluorescence spectra of the ODF-HaloTag ligands show emission across the full visible spectrum (from 360-750 nm) with the single 344 nm excitation (Figure 2b and SI). Upon comparing photophysical properties of the two anomers of K-containing ODF-HaloTag ligands we found, not surprisingly, that both the anomers of htS2YKY (htS2YKYa and htS2YKYb) have essentially identical absorption and fluorescence emission properties (see Figure S2). However, the anomers of htS2EYK (htS2EYKa and htS2EYKb) behaved differently: while their absorption profiles were identical, their emission properties were different (Fig. S2). Among all nine ODF-HaloTag ligands, htS2EY had highest quantum yield (0.65), and htS2YYYY displayed the longest fluorescence lifetime (7 and 42 ns; see Table S1). We also tested the photostability of the dyes in the absence of antifade reagents (Fig. S17). Two were more rapidly bleached than fluorescein (the dyes containing monomer F); one showed stability approximately equal to that of fluorescein (htS2YYYY); and three dyes (those containing chromophores EY, EYK, and YKY) were exceptionally stable, with resistance to photobleaching as least as good as that of the stable commercial dye Alexa 350.
HaloTag fusion protein expression and labeling
For in vitro protein labeling experiments, we constructed a vector encoding glutathione S-transferase (GST)-halotag fusion protein (see SI and Figure S3). The fusion protein was expressed in a KRX E. coli bacterial strain, and the overexpression of fusion protein was achieved by overnight incubation of bacterial culture in the presence of 0.05% rhamnose. The GST-HaloTag fusion protein was purified by passing cell lysate through GST affinity resin and subsequent elution with 10 mM glutathione. In addition to the GST-halotag fusion protein, we also obtained the HaloTag protein alone by cleaving a TEV protease linker between the domains. The identity and purity of both proteins was confirmed by SDS-PAGE and ESI mass spectrometry (see Figures S4-S6).
To test initially whether a chloroalkyl-substituted ODF could be functional in HaloTag labeling, we separately incubated GST-HaloTag fusion protein and HaloTag protein in the presence of 5.0 μM chloroalkyl-ODF htS2EY in PBS for 30 min. The formation of a covalent bond between ODF and protein was confirmed for both proteins by the presence of fluorescence signals specifically in the protein treated with ODF-HaloTag ligand, after separation on SDS-PAGE gels (Fig. S4). Thereafter, the efficiency of labeling was investigated by performing ODF concentration-dependent and reaction time-dependent experiments. These data are shown in the SI; results confirmed the need for at least equimolar amounts of ODF for a given amount of protein for labeling as expected (Fig. S7). The time-dependent experiments revealed complete labeling within five minutes using low-micromolar concentrations of chloroalkyl ODF and protein (Fig. S8).
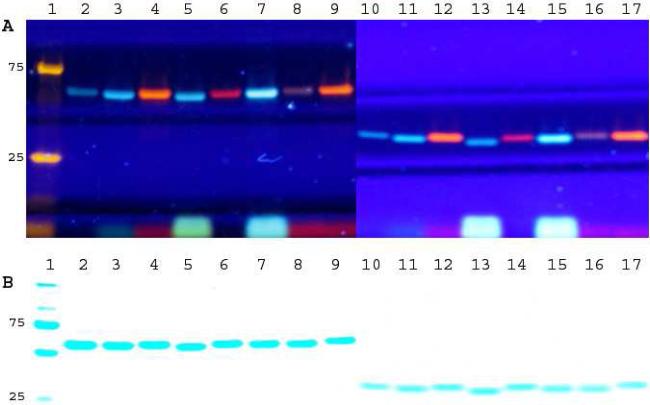
We then proceeded to test the general applicability of ODFs in protein labeling, treating GST-HaloTag fusion protein as well as Halotag protein alone (~2.0 μM) separately with the nine synthesized ODF ligands (4.0 μM each). The labeled proteins were then resolved and analyzed by SDS-PAGE. The fluorescence image of the gel, which was visualized with excitation at 365 nm, showed that multicolored protein labeling can be achieved by using ODF fluorescent dyes (see Figure 3). Multispectral emission colors were also observed upon excitation at 457 nm (which corresponds to another absorption peak common to several of the ODFs), but yielding different colors (Figure S9). Comparing the gel fluorescence intensity of free ODF-HaloTag ligands with the protein-conjugated ODFs, we found that several of the ODFs (htS2YYYY, htS2EY, htS2EYF, htS2YZY) showed apparent lighting-up responses upon conjugation to protein, and some of the ODFs (htS2YKY, htS2EYK) changed their color with protein conjugation (see Figs. 3 and S9). We also observed, interestingly, that the anomers of htS2EYK (htS2EYKa and htS2EYKb) before protein conjugation displayed similar colors, but after protein conjugation they were clearly different in hue (see Figure 3A, lane 8 and 9). This was reproducible, and was seen for both proteins.
Figure 3.
Multispectral labeling of GST-HaloTag fusion protein (lane 2-9) and HaloTag protein (lane 10-17) with ODF-HaloTag ligands. A) fluorescence image (Ex 365 nm), and B) Coomassie blue staining: lane 1: marker, lane 2 & 10: htS2YYYY, lane 3 & 11: htS2EY, lane 4 & 12: htS2YKY, lane 5 & 13: htS2FYF, lane 6 & 14: htS2YZY, lane 7 & 15: htS2EYF, lane 8 & 16: htS2EYKa, lane 9 & 17: htS2EYKb.
Characterizing protein-ODF conjugates
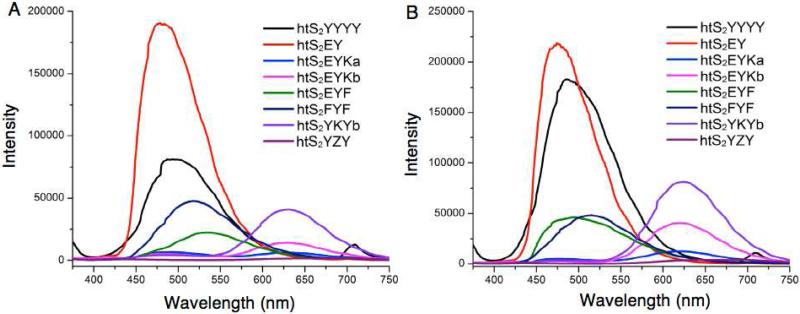
The multicolor protein gel observations indicated that the fluorescence properties of some ODF-HaloTag ligands were affected due to a change in their local environment upon protein conjugation. To explore this in more detail, we prepared HaloTag protein-ODF conjugates on larger scale and compared their optical properties with unbound ODF-HaloTag ligands at known concentrations by fluorescence spectrometry (see Figs. 4 and S10-11). The data show that the fluorescence intensity of four of the ODF-HaloTag ligands was enhanced significantly upon conjugation with protein (see Figs. 4 and S10). The strongest increases occurred with the dyes htS2EYKb (2.9-fold) and htS2YKY (2.7-fold).
Figure 4.
Fluorescence emission spectra ODF ligands alone (A) and of protein-ODF conjugates (B). ODF-HaloTag ligands are 1.0 μM in PBS; protein-ODF conjugates prepared from ODF 1.0 μM, HaloTag protein 2.5 μM, PBS, 30 min, 37 °C. Ex 344 nm.
In addition, the emission maximum of the htS2EYF ligand shifted markedly toward the blue upon protein conjugation, yielding a shift of 42 nm, along with a ~2-fold enhancement in brightness (Figure S10). As observed on the gel, the isomers of htS2EYK (htS2EYKa and htS2EYKb) both showed marked spectral changes upon protein conjugation. The “b” isomer, which exhibits one main emission band, yielded a strong lightup signal, while the “a” isomer, which started as two nearly equal peaks, shifted in color substantially: a 480 nm peak decreased in intensity while a 620 nm peak increased strongly, yielding a 2.5-fold change in peak height ratios (Fig. S10).
Cellular labeling and imaging
To test the application of ODFs in cellular imaging of proteins, we expressed HaloTag fusion proteins in HeLa cells and then treated the cells with chloroalkane-ODFs to achieve labeling. Initially, we expressed a cell surface protein (platelet-derived growth factor receptor transmembrane domain (PDGFR-TM)) fused with the HaloTag domain. Forty-eight hours post-transfection, the cells were labeled by incubating them for 15 min in growth media containing 5.0 μM ODF-HaloTag ligands. No cell uptake reagents were used, and excess dye was removed by exchanging medium. We used htS2EY ODF-HaloTag ligand for cyan color, htS2FYF for green labeling, and htS2YKY for red color in separate experiments. The presence of fluorescence on the surface of each HeLa cell expressing cell surface protein showed apparent labeling of cell surface protein with ODF-HaloTag ligands (Figs. 5a-c and S15). Control cells lacking the HaloTagged fusion protein showed (after dye treatment) lower fluorescence on the cell surface and a small amount of fluorescence in the cytoplasm (see Figure S12). The formation of a stable covalent bond between cell surface protein and ODFs was confirmed by protein gel analysis. For that, the labeled HeLa cells expressing cell surface protein as well as control cells were lysed and the protein was resolved by SDS-PAGE (see Figure 5D). The presence of a fluorescence band at 66.8 kD in the cells expressing fusion protein and not in the control cells confirmed labeling of cell surface fusion protein with ODF HaloTag ligands.
Figure 5.
Imaging cell surface protein in live HeLa cells with ODF-HaloTag ligands (A-C) by confocal microscopy (excitation 405 nm; bar denotes ca. 20 microns). (D,E) SDS PAGE gel of cell extracts showing labeling of 66.8 kD cell surface protein (D: fluorescence scan; E: Coomassie blue staining). Lane 1: size marker, lane 2: control HeLa cells, lane 3: HeLa cells expressing cell surface protein.
Next we attempted the labeling of a cytoplasmic protein with chloroalkyl-ODF labels. To achieve this, HeLa cells were transfected with a fusion vector encoding α-tubulin-HaloTag fusion protein. After transfection and incubation (48 h), fusion protein was labeled with cyan, green or red ODF HaloTag ligand (5.0 μM, 60 min) and labeled cells were then imaged under a confocal microscope. The presence of fluorescence in the entire cytoplasmic region of Hela cells expressing α-tubulin fusion protein indicated labeling of cytoplasmic protein by the ODF-halotag ligands (see Figure 6; Figure S16 shows Z stacks). Labeling resolution and efficiency were similar to that achieved by a commercial TMR-halotag dye (Fig. S13). Similar to the prior cell-surface protein labeling experiments, the covalent bond formation between ODF-HaloTag ligands and cytoplasmic protein was established by the presence of a fluorescent band at 88.5 kD (corresponding to the molecular weight of the fusion protein) in the cell lysate of HeLa cells expressing this protein (Figure 6D). The fluorescent bands were absent in the lysate of control HeLa cells treated with the dyes.
Figure 6.
Imaging α-tubulin in live HeLa cells after labeling cytoplasmic tubulin-Halotag fusion protein with three different chloroalkyl-ODF ligands (A-C) (excitation 405 nm; bar denotes ca. 5 microns). (D,E) SDS PAGE gel of cell extracts showing labeling of 88.5 kD fusion protein (D: fluorescence scan; E: Coomassie blue staining). Lane 1: size marker, lane 2: control HeLa cells, lane 3: HeLa cells expressing α-tubulin fusion protein.
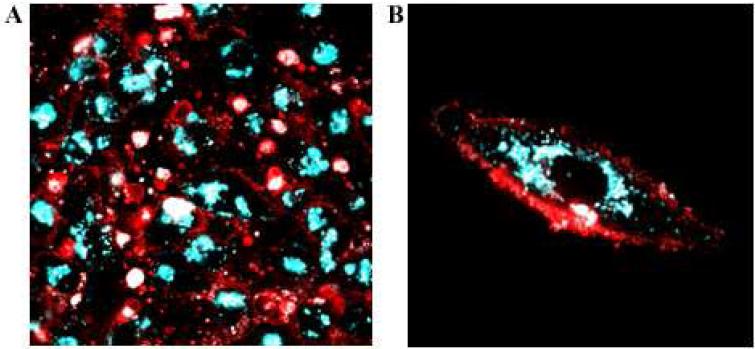
The above experiments demonstrated that ODFs can be employed in genetically-encoded protein labeling both on the surface and interior of cells. Since ODFs are capable of emitting a broad range of colors across the visible spectrum with single-wavelength excitation, they offer the capability of simultaneously visualizing two or more proteins located in different cellular compartments. To test this, we expressed cytoplasmic α-tubulin in HeLa cells and labeled it with htS2EY (cyan). Thereafter, the same cells were transfected with a vector encoding cell surface fusion protein, which was then labeled (after 48 h expression time) with htS2YKY (red). The confocal imaging clearly demonstrated distinguishable labeling of cell surface and cytoplasmic proteins with two different ODF colors using a single 405 nm laser excitation line (see Figure 7). During the dual labeling experiment, lower fluorescence was observed in the cytoplasm as compared to cytoplasmic protein labeling experiments above, which is expected since the continuous division of HeLa cells during the incubation time dilutes the initially labeled cytoplasmic protein.
Figure 7.
Live HeLa cell imaging showing two-color, single-excitation protein labeling. Cytoplasmic α-tubulin was first expressed and labeled with cyan ODF HaloTag ligand htS2EY, and cell surface protein was then expressed and (48 h later) labeled with red htS2YKY. Laser confocal imaging was carried out in phenol-free growth media (excitation 405 nm). A) Multiple cell view. B) Closeup of single cell.
Discussion
Our experiments show rapid and high-yielding conjugation of HaloTag domains by ODF dyes using the chloroalkane linker developed here. Reactions appear to proceed to apparently 100% yield in vitro, and are complete in less than five minutes. The experiments confirm that the alkane dehalogenase domain can accept organic substrates larger than conventional small-molecule dyes, and that the multiple negative charges of the ODFs do not present a significant barrier to reaction. Examination of the structure of the chloroalkane recognition channel of the enzyme13 suggests that a chain longer than ca. 15 Å is sufficient to place the conjugated species outside the enzyme, into solution. With the current linker, the length is ca. 27 Å in extended conformation, allowing ample distance for the ODF to reside in solution once conjugated.
Interestingly, some of the ODFs tested here change their fluorescence emission properties upon conjugation. Most prominent are the dyes htS2EYKb and htS2YKY, which increase brightness by 2.9- and 2.7-fold respectively, and htS2EYF, which shifts to the blue (from 530 to 488 nm) upon HaloTag conjugation. Also noteworthy is the ratiometric response observed in the dye htS2EYKa. The changes suggest that although the ODF moieties could extend into solution given the chain length, they may (at least in these cases) interact with the nearby protein surface, resulting in these changes. This does not appear to be a general effect of ODF-protein conjugation; for example, several ODF dyes conjugated to antibodies previously showed little spectral change.25 In the practical sense, however, such emission changes can be useful by yielding enhanced brightness in application, and in distinguishing conjugated dyes from nonconjugated ones.
The current experiments establish facile cell-surface labeling by ODFs that are HaloTagged to chimeric cell-surface proteins, with labeling complete in less than 15 minutes. More surprising is the finding that intracellular proteins in intact cells can be tagged by ODFs as well, despite their multiple negative charges. We have previously observed that ODFs are taken up by cells in a charge-dependent fashion, with shorter sequences (having fewer charges) entering cells more readily.32 For cases that are slower to enter cells, the use of cationic lipid delivery agents has provided effective uptake; note, however, that no lipid delivery agents were used here. We have previously observed that the addition of hydrophobic structure to an ODF appears to enhance uptake without the aid of cationic lipids,24,32 consistent with previous studies of oligonucleotides.33 In the present case, it seems likely that the added haloalkane linker increases the hydrophobicity of the ODFs substantially, which may well enhance cellular uptake. Controlled studies would be needed to confirm this, but in the practical sense we observed no difficulties labeling an intracellular protein with the current ODF ligands. This establishes the first successful strategy for intracellular labeling with multispectral dyes; although quantum dots also have this useful optical property and can be adapted to HaloTag conjugation,18 they have been applied only to extracellular labeling, possibly because of limitations in cellular uptake.
In addition to its possible favorable effects on uptake, the chloroalkane reactive group is notably stable here. The chloroalkane phosphoramidite reagent used here is easily handled during its synthesis and is stable to DNA synthesis, deprotection and purification chemistries. Not only does this make it trivial to conjugate ODF dyes to proteins, but it should also make it possible more generally to conjugate DNAs or RNA oligonucleotides via their 5′-termini to proteins as well. Such nucleic acid-protein conjugates can have many uses in analyte detection, in arraying methodologies and in nanostructure assembly.34-36
The current experiments demonstrate successful HaloTagging for several different ODF dyes with distinct colors. Our results show no strong differences among the sequences in efficiency of tagging, suggesting that the chloroalkane-ODFs are essentially modular. This implies that any of thousands of possible ODF dyes having wide-ranging excitation and emission properties20 might be employed in the same way. Moreover, since different ODFs have been developed recently not only for static fluorescence emission but also sensing,22,24,37 the results suggest the future possibility of genetically encoded tagging of proteins of interest with sensors of small molecules or reporters of enzyme activities. More work will be needed to explore this possibility.
Supplementary Material
ACKNOWLEDGMENT
We thank Dr. Malaya K. Sahoo (Pathology Department, Stanford University) for his helpful suggestions on experimental methods. We acknowledge the U.S. National Institutes of Health (GM067201 and GM072705) for support.
ABBREVIATIONS
- HPLC
high performance liquid chromatography
- GST
Glutathione S-transferase
- mw
molecular weight
- kD
kiloDaltons
- o/n
overnight
- rt
room temperature
- ODF
oligodeoxyfluoroside
- FRET
Förster resonance energy transfer
Footnotes
Supporting Information. Experimental details, synthetic procedures, protein expression and labeling procedures, and NMR spectral data of new compounds. This material is available free of charge via the Internet at http://pubs.acs.org.
References
- 1.Giepmans BN, Adams SR, Ellisman MH, Tsien RY. Science. 2006;312:217–224. doi: 10.1126/science.1124618. [DOI] [PubMed] [Google Scholar]
- 2.Llopis J, Tsien RY. J. Am. Chem. Soc. 2002;124:6063–6076. doi: 10.1021/ja017687n. [DOI] [PubMed] [Google Scholar]
- 3.Miller LW, Cornish VW. Curr. Opin. Chem. Biol. 2005;9:1–6. doi: 10.1016/j.cbpa.2004.12.007. [DOI] [PubMed] [Google Scholar]
- 4.Gronemeyer T, Godin G, Johnsson K. Curr. Opin. Biotechnol. 2005;16:453–458. doi: 10.1016/j.copbio.2005.06.001. [DOI] [PubMed] [Google Scholar]
- 5.Chen I, Ting A. Curr. Opin. Biotechnol. 2005;16:35–40. doi: 10.1016/j.copbio.2004.12.003. [DOI] [PubMed] [Google Scholar]
- 6.Miller LW, Cai Y, Sheetz MP, Cornish VW. Nat. Methods. 2005;2:255–257. doi: 10.1038/nmeth749. [DOI] [PubMed] [Google Scholar]
- 7.Keppler A, Pick H, Arrivoli C, Vogel H, Johnsson K. Proc. Natl. Acad. Sci. U.S.A. 2004;101:9955–9959. doi: 10.1073/pnas.0401923101. [DOI] [PMC free article] [PubMed] [Google Scholar]
- 8.Gautier A, Juillerat A, Heinis C, Corrêa IR, Jr., Kindermann M, Beaufils F, Johnsson K. Chem. Biol. 2008;15:128–136. doi: 10.1016/j.chembiol.2008.01.007. [DOI] [PubMed] [Google Scholar]
- 9.Watanabe S, Mizukami S, Hori Y, Kikuchi K. Bioconj. Chem. 2010;21:2320–2326. doi: 10.1021/bc100333k. [DOI] [PubMed] [Google Scholar]
- 10.Uttamapinant C, White KA, Baruah H, Thompson S, Fernández-Suárez M, Puthenveetil S, Ting AY. Proc. Natl. Acad. Sci. U.S.A. 2010;107:10914–10919. doi: 10.1073/pnas.0914067107. [DOI] [PMC free article] [PubMed] [Google Scholar]
- 11.Los GV, Encell LP, McDougall MG, Hartzell DD, Karassina N, Zimprich C, Wood MG, Learish R, Ohana RF, Urh M, Simpson D, Mendez J, Zimmerman K, Otto P, Vidugiris G, Zhu J, Darzins A, Klaubert DH, Bulleit RF, Wood KV. ACS Chem. Biol. 2008;3:373–382. doi: 10.1021/cb800025k. [DOI] [PubMed] [Google Scholar]
- 12.Newman J, Peat TS, Richard R, Kan L, Swanson PE, Affholter JA, Holmes IH, Schindeler JF, Unkefer CJ, Terwilliger TC. Biochemistry. 1999;38:16105–16114. doi: 10.1021/bi9913855. [DOI] [PubMed] [Google Scholar]
- 13.a Los GV, Wood K. Methods Mol. Biol. 2007;356:195–208. doi: 10.1385/1-59745-217-3:195. [DOI] [PubMed] [Google Scholar]; b Kosaka N, Ogawa M, Choyke PL, Karassina N, Corona C, McDougall M, Lynch DT, Hoyt CC, Levenson RM, Los GV, Kobayashi H. Bioconjugate Chem. 2009;20:1367–1374. doi: 10.1021/bc9001344. [DOI] [PMC free article] [PubMed] [Google Scholar]; c http://www.promega.com/products/protein-expression-and-mass-spectrometry/protein-labeling-and-detection/halotag-technology-products/halotag-fluorescent-ligands.
- 14.Maurel D, Banala S, Laroche T, Johnsson K. ACS Chem. Biol. 2010;5:507–516. doi: 10.1021/cb1000229. [DOI] [PubMed] [Google Scholar]
- 15.Lee HL, Lord SJ, Iwanaga S, Zhan K, Xie H, Williams JC, Wang H, Bowman GR, Goley ED, Shapiro L, Twieg RJ, Rao J, Moerner WE. J. Am. Chem. Soc. 2010;132:15099–16101. doi: 10.1021/ja1044192. [DOI] [PMC free article] [PubMed] [Google Scholar]
- 16.Serge A, Bertaux N, Rigneault H, Marguet D. Nat. Methods. 2008;5:687–694. doi: 10.1038/nmeth.1233. [DOI] [PubMed] [Google Scholar]
- 17.Wang S, Guo J, Ono T, Kool ET. Angew. Chem. Int. Ed. 2012;51:7176–7180. doi: 10.1002/anie.201201928. [DOI] [PMC free article] [PubMed] [Google Scholar]
- 18.a Zhang Y, So MK, Loening AM, Yao H, Gambhir SS, Rao J. Angew. Chem. Int. Ed. 2006;45:4936–4940. doi: 10.1002/anie.200601197. [DOI] [PubMed] [Google Scholar]; b So M, Yao H, Rao J. Biochem. Biophys. Res. Commun. 2008;374:419–423. doi: 10.1016/j.bbrc.2008.07.004. [DOI] [PMC free article] [PubMed] [Google Scholar]
- 19.a Resch-Genger U, Grabolle M, Cavaliere-Jaricot S, Nitschke R, Nann T. Nat. Methods. 2008;5:763–775. doi: 10.1038/nmeth.1248. [DOI] [PubMed] [Google Scholar]; b Smith AM, Nie S. Nat. Biotechnol. 2009;27:732–733. doi: 10.1038/nbt0809-732. [DOI] [PMC free article] [PubMed] [Google Scholar]; c Byers RJ, Hitchman ER. Prog. Histochem. Cytochem. 2011;45:201–237. doi: 10.1016/j.proghi.2010.11.001. [DOI] [PubMed] [Google Scholar]
- 20.a Teo YN, Wilson JN, Kool ET. J. Am. Chem. Soc. 2009;131:3923–3933. doi: 10.1021/ja805502k. [DOI] [PMC free article] [PubMed] [Google Scholar]; b Gao J, Strässler C, Tahmassebi DC, Kool ET. J. Am. Chem. Soc. 2002;124:11590–11591. doi: 10.1021/ja027197a. [DOI] [PubMed] [Google Scholar]
- 21.Wilson JN, Kool ET. Org. Biomol. Chem. 2006;4:4265–4274. doi: 10.1039/b612284c. [DOI] [PubMed] [Google Scholar]
- 22.Gao J, Watanabe S, Kool ET. J. Am. Chem. Soc. 2004;126:12748–12749. doi: 10.1021/ja046910o. [DOI] [PubMed] [Google Scholar]
- 23.Samain F, Ghosh S, Teo YN, Kool ET. Angew. Chem. Int. Ed. 2010;49:7025–7029. doi: 10.1002/anie.201002701. [DOI] [PMC free article] [PubMed] [Google Scholar]
- 24.Dai N, Teo YN, Kool ET. Chem. Commun. 2010;46:1221–1223. doi: 10.1039/b926338a. [DOI] [PMC free article] [PubMed] [Google Scholar]
- 25.Guo J, Wang S, Dai N, Teo YN, Kool ET. Proc. Natl. Acad. Sci. U.S.A. 2011;108:3493–3498. doi: 10.1073/pnas.1017349108. [DOI] [PMC free article] [PubMed] [Google Scholar]
- 26.Niemeyer CM, Adler M, Gao S, Chi L. Bioconj. Chem. 2001;12:364–371. doi: 10.1021/bc000090x. [DOI] [PubMed] [Google Scholar]
- 27.Jongsma MA, Litjens RHGM. Proteomics. 2006;6:2650–2655. doi: 10.1002/pmic.200500654. [DOI] [PubMed] [Google Scholar]
- 28.Duckworth BP, Chen Y, Wollack JW, Sham Y, Mueller JD, Taton TA, Distefano MD. Angew. Chem. Int. Ed. 2007;46:8819–8822. doi: 10.1002/anie.200701942. [DOI] [PubMed] [Google Scholar]
- 29.Shimada J, Maruyama T, Hosogi T, Tominaga J, Kamiya N, Goto M. Biotechnol. Lett. 2008;30:2001–2006. doi: 10.1007/s10529-008-9784-4. [DOI] [PubMed] [Google Scholar]
- 30.Chaudhuri NC, Ren RX, Kool ET. Synlett. 1997:341–347. doi: 10.1055/s-1997-788. [DOI] [PMC free article] [PubMed] [Google Scholar]
- 31.Strässler C, Davis NE, Kool ET. Helv. Chim. Acta. 1999;82:2160–2171. doi: 10.1002/(sici)1522-2675(19991215)82:12<2160::aid-hlca2160>3.0.co;2-4. [DOI] [PMC free article] [PubMed] [Google Scholar]
- 32.Teo YN. Ph.D. Thesis. Stanford University; Stanford, CA 94305, USA: Aug, 2010. [Google Scholar]
- 33.Wolfrum C, Shi S, Jayaprakash KN, Jayaraman M, Wang G, Pandey RK, Rajeev KG, Nakayama T, Charrise K, Ndungo EM, Zimmermann T, Koteliansky V, Manoharan M, Stoffel M. Nat. Biotechnol. 2007;25:1149–1157. doi: 10.1038/nbt1339. [DOI] [PubMed] [Google Scholar]
- 34.Kazane SA, Sok D, Cho EH, Uson ML, Kuhn P, Schultz PG, Smider VV. Proc. Natl. Acad. Sci. U.S.A. 2012;109:3731–3736. doi: 10.1073/pnas.1120682109. [DOI] [PMC free article] [PubMed] [Google Scholar]
- 35.Niemeyer CM, Sano T, Smith CL, Cantor CR. Nucleic Acids Res. 1994;22:5530–5539. doi: 10.1093/nar/22.25.5530. [DOI] [PMC free article] [PubMed] [Google Scholar]
- 36.Niemeyer CM. Angew. Chem. Int. Ed. 2010;49:1200–1216. doi: 10.1002/anie.200904930. [DOI] [PubMed] [Google Scholar]
- 37.Tan SS, Kool ET. J. Am. Chem. Soc. 2011;133:2664–2671. doi: 10.1021/ja109561e. [DOI] [PMC free article] [PubMed] [Google Scholar]
Associated Data
This section collects any data citations, data availability statements, or supplementary materials included in this article.


