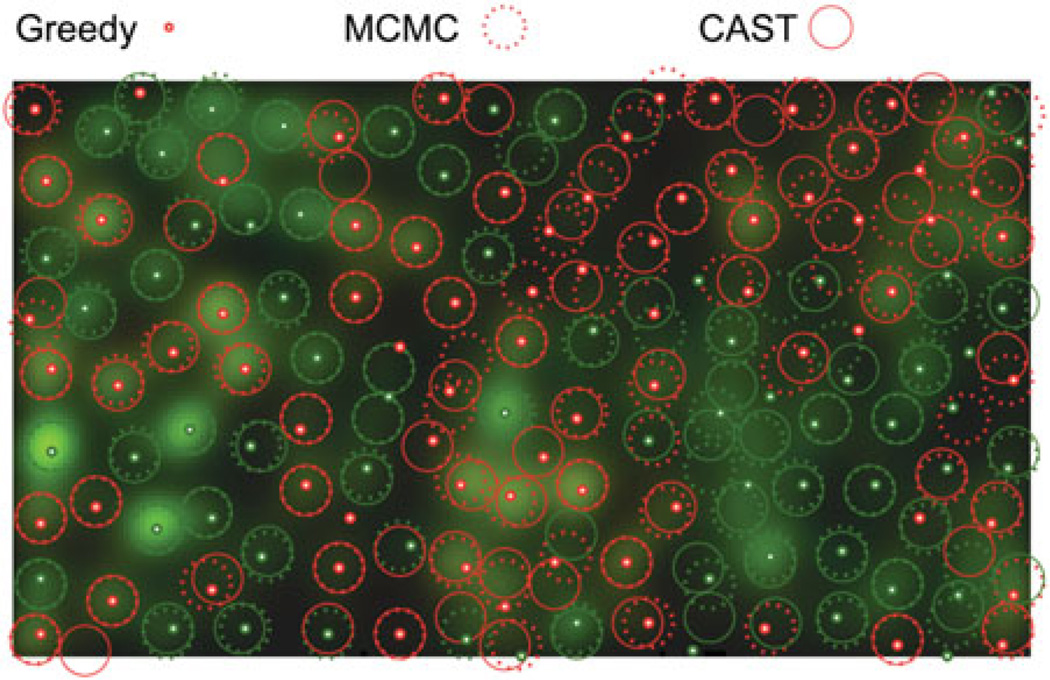
Figure 7.
First dataset: superposition of the greedy configuration, the most likely configuration out of 3 × 10⁶ iterations worth of MCMC runs, and the most likely out of as many iterations of CAST runs. The background color-scale image is a depiction of the evidence for the presence of cones of different colors across visual space (see main text).

