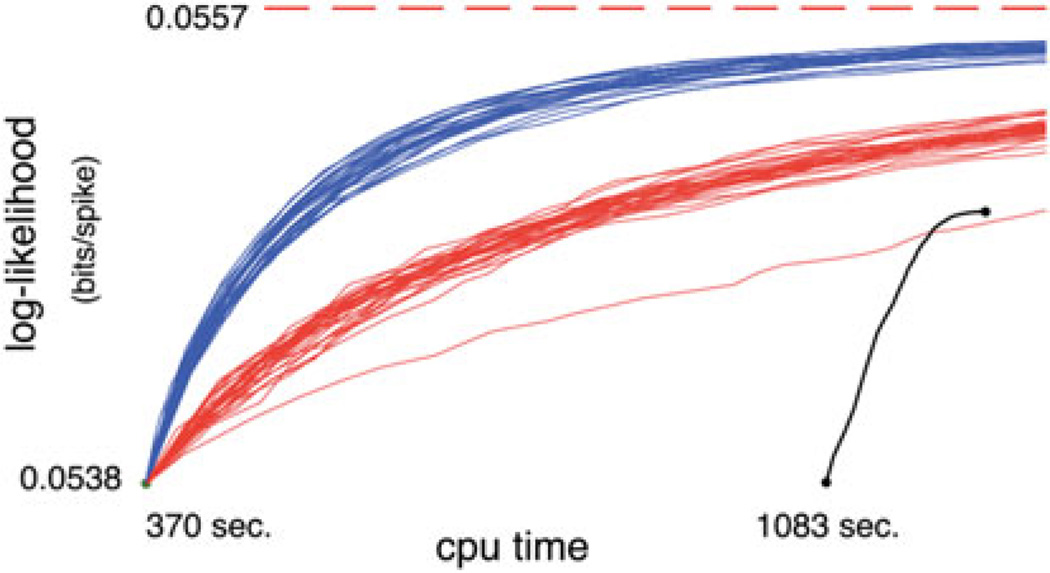
Figure 9.
The log-likelihoods attained by the greedy (black), MCMC (blue), and CAST (red) methods are plotted against CPU run time, for the second, larger dataset. All times and likelihoods smaller than those obtained from the lazy greedy algorithm (green dot) are not shown; in particular, the first 1083 seconds of the greedy algorithm, during which the greedy configuration had a smaller likelihood than the lazy greedy configuration, are not shown. All the MCMC and CAST runs were initialized with the lazy greedy configuration: each run starts at the same green dot. The thick dotted red line indicates the best likelihood eventually obtained from the best of 30 CAST runs, after 36 hours.

