

Abstract
Polyamidoamine (PAMAM) dendrimers have been widely explored as carriers of therapeutics and imaging agents. However, amine-terminated PAMAM dendrimers is rarely utilized in systemic applications due to its cytotoxicity and risk of opsonization, caused by its cationic charges. Such undesirable effects may be mitigated by shielding the PAMAM dendrimer surface with polymers that reduce the charges. However, this shielding may also interfere with PAMAM dendrimers’ ability to interact with target cells, thus reducing cellular uptake and overall efficacy of the delivery system. Therefore, we propose to use zwitterionic chitosan (ZWC), a new chitosan derivative, which has a unique pH-sensitive charge profile, as an alternative biomaterial to modify the cationic surface of PAMAM dendrimers. Stable electrostatic complex of ZWC and PAMAM dendrimers was formed at pH 7.4, where the PAMAM dendrimer surface was covered with ZWC, as demonstrated by fluorescence spectroscopy and transmission electron microscopy. The presence of ZWC coating protected red blood cells and fibroblast cells from hemolytic and cytotoxic activities of PAMAM dendrimers, respectively. Confocal microscopy showed that the protective effect of ZWC disappeared at low pH as the complex dissociated due to the charge conversion of ZWC, allowing PAMAM dendrimers to enter cells. These results demonstrate that ZWC is able to provide a surface coverage of PAMAM dendrimers in a pH-dependent manner and, thus, enhance the utility of PAMAM dendrimers as a drug carrier to solid tumors with acidifying microenvironment.
Keywords: Polyamidoamine dendrimer, nanoparticulate drug carrier, pH-sensitive, surface protection, zwitterionic chitosan
INTRODUCTION
Polyamidoamine (PAMAM) dendrimers have been widely explored as a carrier of therapeutics or imaging agents,1 where the payload can be non-covalently encapsulated in the void space of the interior2–6 or covalently conjugated to the termini.7–9 PAMAM dendrimers may have various functional groups on the surface, such as amines, carboxylates, and amidoethylethanolamines. In particular, amine-terminated PAMAM dendrimers are useful for gene delivery due to its cationic charge, which allows for complexation of nucleic acids and for their cellular uptake.10, 11 Moreover, protonation of tertiary amines in the interior of PAMAM dendrimers facilitates their endosomal escape via the proton sponge effect.12 Amine-termini of PAMAM dendrimers are also useful for covalent conjugation of drugs or imaging agents, via linkers cleaved by a condition unique to target tissues.1, 13
Despite the ability to carry various agents, amine-terminated PAMAM dendrimers are hardly used in systemic applications due to their non-specific toxicity and high risk of reticuloendothelial system (RES) uptake.14 To reduce the charge-related toxicity and prevent opsonization of cationic PAMAM dendrimers, part of the amine termini is often modified with polyethylene glycol (i.e., PEGylated), a non-ionic hydrophilic polymer that masks the cationic charge.15, 16 However, a potential disadvantage of PEGylation is that PEG can interfere with interactions between the carriers and target cells and reduce their cellular uptake.17–19
To address this problem, PEGylated PAMAM dendrimers can be additionally decorated with various ligands such as folate,20, 21 transferrin,22 or arginine-glycine-aspartic acid (RGD) peptide,23 of which receptors are known to be overexpressed in many solid tumors. While these ligands help cells take up dendrimer drug carriers greatly, the fraction of target cells that express corresponding cellular receptors is not always predictable, and the expression levels can change during progression of the diseases.24 In this regard, it is conceivable to utilize a relatively common feature of diseased tissues or organs for target-specific delivery of therapeutic agents. In the case of tumors, pH of the microenvironment can be used. Cancer cells distant from blood vessels are deprived of oxygen25, 26 and undergo anaerobic glycolysis to generate excess lactic acid.27, 28 As a result, hypoxic tumors tend to develop a weakly acidic microenvironment (pH 6.5 to 7.229) compared to normal tissues.30, 31
In this study, we propose a new surface modification strategy for an amine-terminated PAMAM dendrimer, which can shield its cationic surface and prevent cellular interaction or expose the surface to cells in a pH-responsive manner. This strategy utilizes a new chitosan derivative that exhibits a unique charge profile according to environment pH.32 The chitosan derivative, called zwitterionic chitosan (ZWC), is created by the conjugation of succinic anhydride to primary amines of chitosan and shows negative charges at relatively high pH and positive charges at low pH. We envision that ZWC, negatively charged at pH 7.4, will complex with cationic PAMAM dendrimers and mask the surface charge. Once in acidic environment, ZWC is expected to undergo charge reversal and lose the protective function so that the PAMAM dendrimers can freely interact with tumor cells.
To obtain a proof of concept of this strategy, we produced PAMAM dendrimers complexed with ZWC (ZWC(PAMAM)) and examined pH-dependent association and dissociation of the complex. The structure of ZWC(PAMAM) complex was elucidated with fluorescence spectroscopy and transmission electron microscopy. The effect of ZWC coating on the toxicity and cellular interaction of PAMAM dendrimers was studied using the hemolysis assay and the cell proliferation assay. Finally, the effect of pH-dependent removal of ZWC coating was studied by microscopic observation of cancer cells incubated with ZWC(PAMAM) at different pHs.
EXPERIMENTAL SECTION
Materials
Chitosan (15 kDa) was purchased from Polysciences, Inc. (Warrington, PA). Polyamidoamine (PAMAM) dendrimer generation 5 (G5) was purchased from Sigma-Aldrich (St. Louis, MO). Fluorescence dyes Flamma FPR-552, FPR-581, and FNG-456 were a gift from BioActs (DKC Corp., Incheon, Korea). MTT (3-(4,5-Dimethylthiazol-2-yl)-2,5-diphenyltetrazolium bromide) and all other cell culture supplies were purchased from Invitrogen (Eugene, OR) unless specified otherwise.
Synthesis of Zwitterionic Chitosan (ZWC)
Zwitterionic chitosan (ZWC) was synthesized by following previously established methods.32 In short, chitosan acetate was resuspended in deionized (DI) water, and succinic anhydride was added to the chitosan mixture while stirring. After overnight reaction, the solution was dialyzed (molecular-weight cut off: 3500 Da) against water maintaining pH 10–11, and the purified ZWC was lyophilized. ZWC was re-suspended in deionized water (DI water) and reacted with 30% H2O2 under vigorous stirring for 1h at room temperature to produce a lower molecular-weight ZWC. The reaction was quenched by the addition of methanol, and the resulting solution was purified by dialysis. The purified product was lyophilized and stored in −20°C. The low molecular-weight ZWC was used throughout this study.
Preparation and Characterization of ZWC(PAMAM) NPs
ZWC solutions were prepared in phosphate buffers (pH 7.4) with ionic strengths, varying the concentration from 0.5 mg/mL to 2 mg/mL. ZWC(PAMAM) NPs were created by mixing a small volume of PAMAM-methanol solution (40 mg/mL) in the ZWC solution achieving various ZWC to PAMAM ratios (1:1 to 4:1). The formation of ZWC(PAMAM) complex was indicated by the development of turbidity, monitored at 660 nm using a Beckman DU 650 UV-VIS Spectrophotometer (Brea, CA). Particle sizes of ZWC(PAMAM) and the components, prepared in phosphate-buffered saline (PBS, 10 mM phosphate, pH 7.4), were measured by dynamic light scattering using a Malvern Zetasizer Nano ZS90 (Worchestershire, UK). Count rate (kilo counts per second), proportional to the number of particles in solution, and polydispersity index, an indicator of the extent of particle aggregation, were also noted. Surface charges of ZWC(PAMAM) and the components were measured using a Malvern Zetasizer Nano ZS90 at pH ranging from 3 to 9 in ~0.3 increment. For this measurement, all components and complexes were prepared in 10 mM NaCl, and the pH was adjusted using 0.1 N HCl or NaOH.
Critical Association Concentration (CAC) of ZWC(PAMAM) NPs
ZWC(PAMAM) NPs were prepared by mixing 2 mg/mL ZWC solution in PBS and 1 mg/mL PAMAM dendrimer suspension in PBS, in equal volumes. The suspension was serially diluted by factors of 2 and 4 using PBS. Count rate of each suspension was obtained using dynamic light scattering (Malvern Zetasizer) with a 5 mW He-Ne laser operated at 633 nm. Count rates of ZWC and PAMAM dendrimer solutions were also measured at corresponding concentrations.
Fluorescence Spectroscopy for Investigation of ZWC-PAMAM Complex Structure
ZWC was labeled with a fluorescent dye FPR-552 (λabs: 551 nm; λex: 570 nm) per the manufacturer’s protocol. Briefly, 1 mg of FPR-552 was dissolved in a mixture of 50 μL dimethyl sulfoxide (DMSO) and 50 μL DI water, and 1 mg of ZWC was dissolved in 100 μL of phosphate buffer (10 mM, pH 9). One microliter of the FPR-552 solution was incubated with 19 μL of the ZWC solution overnight at room temperature in a dark environment, and excessive dye was removed by dialysis. The PAMAM dendrimer was similarly labeled with an FPR-581 dye (λabs: 578 nm; λex: 595 nm). The labeled ZWC and PAMAM dendrimer were referred to as ZWC-552 and PAMAM-581, respectively.
Fluorescence spectra of ZWC-552, PAMAM-581, ZWC-552 combined with unlabeled PAMAM, and PAMAM-581 combined with unlabeled ZWC solutions were obtained using a Molecular Devices SpectraMax M5 (Sunnyvale, CA). Samples containing ZWC-552 were excited at 544 nm with a cutoff of 550 nm, and their emission spectra were read from 550 to 650 nm. Samples containing PAMAM-581 were excited at 578 nm with a 590 nm cutoff, and the emission spectra were read from 590 to 650 nm.
Transmission Electron Microscopy (TEM)
ZWC (0.5, 1 and 2 mg/mL), PAMAM dendrimer (0.5 mg/mL), and ZWC(PAMAM) (specified concentrations) were prepared in DI water at pH 7.4. Samples were mounted on a 400-mesh Cu grid with formvar and carbon supporting film (not glow-discharged) and stained with 2% uranyl acetate (UA) solution. Excess stain was removed with filter paper, and the grid was dried prior to imaging. Samples were imaged using a Philips CM-100 TEM (FEI Company, Hillsboro, OR) operated at 100 kV, spot size 3, 200 μm condenser aperture, and 70 μm objective aperture. Images were captured using a SIA L3-C 2 megapixel CCD camera (Scientific Instruments and Application, Duluth, GA) at original microscope magnifications ranging from 25,000× to 180,000×.
Hemolytic Activity Assay
Hemolysis assay was conducted as described in the literature.33 Blood was collected from Spague-Dawley rats via the dorsal aorta according to a protocol approved by the Purdue Animal Care and Usage Committee. Red blood cells (RBC) were isolated from blood and washed using 210 mM NaCl solution until the supernatant became free of red color. Purified RBC pellets were incubated with 900 μL of ZWC, PAMAM dendrimer, or ZWC(PAMAM) in PBS at various concentrations for 1 h at 37°C. DI water (positive control) caused complete lysis in this condition. PBS was used as a negative control. Samples were centrifuged at 2000 rpm for 5 min following incubation. 980 μL of supernatant was removed, and the remaining RBC pellet was dissolved in 980 μL of DI water. Absorbance of the RBC solution was measured at 541 nm. Data were expressed as normalized to the PBS-treated RBC.
Cell Viability Assay
Cytotoxicity of ZWC, PAMAM dendrimer, and ZWC(PAMAM) was evaluated using NIH 3T3 mouse fibroblast cells (ATCC, Rockville, MD) via MTT (3-(4,5-Dimethylthiazol-2-yl)-2,5-diphenyltetrazolium bromide) assay. Fibroblasts were cultured in DMEM high glucose medium supplemented with 10% bovine calf serum (ATCC, Rockville, MD), 100 U/mL penicillin and 100 μg/mL streptomycin. For MTT assay, cells were seeded in 96-well plates at a density of 10,000 cells per well. After overnight incubation, culture medium was replaced with various concentrations of ZWC (0.5, 1, 1.5, 2 mg/mL), PAMAM dendrimer (0.05, 0.1, 0.5 mg/mL), or ZWC(PAMAM) (formed with combinations of different ZWC and PAMAM concentrations) complexes suspended in PBS containing 10% calf serum. After 4h incubation with the samples, the media was replaced with 100 μL of fresh medium and 15 μL of 5 mg/mL MTT, and the incubation was continued for 3.5h. The stop/solubilization solution was then added to dissolve the formed formazan. To avoid the interference due to the turbidity of ZWC(PAMAM) complexes, plates were centrifuged for 30 min at 4000 rpm, and clear supernatant was collected prior to reading. Cell viability was estimated by reading the absorbance of the solubilized formazan in the supernatant at 562 nm. The obtained absorbance was normalized to the absorbance of cells grown in complete medium without any treatment.
Confocal Microscopy
SKOV-3 ovarian carcinoma cells (ATCC, Rockville, MD) were cultured in RPMI-1640 medium supplemented with 10% fetal bovine serum (FBS), 100 U/mL penicillin, and 100 μg/mL streptomycin. The cells were plated in 35 mm diameter glass bottom dishes at a density of 800,000 per dish. After overnight incubation, the medium was replaced with a suspension of fluorescent PAMAM dendrimer (PAMAM-456), labeled with an amine-reactive dye FNG-456 λabs: 495 nm; λex: 529 nm), or a complex prepared with ZWC and PAMAM-456, ZWC(PAMAM-456). Here, the PAMAM-456 sample was prepared in PBS, and ZWC(PAMAM-456) complex was prepared in PBS by mixing ZWC with PAMAM-456 at a 2:1 ratio. The suspensions were then supplemented with 10% FBS, and their pH was adjusted to 7.4 or 6.4 before adding to the cells. The final concentration of each component in the suspensions was 1 mg/mL ZWC and/or 0.5 mg/mL PAMAM-456 dendrimer. After incubation with the treatments for 1h at 37°C, cells were washed twice in PBS (pH 7.4) or pH-adjusted PBS (pH 6.4) and imaged in each buffer containing 1 μL of DRAQ5 nuclear stain (Axxora, San Diego, CA). PAMAM-456 and DRAQ5 were excited with 488 nm and 633 nm lasers, respectively, and images of cell nuclei were obtained using an Olympus FV1000 confocal microscope (Olympus, Japan) using 60× objective.
Statistical Analysis
All data were expressed as averages with standard deviations. ANOVA was used to determine statistical difference among the groups, and multiple contrasts were performed with the Tukey test. A p-value of <0.05 was considered statistically significant.
RESULTS
pH-Dependent Charge Profiles of PAMAM Dendrimer and ZWCs
Zeta potentials of ZWC and PAMAM dendrimer were measured at pH values ranging from 3 to 9. PAMAM dendrimer (0.5 mg/mL) showed positive charges at all pH values (Fig. 1). ZWC showed a negative charge at relatively basic pH and a positive charge at acidic pH. The pH at which the charge changed (transition pH) depended on the ratio of succinic anhydride to chitosan. The transition pHs of ZWC prepared with an An/Am ratio of 0.3 (ZWC0.3) and 0.7 (ZWC0.7) were 6.6 and 4.3, respectively, consistent with our previous report.32 Since ZWC0.7 was most likely to form an electrostatic complex with PAMAM dendrimer among the synthesized ZWCs due to the relatively strong negative charge, ZWC0.7 was used in subsequent experiments and was referred to as ZWC.
Fig. 1.

pH dependent zeta-potential profiles of ZWC, PAMAM, and ZWC(PAMAM). ZWC0.3 and ZWC0.7 indicate ZWCs prepared with anhydride to amine ratio of 0.3 and 0.7, respectively. Each curve is a representative of at least 3 runs.
Formation of ZWC(PAMAM) Complexes
Upon introduction of ZWC to PAMAM dendrimer, the mixture became turbid immediately, indicating the formation of complexes. The suspension containing 1 mg/mL ZWC and 0.5 mg/mL PAMAM dendrimer showed an average particle size of 351.8 nm with a relatively narrow size distribution (PDI: 0.16) (Table 1) at a count rate of 1777.3 kilo counts per second (kcps). PAMAM dendrimer as a 0.5 mg/mL colloidal solution in PBS showed a particle size of 184.4 nm, but the count rate and PDI were 42.1 kcps and 0.60, respectively. The low count rate and high PDI indicated that the observed particle size was due to random aggregates of PAMAM dendrimer in water, which has been reported in the literature.34 ZWC (1 mg/mL) showed a particle size of 535.2 nm with a similarly low count rate (62.5 kcps) and high PDI (0.76), suggesting that ZWC also aggregated when present alone in this concentration. The high particle count rate of the PAMAM-ZWC mixture indicates that the two components formed complexes, which were distinguished from each component, and the measured particle size reflected that of the complexes rather than a simple average of the two components.
Table 1.
Particle size, polydispersity index, and derived count rate of ZWC(PAMAM) NPs and the components.
| Samples | n | Particle size (diameter, nm) | Polydispersity index (PDI) | Derived count rate (kcps) |
|---|---|---|---|---|
| ZWC(PAMAM) | 9 | 351.8 ± 21.1 | 0.16 ± 0.05 | 1777.3 ± 92.0 |
| PAMAM | 3 | 184.4 ± 25.0 | 0.60 ± 0.01 | 42.1 ± 46.3 |
| ZWC | 3 | 535.2 ± 41.9 | 0.76 ± 0.05 | 62.5 ± 3.8 |
Samples prepared in phosphate-buffered saline (10 mM phosphate, pH 7.4).
Each sample contained PAMAM 0.5 mg/mL and/or ZWC 1 mg/mL.
pH-Dependent Formation and Dissociation of ZWC(PAMAM) Complexes
The complex based on PAMAM dendrimer and ZWC showed a pH-dependent charge profile, similar to that of ZWC, but with a transition pH shifted to right from 4.3 to pH 6.8 (Fig. 1). The increase in transition pH indicates partial neutralization of anionic charge of ZWC by PAMAM dendrimer. The net charge of ZWC(PAMAM) at pH 7.4 was approximately −8 mV.
Turbidity of the complex suspension decreased with the decrease of pH (Fig. 2). When pH was lowered to 3 by the addition of HCl solution, the ZWC(PAMAM) suspension became completely clear, similar to individual ZWC and PAMAM components, indicating dissociation of the complexes (Supporting Fig. 1). On the other hand, the addition of NaCl solution, which provided the same degree of ion increase and dilution effect without changing the pH, did not induce significant decrease in turbidity. This indicates that the complex dissociation observed at pH 3 was not due to dilution of the complex or increase of ionic strength in the suspension. Given that ZWC assumes an increasingly positive charge as pH decreases, the complex dissociation is most likely due to electrostatic repulsion of protonated ZWC and PAMAM dendrimer.
Fig. 2.

Absorbance (@ 660 nm) of ZWC(PAMAM) at different pHs. ZWC(PAMAM) was prepared with ZWC (1 mg/mL) and PAMAM (0.5 mg/mL). Data are expressed as averages with standard deviations of 3 identically and independently prepared samples.
Stability of ZWC(PAMAM) Complex
To study the effect of ionic strength on the formation and stability of ZWC(PAMAM), the complexes were suspended in pH 7.4 phosphate buffers containing different concentrations of NaCl (10–300 mM) and incubated for 48h. Turbidity of complex suspension decreased as the NaCl concentration increased (Fig. 3). This indicates that a large number of ions have interfered with the formation of complexes and, thus, confirms the electrostatic nature of ZWC(PAMAM) complex. The complexes formed and incubated in 150 mM NaCl solution maintained a constant turbidity (Fig. 3), particle size, and count rate over 48 h (data not shown).
Fig. 3.

Stability of ZWC(PAMAM) incubated in different ionic strengths for 48 h, as measured with turbidity change. ZWC(PAMAM) prepared with (A) 1 mg/mL ZWC and 0.5 mg/mL PAMAM, and (B) 0.75 mg/mL ZWC and 0.5 mg/mL PAMAM. Data are expressed as averages with standard deviations of 3 identically and independently prepared samples. There was no difference between 0 and 48 h in all samples (Tukey post hoc test; p>0.05).
To examine the effect of dilution on stability of ZWC(PAMAM), we determined its critical association concentration (CAC), the lowest concentration at which ZWC and PAMAM formed electrostatic complexes. The CAC was determined using dynamic light scattering as the concentration above which the intensity of scattered light (or particle count rate) showed a linear increase with concentration of the components.35 ZWC or PAMAM alone showed a minimal count rate, which did not change with the concentration (Fig. 4). In contrast, ZWC(PAMAM) NPs showed a linear increase in count rate with a CAC corresponding to ZWC 1.8 ± 0.3 μg/mL and PAMAM 0.9 ± 0.2 μg/mL. Below the CAC, the count rate overlapped with those of PAMAM alone, indicating dissociation of ZWC(PAMAM) complex.
Fig. 4.

Determination of critical association concentration of ZWC(PAMAM). The result is representative of 3 independently and identically prepared samples. The bottom plot shows a magnified view of the range indicated in the top plot.
Elucidation of ZWC(PAMAM) Complex Structure with Fluorescence Spectroscopy
The structure of ZWC(PAMAM) complex was elucidated by observing changes in the fluorescence emission profiles of (i) fluorescently labeled ZWC (ZWC-552) in the presence of unlabeled PAMAM and (ii) fluorescently labeled PAMAM (PAMAM-581) in the presence of unlabeled ZWC. At pH 7.4, a condition that allowed for attractive interaction between ZWC and PAMAM, ZWC-552 showed increasing fluorescence intensity with increasing concentration of unlabeled PAMAM (Fig. 5A). This suggests that the complexation of the two components resulted in dissociation of ZWC aggregates and, thus, de-quenching of ZWC-552 fluorescence. In contrast, PAMAM-581 incubated with unlabeled ZWC showed decreasing fluorescence intensity with increasing concentration of unlabeled ZWC (Fig. 5B). One explanation for this result is blockade of fluorescence emission due to the increasing ZWC coverage of PAMAM-581.
Fig. 5.

Fluorescence profiles of (A) ZWC-552 (0.2 mg/mL) in the presence of unlabeled PAMAM (0.05–0.2 mg/mL) at pH 7.4 (excited at 544 nm; emission scanned from 550 to 650 nm) and (B) PAMAM-581 (0.2 mg/mL) in the presence of unlabeled ZWC (0.05–0.2 mg/mL) at pH 7.4 (excited at 578 nm; emission scanned from 590 to 650 nm). Each plot is representative of three replicates.
Morphology of ZWC(PAMAM) Complexes
ZWC(PAMAM) and each component were visualized with TEM after UA staining (Fig. 6). PAMAM and ZWC were oppositely stained by UA, which is likely due to the differential affinity of UA for each component. UA breaks down into different acetate ion species, which have a much greater affinity for phosphoryl and carboxyl groups.36 Therefore, ZWC was positively stained, whereas PAMAM (lacking phosphoryl and carboxyl groups) appeared lighter (negatively stained).
Fig. 6.
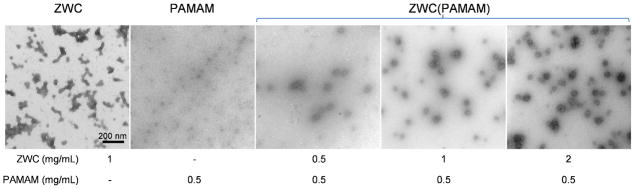
Transmission electron micrographs of PAMAM, ZWC, and ZWC(PAMAM).
In the absence of ZWC, PAMAM was observed as round white particles with a size <10 nm in diameter, approaching theoretical size.37 In the samples prepared with ZWC and PAMAM in 2:1 or 4:1 ratio, dark ZWC showed up around light PAMAM. On the other hand, at 1:1 ratio, a number of PAMAM appeared separate from ZWC, indicating incomplete ZWC coverage of PAMAM.
Protective Effects of ZWC Coating
To investigate the effect of ZWC coating, hemolytic activity of ZWC(PAMAM) was compared with that of PAMAM. Typically, the red color of hemoglobin released from the lysed RBC is used to quantify the extent of lysis by a material of interest. However, this method could not be used in the present study because the turbidity of the complexes interfered with the absorbance reading. Alternatively, the remaining RBC pellet was quantified by re-suspending it in DI water and measuring its absorbance at 541 nm.
As shown in Fig. 7, ZWC alone, at concentrations of 0.5–2 mg/mL, had no hemolytic effect on RBC, consistent with our previous report.32 PAMAM at 0.5 mg/mL showed significant hemolysis, and the addition of 0.5 mg/mL ZWC (ZWC:PAMAM = 1:1) did not prevent it. On the other hand, ZWC(PAMAM) formed with higher ZWC:PAMAM ratios (2:1 – 4:1) exhibited no hemolysis. This result indicates that ZWC coating prevented direct interaction between PAMAM and RBC.
Fig. 7.

Hemolytic activity of ZWC, PAMAM, and ZWC(PAMAM). RBCs were incubated with the samples at concentrations shown in the table at 37°C and pH 7.4 for 1 h. Pictures were taken after centrifugation of the tubes at 2000 rpm for 5 min. The pellets are intact RBC, and the red supernatant or precipitate on the tube wall show hemoglobin released from the lysed RBC. Data are expressed as averages with standard deviations of 3 identically and independently prepared samples. *: p<0.05 vs. PBS by Tukey test.
The protective effect of ZWC was additionally confirmed by the MTT cell proliferation assay (Fig. 8). ZWC had minimal cytotoxic effects on fibroblasts at all concentrations. The slight decrease in viability was due to the fact that cells were incubated in PBS with 10% FBS rather than complete medium. On the other hand, cell viabilities decreased to 36%, 18%, and 4% of non-treated control cells at 0.05, 0.1, and 0.5 mg/mL PAMAM, respectively, similar to previous studies.38–40 Cytotoxicity of PAMAM decreased with the addition of ZWC at the concentrations of 0.5–2 mg/mL for each level of PAMAM. At relatively lower PAMAM concentrations (0.05 and 0.1 mg/mL), cell viability was improved upon addition of ZWC 0.5 mg/mL, from 36% (0.05 mg/mL PAMAM) and 18% (0.1 mg/mL PAMAM) to 80% and 76%, respectively, which were comparable to the viability at ZWC 0.5 mg/mL alone. Cell viability did not increase beyond this level at higher concentrations of ZWC, indicating that 0.5 mg/mL ZWC was sufficient for shielding the effect of 0.05–0.1 mg/mL PAMAM. For 0.5 mg/mL PAMAM, cell viability gradually increased with the increase of ZWC concentration, reaching 60% with 2 mg/mL ZWC. This result indicates that ZWC coating can protect fibroblast cells from the toxic effect of PAMAM.
Fig. 8.

Cell viability of ZWC, PAMAM, and ZWC(PAMAM) at various concentrations using MTT assay. Data are expressed as averages with standard deviations of 3 repeated tests. #: p<0.005 vs. PAMAM (No ZWC) at each concentration. Numbers indicate the final concentrations of ZWC and/or PAMAM in culture medium.
Cellular Uptake of ZWC(PAMAM) Complexes at Different pHs
To test the pH-dependent removal of ZWC coating from a ZWC(PAMAM) complex, cellular uptake of a complex formed with ZWC and fluorescently labeled PAMAM (PAMAM-456) was observed at different pHs (7.4 and 6.4) using confocal microscopy. At both pHs, SKOV-3 cells treated with 0.5 mg/mL PAMAM-456 showed peri- and intracellular PAMAM-456 fluorescence, indicating cellular uptake of bare dendrimers (Fig. 9B and 9E). Cells treated with ZWC(PAMAM-456) at pH 7.4 (Fig. 9C) did not show significant cellular uptake of PAMAM-456, attributable to interference of the associated ZWC. In contrast, those at pH 6.4 showed cellular uptake of PAMAM-456, comparable to the cells treated with PAMAM-456 alone, indicating pH-responsive removal of ZWC from the complex.
Fig. 9.

Cellular uptake of PAMAM-456 or ZWC(PAMAM-456) at pH 7.4 (top) and pH 6.4 (bottom): (A, D) cells only, (B, E) PAMAM-456 (0.5 mg/mL), and (C, F) ZWC(PAMAM-456) equivalent to PAMAM-456 (0.5 mg/mL) and ZWC (1 mg/mL). Green: PAMAM-456; blue: nuclei. Overlays of fluorescent and transmission images are provided in Supporting Fig. 3.
DISCUSSION
ZWC has several features ideal for surface modification of cationic nanocarriers. First, as an anionic polymer at pH 7.4, ZWC can form an electrostatic complex on a cationic polymer surface and reduce protein adsorption to the surface.32 Moreover, the pH at which ZWC undergoes charge reversal is easily controlled according to the ratio of anhydride added to amine. Such flexibility allows for customized surface modification, according to tumor extracellular pH that varies with the type and stage of tumors.41 Finally, ZWC is compatible with blood as demonstrated by the lack of hemolytic activity or activation of the C3 complement cascade.32
We used ZWC as a surface modifier of amine-terminated G5 PAMAM dendrimer, which forms a complex with PAMAM at neutral pH and can be removed in acidifying environment. As indicated by the increase of turbidity and particle count rate, a mixture of PAMAM and ZWC formed an electrostatic complex with a diameter of ~350 nm and zeta potential of −8 mV at pH 7.4. The ZWC(PAMAM) complex remained stable in physiological ionic strength at least for 48h. The CAC of ZWC(PAMAM) complex was 2.7 μg/mL (ZWC 1.8 μg/mL + PAMAM 0.9 μg/mL), comparable to the critical micelle concentration values of relatively stable polymeric micelle systems.42–47 These results suggest that ZWC(PAMAM) complex has the potential to remain stable during circulation, where they undergo dilution and encounter ions. Upon exposure to acidic pH, the complex gradually dissociated, as indicated by turbidity decrease. As pH dropped below 6.8, the net surface charge became positive, favorable for interaction with cells in acidic tumors.
Fluorescence spectroscopy was used to elucidate the ZWC(PAMAM) complex structure. Fluorescence intensity of the labeled ZWC and PAMAM (ZWC-552 and PAMAM-581) changed as the amount of unlabeled counterparts increased. The increasing fluorescence intensity of ZWC-552 with increasing PAMAM may be explained by de-quenching of ZWC-552, which was present as aggregates by themselves but dissociated upon complexation with PAMAM-552. This explanation is supported by the lack of such fluorescence change at pH 9 (Supporting Fig. 2A), where ZWC had a stronger anionic charge and was less likely to self-associate than ZWC at pH 7.4. To the contrary, fluorescence intensity of PAMAM-581 decreased as the amount of ZWC increased. This result suggests that emission of PAMAM-581 fluorescence might have been blocked due to ZWC coverage. A similar trend was seen at pH 9 (Supporting Fig. 2C), where anionic ZWC and cationic PAMAM-581 were supposed to form an electrostatic complex. These distinct changes in fluorescence intensity of ZWC-552 and PAMAM-581 in the presence of unlabeled counterparts were not seen at pH 3 (Supporting Figs. 2B and 2D), where both ZWC and PAMAM were charged positively and thus did not form ionic complexes. These results confirm that ZWC(PAMAM) complexes are formed by electrostatic interactions between the two components, in which PAMAM is covered by ZWC. TEM provides additional evidence of this structure.
According to the comparison of DLS, it is likely that multiple component molecules participated in the formation of complexes. Each ZWC(PAMAM) was measured to be ~20 nm under TEM, greater than a single PAMAM G5 (5.7 nm37), where the difference may be attributable to ZWC coating. On the other hand, particle size measured by DLS (~350 nm) was much larger than that measured by TEM. Discrepancy between sizes measured with TEM and DLS is not unusual,48, 49 with some studies finding a 50% larger size using DLS.48 Such variation is typically explained by the differences in the way each obtains particle size: TEM requires particles to be dehydrated and subjects them to high vacuum, while DLS determines an average hydrodynamic particle diameter of fully hydrated particles. However, the large difference in TEM and DLS measurements seen in the present study may not be explained by this reason alone. It is more likely that particles are present as aggregates in solution, which are separated upon dehydration. Interestingly, the particle size of ZWC(PAMAM) complex did not significantly change after filtration through a membrane filter with a pore size of 200 nm, although turbidity seen in the sample prior to filtration reduced after the filtration. This observation suggests that the aggregation may be an equilibrium state, which is restored by individual components or smaller complexes passing the filter. Fig. 10 shows a schematic model of ZWC(PAMAM) complex, based on the observations of fluorescence spectroscopy, TEM, and DLS.
Fig. 10.
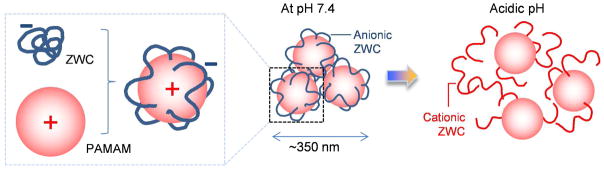
Schematic description of ZWC(PAMAM) formation and dissociation at different pHs.
At pH 7.4, ZWC coating prevented PAMAM from damaging RBC. Without the coating, PAMAM G5 (0.1 mg/mL or greater) is hemolytic,50 due to interactions between cationic PAMAM and RBC membrane.51 Similarly, ZWC coating protected NIH3T3 fibroblasts from toxic effects of PAMAM, which is known to cause apoptosis in mammalian cells52, 53 in a generation-54, 55 and concentration-dependent manner (Fig. 8). In both cases, the protective effect of ZWC was more evident when the ratio of ZWC to PAMAM was 2:1 or higher. This trend was consistent with TEM, where the ZWC(PAMAM) complex prepared in 1:1 ratio showed incomplete ZWC coverage of PAMAM but those in 2:1 or 4:1 showed complete coverage.
Confocal microscopy demonstrated that the protective effect of ZWC disappeared as it was removed from PAMAM at pH 6.4. At pH 7.4, ZWC(PAMAM-456) complex was barely taken up by SKOV-3 cells due to the interference of ZWC with cell-complex interactions. On the other hand, the fluorescence of PAMAM-456 was readily seen in the cells at pH 6.4, indicating partial removal of ZWC from the complex. In contrast, PAMAM-456 alone entered cells irrespective of medium pH, reflecting persistent cationic charge of the surface. Of note, at the concentration used in this study (0.5 mg/mL), PAMAM caused the appearance of punctate nuclear signals representing fragmentation of the nuclei of cells (Supporting Fig. 4B and 4E), a feature frequently observed in cells undergoing apoptosis.56 SKOV-3 cells treated with ZWC(PAMAM) showed no signs of abnormality at pH 7.4 (Supporting Fig. 4C), but the cells treated with ZWC(PAMAM) at pH 6.4 showed punctate nuclear signals (Supporting Fig. 4F), similar to those treated with PAMAM alone, corroborating the differential cellular uptake of PAMAM-456 complexed with ZWC.
In summary, the results of this study show the formation of ZWC coating around PAMAM particles, which provides a conditional shielding/deshielding effect. The ZWC coating protects non-target cells from damaging effects of PAMAM at neutral pH, but the protection is no longer effective when the particles are exposed to acidic environment. Therefore, ZWC(PAMAM) complex has the potential to serve as an effective drug carrier to solid tumors with acidifying microenvironment such as hypoxia. The ability to control the PAMAM toxicity in a pH-dependent manner with the use of ZWC also gives an opportunity to explore PAMAM as a polymeric cytotoxic agent. The conditional deshielding of PAMAM surface was observed at pH 6.4 in the present study, but the transition pH may be adjusted according to the acidity of tumors by controlling the anhydride to amine ratio during the production of ZWC. The proof of concept demonstrated in this study is thus applicable for a variety of tumors with different extents of acidification.
Supplementary Material
Acknowledgments
The authors thank Johann H Weidle III for technical assistance with ZWC synthesis and characterization and Ms. Debra Sherman for the help with TEM. The authors also thank BioActs (DKC Corporation, Korea) for the generous donation of Flamma FPR dyes. This work was supported by NSF DMR-1056997, NIH R21 CA135130, and a grant from the Lilly Endowment, Inc. to College of Pharmacy. This study was also partly supported by the NIH/NCRR-Indiana Clinical and Translational Sciences Institute Pre-doctoral Fellowship (TL1 RR025759, PI: A. Shekhar) to KL.
Footnotes
Supporting Information is available free of charge via the Internet at http://pubs.acs.org/.
References
- 1.Mintzer MA, Grinstaff MW. Biomedical applications of dendrimers: a tutorial. Chem Soc Rev. 2011;40:173–190. doi: 10.1039/b901839p. [DOI] [PubMed] [Google Scholar]
- 2.Beezer AE, King ASH, Martin IK, Mitchel JC, Twyman LJ, Wain CF. Dendrimers as potential drug carriers; encapsulation of acidic hydrophobes within water soluble PAMAM derivatives. Tetrahedron. 2003;59:3873–3880. [Google Scholar]
- 3.Chandrasekar D, Sistla R, Ahmad FJ, Khar RK, Diwan PV. The development of folate-PAMAM dendrimer conjugates for targeted delivery of anti-arthritic drugs and their pharmacokinetics and biodistribution in arthritic rats. Biomaterials. 2007;28:504–512. doi: 10.1016/j.biomaterials.2006.07.046. [DOI] [PubMed] [Google Scholar]
- 4.Crampton HL, Simanek EE. Dendrimers as drug delivery vehicles: non-covalent interactions of bioactive compounds with dendrimers. Polym Int. 2007;56:489–496. doi: 10.1002/pi.2230. [DOI] [PMC free article] [PubMed] [Google Scholar]
- 5.Kolhe P, Misra E, Kannan RM, Kannan S, Lieh-Lai M. Drug complexation, in vitro release and cellular entry of dendrimers and hyperbranched polymers. Int J Pharm. 2003;259:143–160. doi: 10.1016/s0378-5173(03)00225-4. [DOI] [PubMed] [Google Scholar]
- 6.Patri AK, Kukowska-Latallo JF, Baker JR., Jr Targeted drug delivery with dendrimers: Comparison of the release kinetics of covalently conjugated drug and non-covalent drug inclusion complex. Adv Drug Deliver Rev. 2005;57:2203–2214. doi: 10.1016/j.addr.2005.09.014. [DOI] [PubMed] [Google Scholar]
- 7.Lai PS, Lou PJ, Peng CL, Pai CL, Yen WN, Huang MY, Young TH, Shieh MJ. Doxorubicin delivery by polyamidoamine dendrimer conjugation and photochemical internalization for cancer therapy. J Control Release. 2007;122:39–46. doi: 10.1016/j.jconrel.2007.06.012. [DOI] [PubMed] [Google Scholar]
- 8.Khandare J, Kolhe P, Pillai O, Kannan S, Lieh-Lai M, Kannan RM. Synthesis, Cellular Transport, and Activity of Polyamidoamine Dendrimer-Methylprednisolone Conjugates. Bioconjugate Chem. 2005;16:330–337. doi: 10.1021/bc0498018. [DOI] [PubMed] [Google Scholar]
- 9.Majoros IJ, Myc A, Thomas T, Mehta CB, Baker JR. PAMAM Dendrimer-Based Multifunctional Conjugate for Cancer Therapy: Synthesis, Characterization, and Functionality. Biomacromolecules. 2006;7:572–579. doi: 10.1021/bm0506142. [DOI] [PubMed] [Google Scholar]
- 10.Liu X, Wu J, Yammine M, Zhou J, Posocco P, Viel S, Liu C, Ziarelli F, Fermeglia M, Pricl S, Victorero G, Nguyen C, Erbacher P, Behr JP, Peng L. Structurally Flexible Triethanolamine Core PAMAM Dendrimers Are Effective Nanovectors for DNA Transfection in Vitro and in Vivo to the Mouse Thymus. Bioconjugate Chem. 2011;22:2461–2473. doi: 10.1021/bc200275g. [DOI] [PubMed] [Google Scholar]
- 11.Kukowska-Latallo JF, Bielinska AU, Johnson J, Spindler R, Tomalia DA, Baker JR. Efficient transfer of genetic material into mammalian cells using Starburst polyamidoamine dendrimers. P Natl Acad Sci USA. 1996;93:4897–4902. doi: 10.1073/pnas.93.10.4897. [DOI] [PMC free article] [PubMed] [Google Scholar]
- 12.Ouyang D, Zhang H, Parekh HS, Smith SC. The effect of pH on PAMAM dendrimer–siRNA complexation — Endosomal considerations as determined by molecular dynamics simulation. Biophys Chem. 2011;158:126–133. doi: 10.1016/j.bpc.2011.06.003. [DOI] [PubMed] [Google Scholar]
- 13.Zhu S, Hong M, Tang G, Qian L, Lin J, Jiang Y, Pei Y. Partly PEGylated polyamidoamine dendrimer for tumor-selective targeting of doxorubicin: the effects of PEGylation degree and drug conjugation style. Biomaterials. 2010;31:1360–71. doi: 10.1016/j.biomaterials.2009.10.044. [DOI] [PubMed] [Google Scholar]
- 14.Jones CF, Campbell RA, Franks Z, Gibson CC, Thiagarajan G, Vieira-de-Abreu A, Sukavaneshvar S, Mohammad SF, Li DY, Ghandehari H, Weyrich AS, Brooks BD, Grainger DW. Cationic PAMAM Dendrimers Disrupt Key Platelet Functions. Mol Pharmaceutics. 2012;9:1599–1611. doi: 10.1021/mp2006054. [DOI] [PMC free article] [PubMed] [Google Scholar]
- 15.Luo D, Haverstick K, Belcheva N, Han E, Saltzman WM. Poly(ethylene glycol)-Conjugated PAMAM Dendrimer for Biocompatible, High-Efficiency DNA Delivery. Macromolecules. 2002;35:3456–3462. [Google Scholar]
- 16.Yang H, Lopina S, DiPersio L, Schmidt S. Stealth dendrimers for drug delivery: correlation between PEGylation, cytocompatibility, and drug payload. J Mater Sci-Mater M. 2008;19:1991–1997. doi: 10.1007/s10856-007-3278-0. [DOI] [PubMed] [Google Scholar]
- 17.Mishra S, Webster P, Davis ME. PEGylation significantly affects cellular uptake and intracellular trafficking of non-viral gene delivery particles. Eur J Cell Biol. 2004;83:97–111. doi: 10.1078/0171-9335-00363. [DOI] [PubMed] [Google Scholar]
- 18.Romberg B, Hennink W, Storm G. Sheddable Coatings for Long-Circulating Nanoparticles. Pharm Res. 2008;25:55–71. doi: 10.1007/s11095-007-9348-7. [DOI] [PMC free article] [PubMed] [Google Scholar]
- 19.Hong RL, Huang CJ, Tseng YL, Pang VF, Chen ST, Liu JJ, Chang FH. Direct comparison of liposomal doxorubicin with or without polyethylene glycol coating in C-26 tumor-bearing mice: Is surface coating with polyethylene glycol beneficial? Clin Cancer Res. 1999;5:3645–3652. [PubMed] [Google Scholar]
- 20.Singh P, Gupta U, Asthana A, Jain NK. Folate and folate-PEG-PAMAM dendrimers: synthesis, characterization, and targeted anticancer drug delivery potential in tumor bearing mice. Bioconjugate Chem. 2008;19:2239–52. doi: 10.1021/bc800125u. [DOI] [PubMed] [Google Scholar]
- 21.Zhang Y, Sun Y, Xu X, Zhang X, Zhu H, Huang L, Qi Y, Shen YM. Synthesis, biodistribution, and microsingle photon emission computed tomography (SPECT) imaging study of technetium-99m labeled PEGylated dendrimer poly(amidoamine) (PAMAM)-folic acid conjugates. J Med Chem. 2010;53:3262–72. doi: 10.1021/jm901910j. [DOI] [PubMed] [Google Scholar]
- 22.He H, Li Y, Jia XR, Du J, Ying X, Lu WL, Lou JN, Wei Y. PEGylated Poly(amidoamine) dendrimer-based dual-targeting carrier for treating brain tumors. Biomaterials. 2011;32:478–87. doi: 10.1016/j.biomaterials.2010.09.002. [DOI] [PubMed] [Google Scholar]
- 23.Zhang L, Zhu S, Qian L, Pei Y, Qiu Y, Jiang Y. RGD-modified PEG-PAMAM-DOX conjugates: in vitro and in vivo studies for glioma. Eur J Pharm Biopharm. 2011;79:232–40. doi: 10.1016/j.ejpb.2011.03.025. [DOI] [PubMed] [Google Scholar]
- 24.Bae YH, Park K. Targeted drug delivery to tumors: Myths, reality and possibility. J Control Release. 2011;153:198–205. doi: 10.1016/j.jconrel.2011.06.001. [DOI] [PMC free article] [PubMed] [Google Scholar]
- 25.Brown JM. Tumor hypoxia, drug resistance, and metastases. J Natl Cancer I. 1990;82:338–9. doi: 10.1093/jnci/82.5.338. [DOI] [PubMed] [Google Scholar]
- 26.Brown JM, Giaccia AJ. The Unique Physiology of Solid Tumors: Opportunities (and Problems) for Cancer Therapy. Cancer Res. 1998;58:1408–1416. [PubMed] [Google Scholar]
- 27.Harris AL. Hypoxia [mdash] a key regulatory factor in tumour growth. Nat Rev Cancer. 2002;2:38–47. doi: 10.1038/nrc704. [DOI] [PubMed] [Google Scholar]
- 28.Kim J-w, Dang CV. Cancer’s Molecular Sweet Tooth and the Warburg Effect. Cancer Res. 2006;66:8927–8930. doi: 10.1158/0008-5472.CAN-06-1501. [DOI] [PubMed] [Google Scholar]
- 29.Gerweck LE, Seetharaman K. Cellular pH Gradient in Tumor versus Normal Tissue: Potential Exploitation for the Treatment of Cancer. Cancer Res. 1996;56:1194–1198. [PubMed] [Google Scholar]
- 30.Engin K, Leeper DB, Cater JR, Thistlethwaite AJ, Tupchong L, McFarlane JD. Extracellular pH distribution in human tumours. Int J Hyperther. 1995;11:211–216. doi: 10.3109/02656739509022457. [DOI] [PubMed] [Google Scholar]
- 31.Jähde E, Rajewsky MF, Baumgärtl H. pH Distributions in Transplanted Neural Tumors and Normal Tissues of BDIX Rats as Measured with pH Microelectrodes. Cancer Res. 1982;42:1498–1504. [PubMed] [Google Scholar]
- 32.Xu PS, Bajaj G, Shugg T, Van Alstine WG, Yeo Y. Zwitterionic Chitosan Derivatives for pH-Sensitive Stealth Coating. Biomacromolecules. 2010;11:2352–2358. doi: 10.1021/bm100481r. [DOI] [PMC free article] [PubMed] [Google Scholar]
- 33.Henry SM, El-Sayed MEH, Pirie CM, Hoffman AS, Stayton PS. pH-Responsive Poly(styrene-alt-maleic anhydride) Alkylamide Copolymers for Intracellular Drug Delivery. Biomacromolecules. 2006;7:2407–2414. doi: 10.1021/bm060143z. [DOI] [PubMed] [Google Scholar]
- 34.Jasmine MJ, Kavitha M, Prasad E. Effect of solvent-controlled aggregation on the intrinsic emission properties of PAMAM dendrimers. J Lumin. 2009;129:506–513. [Google Scholar]
- 35.Surfactant micelle characterization using dynamic light scattering. 2006. pp. 1–5. [Google Scholar]
- 36.Hayat MA. “Uranyl Preparations” Principles and techniques of electron microscopy: biological applications. Cambridge University Press; 2000. [Google Scholar]
- 37.Tomalia DA, Reyna LA, Svenson S. Dendrimers as multi-purpose nanodevices for oncology drug delivery and diagnostic imaging. Biochem Soc Trans. 2007;35:61–67. doi: 10.1042/BST0350061. [DOI] [PubMed] [Google Scholar]
- 38.Li C, Liu H, Sun Y, Wang H, Guo F, Rao S, Deng J, Zhang Y, Miao Y, Guo C, Meng J, Chen X, Li L, Li D, Xu H, Wang H, Li B, Jiang C. PAMAM Nanoparticles Promote Acute Lung Injury by Inducing Autophagic Cell Death through the Akt-TSC2-mTOR Signaling Pathway. J Mol Cell Biol. 2009;1:37–45. doi: 10.1093/jmcb/mjp002. [DOI] [PubMed] [Google Scholar]
- 39.Naha PC, Davoren M, Lyng FM, Byrne HJ. Reactive oxygen species (ROS) induced cytokine production and cytotoxicity of PAMAM dendrimers in J774A.1 cells. Toxicol Appl Pharm. 246:91–99. doi: 10.1016/j.taap.2010.04.014. [DOI] [PubMed] [Google Scholar]
- 40.Lopez AI, Reins RY, McDermott AM, Trautner BW, Cai C. Antibacterial activity and cytotoxicity of PEGylated poly(amidoamine) dendrimers. Mol Biosyst. 2009;5:1148–1156. doi: 10.1039/b904746h. [DOI] [PMC free article] [PubMed] [Google Scholar]
- 41.Gerweck LE, Seetharaman K. Cellular pH Gradient in Tumor versus Normal Tissue: Potential Exploitation for the Treatment of Cancer. Cancer Res. 1996;56:1194–1198. [PubMed] [Google Scholar]
- 42.Yoo HS, Park TG. Biodegradable polymeric micelles composed of doxorubicin conjugated PLGA-PEG block copolymer. J Control Release. 2001;70:63–70. doi: 10.1016/s0168-3659(00)00340-0. [DOI] [PubMed] [Google Scholar]
- 43.Jeong JH, Park TG. Novel Polymer-DNA Hybrid Polymeric Micelles Composed of Hydrophobic Poly(d,l-lactic-co-glycolic Acid) and Hydrophilic Oligonucleotides. Bioconjugate Chem. 2001;12:917–923. doi: 10.1021/bc010052t. [DOI] [PubMed] [Google Scholar]
- 44.Xiangyang X, Ling L, Jianping Z, Shiyue L, Jie Y, Xiaojin Y, Jinsheng R. Preparation and characterization of N-succinyl-N-octyl chitosan micelles as doxorubicin carriers for effective anti-tumor activity. Colloid Surface B. 2007;55:222–228. doi: 10.1016/j.colsurfb.2006.12.006. [DOI] [PubMed] [Google Scholar]
- 45.Zhang J, Yan M, Li X, Qiu L, Jin Y, Zhu K. Local Delivery of Indomethacin to Arthritis-Bearing Rats through Polymeric Micelles Based on Amphiphilic Polyphosphazenes. Pharm Res. 2007;24:1944–1953. doi: 10.1007/s11095-007-9322-4. [DOI] [PubMed] [Google Scholar]
- 46.Pierri E, Avgoustakis K. Poly(lactide)-poly(ethylene glycol) micelles as a carrier for griseofulvin. J Biomed Mater Res A. 2005;75A:639–647. doi: 10.1002/jbm.a.30490. [DOI] [PubMed] [Google Scholar]
- 47.Klibanov AL, Maruyama K, Torchilin VP, Huang L. Amphipathic polyethyleneglycols effectively prolong the circulation time of liposomes. FEBS Lett. 1990;268:235–237. doi: 10.1016/0014-5793(90)81016-h. [DOI] [PubMed] [Google Scholar]
- 48.Co CC, Cotts P, Burauer S, de Vries R, Kaler EW. Microemulsion Polymerization. 3. Molecular Weight and Particle Size Distributions. Macromolecules. 2001;34:3245–3254. [Google Scholar]
- 49.Ito T, Sun L, Bevan MA, Crooks RM. Comparison of Nanoparticle Size and Electrophoretic Mobility Measurements Using a Carbon-Nanotube-Based Coulter Counter, Dynamic Light Scattering, Transmission Electron Microscopy, and Phase Analysis Light Scattering. Langmuir. 2004;20:6940–6945. doi: 10.1021/la049524t. [DOI] [PubMed] [Google Scholar]
- 50.Wang W, Xiong W, Zhu Y, Xu H, Yang X. Protective effect of PEGylation against poly(amidoamine) dendrimer-induced hemolysis of human red blood cells. J Biomed Mater Res B. 93B:59–64. doi: 10.1002/jbm.b.31558. [DOI] [PubMed] [Google Scholar]
- 51.Domański DM, Klajnert B, Bryszewska M. Influence of PAMAM dendrimers on human red blood cells. Bioelectrochemistry. 2004;63:189–191. doi: 10.1016/j.bioelechem.2003.09.023. [DOI] [PubMed] [Google Scholar]
- 52.Kuo JhS, Jan M-s, Chiu HW. Mechanism of cell death induced by cationic dendrimers in RAW 264.7 murine macrophage-like cells. J Pharm Pharmacol. 2005;57:489–495. doi: 10.1211/0022357055803. [DOI] [PubMed] [Google Scholar]
- 53.Zhang XQ, Intra J, Salem AK. Conjugation of Polyamidoamine Dendrimers on Biodegradable Microparticles for Nonviral Gene Delivery. Bioconjugate Chem. 2007;18:2068–2076. doi: 10.1021/bc070116l. [DOI] [PubMed] [Google Scholar]
- 54.Duncan R, Izzo L. Dendrimer biocompatibility and toxicity. Adv Drug Deliver Rev. 2005;57:2215–2237. doi: 10.1016/j.addr.2005.09.019. [DOI] [PubMed] [Google Scholar]
- 55.Shao NSY, Hu J, Zhang J, Zhang H, Cheng Y. Comparison of generation 3 polyamidoamine dendrimer generation 4 polypropylenimine dendrimer on drug loading complex structure release behavior and cytotoxicity. Int J Nanomed. 2011;6:3361–3372. doi: 10.2147/IJN.S27028. [DOI] [PMC free article] [PubMed] [Google Scholar]
- 56.Oberhammer FA, Hochegger K, Fröschl G, Tiefenbacher R, Pavelka M. Chromatin condensation during apoptosis is accompanied by degradation of lamin A+B, without enhanced activation of cdc2 kinase. J Cell Biol. 1994;126:827–837. doi: 10.1083/jcb.126.4.827. [DOI] [PMC free article] [PubMed] [Google Scholar]
Associated Data
This section collects any data citations, data availability statements, or supplementary materials included in this article.