

Abstract
Autonomic nervous system (ANS) response to acupuncture has been investigated by multiple studies; however, the brain circuitry underlying this response is not well understood. We applied event‐related fMRI (er‐fMRI) in conjunction with ANS recording (heart rate, HR; skin conductance response, SCR). Brief manual acupuncture stimuli were delivered at acupoints ST36 and SP9, while sham stimuli were delivered at control location, SH1. Acupuncture produced activation in S2, insula, and mid‐cingulate cortex, and deactivation in default mode network (DMN) areas. On average, HR deceleration (HR−) and SCR were noted following both real and sham acupuncture, though magnitude of response was greater following real acupuncture and inter‐subject magnitude of response correlated with evoked sensation intensity. Acupuncture events with strong SCR also produced greater anterior insula activation than without SCR. Moreover, acupuncture at SP9, which produced greater SCR, also produced stronger sharp pain sensation, and greater anterior insula activation. Conversely, acupuncture‐induced HR− was associated with greater DMN deactivation. Between‐event correlation demonstrated that this association was strongest for ST36, which also produced more robust HR−. In fact, DMN deactivation was significantly more pronounced across acupuncture stimuli producing HR−, versus those events characterized by acceleration (HR+). Thus, differential brain response underlying acupuncture stimuli may be related to differential autonomic outflows and may result from heterogeneity in evoked sensations. Our er‐fMRI approach suggests that ANS response to acupuncture, consistent with previously characterized orienting and startle/defense responses, arises from activity within distinct subregions of the more general brain circuitry responding to acupuncture stimuli. Hum Brain Mapp 34:2592–2606, 2013. © 2012 Wiley Periodicals, Inc.
Keywords: orienting response, defense response, acupoint, skin conductance response, heart rate
INTRODUCTION
Autonomic nervous system (ANS) modulation by acupuncture has been postulated to provide a mechanistic pathway by which acupuncture produces therapeutic response, such as down‐regulation of inflammation [Oke and Tracey, 2009], ANS‐mediated pain relief [Andersson and Lundeberg, 1995], and cardiovascular health [Li and Longhurst, 2010]. While ANS response to acupuncture has been evaluated in multiple studies [Abad‐Alegria et al., 2001; Backer et al., 2002; Haker et al., 2000; Imai and Kitakoji, 2003; Knardahl et al., 1998; Nishijo et al., 1997; Sugiyama et al., 1995; Wang et al., 2002; Yao, 1993], the brain control circuitry that modulates this ANS response is not well known in the human. Neuroimaging coupled with concurrent peripheral autonomic measurements has recently been performed [Beissner et al., 2012], and may help elucidate the brain circuitry controlling autonomic response to acupuncture, thus suggesting potential mechanisms of acupuncture action.
One potential application of combined ANS‐fMRI analyses lies in determining the neural correlates of different psychophysiological response patterns to acupuncture. For instance, previous studies of ANS response to acupuncture have found that acupuncture stimulation can induce both increased [Haker et al., 2000; Knardahl et al., 1998; Yao, 1993], and decreased [Abad‐Alegria et al., 2001; Backer et al., 2002; Imai and Kitakoji, 2003; Nishijo et al., 1997; Sugiyama et al., 1995; Wang et al., 2002] heart rate (HR). Interestingly, different psychophysiological / behavioral response patterns can be identified based on HR response [Ohman et al., 2007]. The Orienting Response (OR) was first described ** by Pavlov, 1927], and is a physiological response to any novel, moderate intensity stimulus and is thought to arise from a mismatch between the stimulus and the subject's expectation for that stimulus [Sokolov and Cacioppo, 1997]. The OR is characterized by a decrease in HR [Cook and Turpin, 1997; Graham and Clifton, 1966; Stelmack and Siddle, 1982]. In contrast to the OR, the startle (SR) and defense (DR) response is characterized by an increase in HR [Turpin, 1986]. The SR/DR is evoked by high intensity stimuli with high negative affective content. Thus, decelerative and accelerative HR response to acupuncture may relate to previously noted OR and SR/DR patterns, respectively.
To perform robust combined ANS‐fMRI evaluation for acupuncture stimulation, a methodological advance would be beneficial. Previous fMRI studies evaluating brain response to acupuncture have almost exclusively used block designs to localize response in a diffuse network of brain regions, with any acupoint specificity remaining controversial [Dhond et al., 2007]. The use of relatively long (>20 s) stimulation blocks, coupled with several methodological limitations [Beissner and Henke, 2009], have led to heterogeneity in the results reported using this approach. Clinical acupuncture with manual stimulation almost never involves continuous needle stimulation for such long periods of time. Event‐related fMRI (er‐fMRI) is an experimental design adapted from event‐related potential (ERP) studies, which has been applied for more than a decade to robustly image brain response to discrete, short duration external stimuli [Dale and Buckner, 1997]. Many more events than blocks can be included in a single experimental run, thus allowing for robust multiacupoint stimulus designs more consistent with clinically relevant multiacupoint treatment protocols. Moreover, concurrent ANS response, which can take several seconds post‐stimulus to develop, can readily be estimated for each individual event. Thus, while the er‐fMRI experimental design has not been applied in past acupuncture fMRI studies, its advantages offer a tantalizing potential to further decode brain response to acupuncture and, importantly, to execute combined ANS‐fMRI analyses.
In this study, we have, for the first time, applied er‐fMRI to evaluate the brain correlates of acupuncture stimulation. This approach has allowed us to link brain response to acupuncture stimulation with synchronous ANS response, thereby determining the brain circuitry underlying different autonomic outflow patterns—e.g., decelerative (HR−) versus accelerative (HR+) HR response. Different autonomic outflow patterns may have meaningful implications on clinical response to acupuncture [Sparrow, 2007] and we hypothesized that different psychophysiological response patterns, denoted by different ANS outflows, result from different brain responses to acupuncture stimuli.
METHODS
Subjects
Data were collected from eighteen (18) right‐handed [Oldfield 1971], healthy subjects (11 females, 7 males; 27.9 ± 11.0 years old). Subjects were naïve to acupuncture treatment and were recruited via email advertisements and fliers adhering to MGH guidelines for distribution at neighboring academic institutions and hospitals. Subjects were screened to assure their safety and compatibility with MRI recording at the Martinos Center for Biomedical Imaging. All participants in the study provided written informed consent in accordance with the Human Research Committee of the Massachusetts General Hospital.
Experimental Design and MRI Data Acquisition
Functional MRI (fMRI) studies were performed using a 3.0 Tesla Siemens Tim Trio MRI System (Siemens Medical, Erlangen, Germany) equipped for echo planar imaging with a 12‐channel head coil. Subjects lay supine in the scanner and wore earplugs to attenuate excessive noise levels due to MR gradient switching. During fMRI scanning, subjects were instructed to visually fixate on a green crosshair presented over a black background and remain as still as possible throughout the scan. Subjects were also informed that they would experience stimuli at three locations on their left leg, and that “different forms of acupuncture” would be used.
Structural imaging was performed with a T1‐weighted pulse sequence (MPRAGE, TR/TE = 2530/3.39 ms, flip angle = 7°, FOV = 256 × 256 mm2, slice thickness = 1.33 mm) in order to aid anatomical localization. FMRI data were collected using a T2*‐weighted blood oxygenation level dependent (BOLD) pulse sequence (TR/TE = 2,000/30 ms, flip angle = 90°, FOV = 200 × 200 mm2, matrix = 64 × 64, voxel size = 3.125 × 3.125 × 3.84 mm3, 34 interleaved axial slices, 150 whole brain volumes, total run time = 300 s) and PACE prospective motion correction [Thesen et al., 2000]. A multi‐echo fieldmap scan (f.a. = 55°, TR/TE1/TE2 = 500/3.38/5.84 ms) was also collected to help compensate for B0 inhomogeneity.
Acupuncture procedures included real needling with pure silver, non‐magnetic needles (0.23 mm × 30 mm, Asahi Industry, Kawaguchi, Japan). Needles were inserted by a licensed acupuncturist with more than 8 years of experience (SC), trained to operate in the MRI environment. Needles were inserted ∼ 2 to 3 cm deep into two locations on the left lower leg: acupoint ST36 (Zusanli), over the tibialis anterior muscle, and SP9 (Yinlingquan), at the lower border of the medial condyle of the tibia (Fig. 1). Sham acupuncture was performed on the left leg at a location not conventionally associated with an acupoint (SH1, about 2.5 cm proximal to the proximal edge of the patella, Fig. 1). This control location was chosen as it does not coincide with any classically defined acupoint or meridian structure, but is also located on the subjects' left leg. For sham acupuncture, needle insertion was simulated by poking a 5.88 von Frey monofilament through a plastic guide‐tube (equivalent to that used for ST36 and SP9), until it struck but did not penetrate the skin. Our group has used this control point and/or non‐penetrating procedure in several previous studies [Dhond et al., 2008; Napadow et al., 2005, 2007, 2009]. The choice of control stimulation was also motivated by many previous acupuncture clinical trials and translational neuroimaging research studies, which have also used non‐penetrating sham needling at nonacupoint locations [Bajaj et al., 2003; Edwards et al., 2009; Harris et al., 2009].
Figure 1.
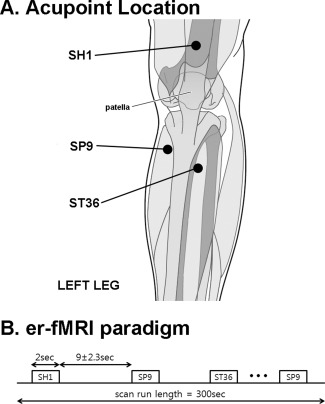
Experiment design. A: Locations for acupuncture stimulation included acupoints SP9 and ST36, as well as sham location SH1, all on the left leg. B: The event‐related experimental paradigm consisted of a total of nine acupuncture stimulation events per location, with duration of 2 s and an interstimulus interval of 11.0 ± 2.3 s.
FMRI scanning consisted of two scan runs to improve estimation power. During each 300‐s event‐related fMRI scan run, the acupuncturist manually stimulated ST36 and SP9 by rotating the needles ±180° at ∼ 1 Hz during 2‐s duration “events”. This event duration was chosen because (a) our effective fMRI temporal resolution (i.e., TR) was 2 s, (b) previous event‐related fMRI studies of somatosensory stimuli have used a range of event durations (under 1–3 s) that includes our choice of duration [Fahy, 2010; Ohashi et al., 1994; Pasricha et al., 2011; Tillisch and Labus, 2011; Xiong et al., 2009], and (c) clinical acupuncture texts suggest that the acupuncture needle should be stimulated manually to elicit deqi sensation, and then left to rest [Cheng, 1996; Stern et al., 2011]. Thus, a brief manual stimulation that elicits sensation (confirmed by questionnaire, see below) is arguably more clinically relevant than longer duration (30 s–2 min) block‐like stimulation used in most previous acupuncture fMRI studies. SH1 was stimulated during prescribed events by poking the skin at ∼ 1 Hz with the von Frey monofilament. Stimulation order between ST36, SP9, and SH1 was pseudo‐randomized and each run and consisted of a total of 27 events, 9 events for each of the 3 stimulus locations. The interstimulus interval (ISI) was 11.0 ± 2.3 s (range, 8–14 s). The acupuncturist, who manually performed each stimulation, was cued prior to when each stimulus was to occur by an auditory cue generated through in‐house software (MATLAB, The MathWorks, Natick, MA), and transmitted via MR‐compatible headphones into the scanner room.
A trigger pulse generated at the onset of each TR during fMRI scanning was used to synchronize brain fMRI data acquisition with peripheral (ANS) physiological data acquisition, and with auditory cue generation. This procedure ensured the synchronization of imaging and autonomic data acquisition with discrete acupuncture stimulation.
Physiological Data Acquisition
During each fMRI scan run, peripheral ANS data were collected from several different end‐organs. These data included electrocardiography (ECG), skin conductance response (SCR), and respiratory monitoring. All peripheral physiological data were acquired using the Powerlab system (ML880, ADInstruments, Colorado Springs, CO) at a 1 kHz sampling rate. ECG data were filtered via a MR‐compatible monitor (InVivo Magnitude CV, Invivo Research, Orlando, Florida) designed to minimize radiofrequency (RF) and gradient switching artifacts generated during the MRI scan. SCR data were collected via MR‐compatible Ag/Ag‐Cl electrodes (MLT117F, ADInstruments, Colorado Springs, CO) and preprocessed using a 60 Hz notch filter. Respiratory data were collected using an MR‐compatible belt system constructed in‐house, based on the system devised by Binks et al., 2007.
Physiological Data Analysis
Physiological data were synchronized to each other and to the fMRI data using the MRI‐generated TTL trigger. Analyses quantified several ANS outflow metrics, which included heart rate (HR) from the ECG signal, SCR, and respiratory signal from the respiration belt system. Data from multiple events were averaged relative to stimulus onset, and with respect to a 2‐s baseline preceding stimulation events. HR was analyzed as maximum heart rate change relative to this baseline. For acupoint comparisons, as mean HR response was predominantly decrease for stimuli at all locations, we first found the time at which peak decrease occurred for each location's group averaged HR response. We then found the average time‐to‐peak for these three stimulus locations, and HR response at this time point was contrast between different locations (see below). Paired comparisons were also made for SCR, which was calculated as area under curve (AUC, μS/s), similar to previous studies [Naqvi and Bechara, 2006]. Unfortunately, ISI was too short to effectively explore respiratory response to acupuncture stimulation events. Instead, respiration data were used to correct for respiratory artifact in fMRI data (see below).
Data for HR and SCR were individually compared between different acupoints (SP9 vs. ST36) and between acupoints and sham acupuncture stimulation at SH1. These comparisons were performed using a Student's t‐test (SPSS for Windows v. 10.0.7, SPSS, Chicago, IL). We also performed a cross‐correlation analysis to investigate correlations between our different ANS outflow metrics (HR, SCR). Pearson's correlation coefficients were calculated from acupuncture stimulation events for each scan run and were transformed to z‐scores using a Fischer r‐to‐z transform. These z‐scores were then passed up to a group level one–sample Students' t‐test, which determined if the z‐score was different from nil, significant at P < 0.05, Bonferroni corrected for multiple comparisons.
One of our motivations was to determine the neural correlates of acupuncture induced HR− versus HR+ response. HR acceleration versus deceleration has been used in the past to differentiate psychophysiological/behavioral responses [Cook and Turpin, 1997; Graham and Clifton, 1966]. Moreover, while no standardized methodology exists, several groups have separated subject and/or event responses into accelerator or decelerator subgroups using such methods as cluster analysis [Hodes et al., 1985], and maximum absolute change [Turpin et al., 1999] for post‐stimulus windows. We appropriated similar methods in order to determine whether HR response to acupuncture stimulation constituted HR− or HR+. The HR time‐series relative to each event was first transformed by subtracting the mean of the 2‐s baseline preceding each event. We then calculated the maximum absolute change in the 6‐s window following needle stimulation. If the maximum absolute change was from a positive deflection in HR, we classified that event's accelerative response as HR+, and vice versa.
Acupuncture‐Induced Sensation
To assess sensations elicited by stimulation at SP9, ST36, and SH1, the MGH Acupuncture Sensation Scale (MASS) was administered to all subjects after the scan [Kong et al., 2007]. The MASS is a numerical rating scale including multiple sensations associated with acupuncture stimulation. It is anchored by “nil” and “unbearable.” The MASS Index (MI), a summary measure of deqi sensation [Kong et al., 2007], was calculated and compared between the three stimulus locations using paired Students' t‐tests. Additionally, the same analysis was done for sharp pain intensity, as sharp pain is not considered to be a component of deqi sensation, has been associated with different brain response compared to more classical deqi sensations [Hui et al., 2005], and is not included in the MI. Subjects' acupuncture sensation ratings were also used in correlation analyses with ANS outflow measures.
FMRI Data Preprocessing
Data analysis was performed using conventional, validated algorithms available from several different analysis packages including FSL (FMRIB's Software Library) [Smith et al., 2004] and AFNI [Cox, 1996]. Functional data were preprocessed to correct for magnetic field inhomogeneities caused by magnetic susceptibility differences in neighboring tissues within the head (FSL‐FUGUE) and motion corrected to compensate for any head movements using a linear (affine) transformation procedure (FSL‐MCFLIRT). Brain extraction was performed on functional data using FSL‐BET while skull stripping of structural data for improved alignment utilized routines available with in‐house FreeSurfer software [Dale et al., 1999]. Functional data were smoothed using a Gaussian kernel of FWHM 5mm; and high‐pass temporally filtered (f = 0.02 Hz), a step also performed on general linear model (GLM) regressors. Cardio‐respiratory artifact was mitigated in fMRI data using the collected ECG and respiration signals and both the previously validated RETROICOR algorithm [Glover et al., 2000], and GLM nuisance variables (see below).
After preprocessing, fMRI data were analyzed to test for (1) brain response differences following acupuncture stimulation at different locations, (2) brain correlates of differential HR response to acupuncture: i.e., HR− versus HR+, (3) brain correlates of high versus low SCR response, and (4) within‐subject (i.e., between event) correlation between fMRI and ANS (i.e., HR, SCR) response.
Brain Response to Acupuncture
A GLM was constructed with separate regressors for SP9, ST36, and SH1 stimulation events (FSL‐FEAT). Each regressor was convolved with a canonical double gamma hemodynamic response function. In order to remove any residual cardio‐respiratory artifact from the data, nuisance regressors were added to this GLM and included the respiratory and cardiac response functions, as previously estimated from the literature [Birn et al., 2008; Chang et al., 2009]. Contrasts at the single subject level evaluated SP9‐SH1, ST36‐SH1, and SP9–ST36.
Differential Brain Response for HR+ Versus HR− Response to Acupuncture
To investigate differential brain response to HR− versus HR+ response to acupuncture, HR response for both ST36 and SP9 stimulation events was first used to code each response as either HR− or HR+ (see above). The number of acupuncture stimulation events classified as HR− in each run was significantly greater than HR+ events (HR−: 10.9 ± 1.8, HR+: 6.7 ± 2.1, P < 0.001), and in any given run the number of HR− and HR+ events rarely matched exactly. Thus, HR− and HR+ events were sorted by peak amplitude and based on the average number of less frequent HR+ events noted above, we estimated the HR− group map from the six events showing most robust HR deceleration, and the HR+ map from the six events showing most robust HR acceleration. This procedure, which matched the number of events in each regressor of interest, ensured comparable estimation power for the [HR+] – [HR−] contrast calculated within the fMRI GLM. HR− (or HR+) events not used for estimation were still included in the GLM as a nuisance regressor. We then averaged both scan runs from the same subject using a fixed effects model (FSL‐FEAT), passing up the results to the higher group level, intersubject analyses.
Differential Brain Response for High Versus Low SCR to Acupuncture
To investigate differential brain response to high versus low SCR response to acupuncture, we first subdivided acupuncture (ST36 and SP9) events into tertiles based on the magnitude of SCR associated with each event. Thus each tertile had an equal number of events, assuring a fair comparison when we later contrasted fMRI response for high (highest tertile) versus low (lowest tertile) SCR events on the single subject level. We then averaged both scan runs from the same subject using a fixed effects model (FSL‐FEAT), passing up the results to the higher group level, intersubject analyses.
Differentiating Brain Correlates of ANS Response for Different Acupoints
Finally, in order to contrast the brain correlates of ANS response to different acupoints, we performed an intra‐subject (between‐event) correlation analysis. This analysis can, theoretically, reliably link brain response with concomitant autonomic outflow, as long as intrasubject variability dominates intersubject variability. Each acupuncture stimulus event was modeled separately, and a multiple linear regression model was set up using inputs from both scan runs for each subject. This model was used separately for (1) HR deceleration (the dominant HR response) score, and (2) SCR AUC score. Regression coefficients (and their variances) were calculated for each acupuncture location (SP9, ST36, SH1) and passed up to the higher group level. Furthermore, in order to compare intrasubject versus intersubject variability for both HR deceleration and SCR, we calculated intraclass correlation coefficients (ICC), which represent the ratio of intersubject variance divided by total (intersubject plus intrasubject) variance (SPSS v.10.0.7, SPSS, Chicago, IL).
Group fMRI Data Analyses
Group analyses were performed by first coregistering functional with anatomical MRI data, and then transforming GLM parameter estimates and their variance into standard MNI152 space (FSL‐FLIRT). Optimal coregistration was ensured by visualization with the AFNI software suite [Cox, 1996].
Group main effect maps (one sample t‐test) for different stimulus locations (SP9, ST36, SH1), as well as difference maps (e.g., paired t‐test for SP9‐ST36, SP9‐SH1, and ST36‐SH1) were calculated to explore heterogeneity in brain response using our event‐related approach. An intermediate (second) level analysis used a fixed‐effects model to combine the two fMRI scan runs from each subject. The resultant parameter estimates and their variance were then passed up to a between‐subjects level analysis, which used FMRIB's Local Analysis of Mixed Effects (FLAME). This model uses Markov Chain/Monte Carlo sampling to estimate the true random‐effects component of the between‐subject mixed effects variance and degrees of freedom at each voxel. The results were then threshold at z = 2.3, cluster‐corrected for multiple comparisons at P < 0.01.
A similar approach was used for analysis of HR+ versus HR− events and high versus low SCR events, passed up from single subject level. These difference map analyses theoretically control for non‐ANS related aspects of the stimulus. Group difference maps were threshold at z = 2.3, cluster‐corrected for multiple comparisons at P < 0.01.
Finally, the group averaged correlation map for ANS response at each acupoint location and correlation difference maps between different acupoint locations were calculated by passing up results of the single subject correlation analysis (effectively the regression slopes and their variances, as well as slope differences) to a mixed effects group level map calculation. These group level results were threshold at z = 2.3, cluster‐corrected for multiple comparisons at P < 0.01.
RESULTS
Acupuncture‐Induced Sensation
The intensity of acupuncture‐induced sensations was quantified with the MASS questionnaire. We found that MASS Index was greater for both SP9 (4.45 ± 1.84, μ ± σ) and ST36 (4.67 ± 2.32), compared with SH1 (1.64 ± 1.91, P < 0.001 for both SP9 and ST36 versus SH1). It did not differ between SP9 and ST36 (P > 0.6). In addition, dull pain (a component of the MASS Index) was similarly stronger for both SP9 (3.55 ± 2.56, on a numerical rating scale of 0–10) and ST36 (4.10 ± 2.75), compared with SH1 (1.18 ± 2.02, P < 0.001 for both), and did not differ between SP9 and ST36 (P > 0.3). However, sharp pain, which was also greater for SP9 (4.63 ± 2.67) compared with SH1 (1.79 ± 2.32, P < 0.001), did not differ between ST36 (2.76 ± 2.17) and SH1 (P > 0.1), and in fact was found to be greater for SP9 compared with ST36 (P = 0.003). In general, ratings of MASS Index (MI), dull pain, and sharp pain intensity were all correlated with one another (MI/dull pain: r = 0.78; dull pain/sharp pain: r = 0.67; MI/sharp pain: r = 0.63, P < 0.001 for all correlations) for ST36 and SP9 needle stimulation.
ANS Response to Acupuncture: HR and SCR
MRI‐associated artifacts are known to plague physiological data [Gray et al., 2009]. Thus, all ANS data were not available from all individuals. ECG data were evaluated from 16 subjects, and SCR data from 15 of our 18 subjects.
Event‐related ANS response was calculated for HR and SCR following acupuncture stimuli at SP9, ST36, and SH1 (Fig. 2). Group averaged data demonstrated that HR decreased and SCR increased following stimulation at all locations. Peak HR decrease was greater for ST36 stimulation (−2.88 ± 2.12 BPM) compared with both SP9 (−1.74 ± 2.01 BPM, P < 0.05) and SH1 (−1.00 ± 1.31 BPM, P < 0.001). The phasic SCR was greater following SP9 stimulation (1.99 ± 1.41 μS/s), compared with both ST36 (1.55 ± 1.19 μS/s, P < 0.05) and SH1 (1.41 ± 0.85 μS/s, P < 0.01) stimulation.
Figure 2.
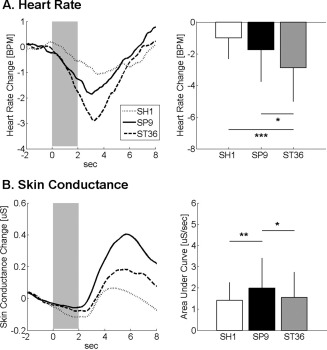
ANS response to acupuncture. A: Heart rate decrease was noted following stimulation at SH1, SP9, and ST36, and was most robust for ST36. B: Increased skin conductance response was noted for all locations, most prominently following acupuncture at SP9. n.b. *<0.05, error bars represent standard deviation.
A cross‐correlation analysis found no significant correlations between HR and SCR (HR/SCR: r = 0.06, P > 0.1), i.e., events eliciting stronger HR decrease were not more likely to elicit strong SCR increase.
SCR was significantly correlated with acupuncture sensation (MI/SCR: r = 0.45, P = 0.017, Sharp pain/SCR: r = 0.53, P = 0.004) (Fig. 3). A nonsignificant, but notable negative correlation was found between MI and HR response (r = −0.28, P = 0.15). Interestingly, all but one subject reacted to acupuncture stimulation with mean HR decrease (Fig. 3), and if that one mean HR+ “outlier” subject is removed from the plot, trending significance appears in the correlation between MI and HR (r = −0.36, P = 0.06). There was no correlation between HR response and sharp pain (with or without the outlier, P > 0.2).
Figure 3.
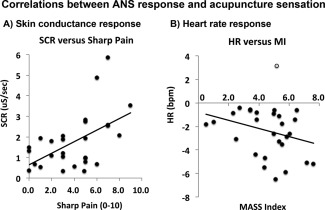
Intersubject correlations between ANS response and acupuncture sensation. A: Skin conductance response increased (r = 0.53, P = 0.004) with increasing sharp pain sensation. B: Heart rate response was, on average, deceleration for all but one subject (gray circle). If this subject is removed from the correlation, a near‐significant trend (r = −0.36, P = 0.06) is found in the correlation between HR response and acupuncture deqi sensation (assessed with the MASS Index, MI).
ANS Response to Acupuncture: HR+ Versus HR−
While the group‐averaged HR response to acupuncture stimulation was undeniably HR deceleration (HR−), a closer analysis showed interesting heterogeneity in response patterns across trials. While most individual trial responses mirrored the group HR− response, a minority of responses demonstrated predominant HR acceleration (HR+) (Fig. 4). We separated trials based on the valence of peak HR deflection. A group average of all events classified as HR− demonstrated peak HR decrease 3 s after stimulus onset. In contrast, HR response for events classified as HR+ demonstrated peak increase 6 s after stimulus onset (Fig. 4 , see arrows). However, at both 3‐s (HR−: −4.3 ± 2.2 BPM, μ ± σ; HR+: 1.0 ± 2.0 BPM) and 6‐s (HR−: −2.1 ± 1.7 BPM, HR+: 3.3 ± 2.5 BPM) after stimulus onset, HR− events demonstrated a significantly different HR response than HR+ events (Student's t‐test, P < 0.001 for both). Also, at both timepoints, the HR− response curve was significantly lower than baseline (P < 0.001), while the HR+ response curve was significantly greater than baseline (P < 0.01 for 3‐s, and P < 0.001 for 6‐s).
Figure 4.
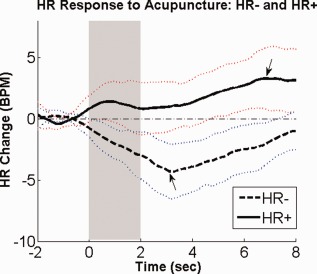
Differential HR response to acupuncture: HR+ and HR−. Heart rate (HR) change in response to acupuncture stimuli could be separated into accelerator (HR+) and decelerator (HR−) response patterns. n.b. the light dotted lines represent standard deviation. [Color figure can be viewed in the online issue, which is available at http://wileyonlinelibrary.com.]
When comparing different acupoints, stimulation at ST36 elicited significantly more HR− events (5.8 ± 1.0) than HR+ events (3.1 ± 1.1, P < 0.001). While no significant difference was found for SP9, there was also a trend (HR−: 5.2 ± 1.4, HR+: 3.6 ± 1.6, P = 0.07) for more HR− events. This preponderance of HR− events was consistent with the group‐averaged phasic HR responses (see Fig. 2). A chi‐square test evaluated if more HR+ events came from SP9 and more HR− events came from ST36. The result of this test was not significant (P > 0.1).
Event‐Related fMRI Response to Acupuncture
The event‐related fMRI protocol succeeded in producing robust brain response maps for acupuncture stimulation. Group maps from 18 subjects' data were created for acupuncture stimulation at SP9, ST36, and SH1 (Fig. 5, Supporting Information Table 1).
Figure 5.
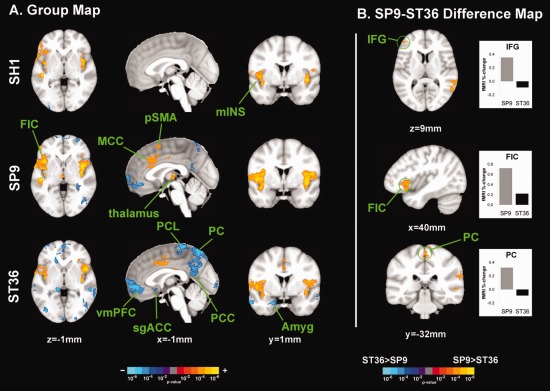
Brain response to stimuli at different acupoints. A: FMRI response group maps for SH1, SP9, and ST36 stimulation suggested heterogeneity in brain response. B: SP9 stimulation elicited greater activation in right IFG and FIC, compared to ST36. However, ST36 stimulation elicited more deactivation in the PC. n.b. amyg, amygdale; MCC, middle cingulate cortex; IFG, inferior frontal gyrus; mIns, middle insula; PC, precuneus; PCC, posterior cingulate cortex; PCL, paracentral lobule; FIC, fronto‐insular cortex; sgACC, subgenual ACC; vmPFC, ventromedial prefrontal cortex. [Color figure can be viewed in the online issue, which is available at http://wileyonlinelibrary.com.]
Sham acupuncture on left SH1 produced activation in bilateral somatosensory (S2) and fronto‐insular (FIC) and middle insular cortices, temporal gyrus (superior, STG, and middle, MTG), and right inferior and middle frontal gyrus (IFG, MFG) (Fig. 5, Supporting Information Table 1). Deactivation was noted in bilateral inferior parietal lobule, right fusiform gyrus, and the leg area of the right primary motor cortex (M1).
Left SP9 stimulation activated bilateral S2 and insular (including FIC and middle) cortices, and both anterior and posterior middle cingulate cortices (MCC), right thalamus, pre‐supplementary motor area (pSMA), and left cerebellum (Fig. 5, Supporting Information Table 1). SP9 stimulation also produced deactivation in the ventromedial prefrontal cortex (vmPFC), precuneus (PC), posterior cingulate cortex (PCC), inferior parietal lobule (IPL), and right cerebellum.
Left ST36 stimulation activated bilateral S2 and insular (including FIC) cortices, aMCC, and pMCC (Figure 5, Supporting Information Table 1). Broad deactivation was noted in vmPFC, PC, PCC, IPL, inferior and middle temporal gyrus (MTG), hippocampal formation (HF), amygdala, subgenual ACC (sgACC), orbitofrontal gyrus (OFG), superior parietal lobule (SPL), left paracentral lobule (PCL), right SI/M1, right middle and superior frontal gyri (including frontal pole), and bilateral occipital gyri (OcG).
Differences in brain response to needle stimulation at different acupoints was evaluated by contrasting SP9 stimulation with ST36 stimulation using a within‐run paired analysis. Significantly greater activation was noted for SP9 stimulation in right FIC, MFG, IFG, and left MTG and STG. Greater deactivation was noted for ST36 stimulation in the PC, PCL, and supramarginal gyri (SMG) (Figure 5, Supporting Information Table 2).
Compared with SH1, SP9 stimulation produced greater activation in right fronto‐ and middle insular cortices, aMCC, S2, and pSMA (Supporting Information Table 2). Greater deactivation was noted in intra‐parietal sulcus (iPS), SPL, and SMG. Also, compared with SH1, ST36 produced more prominent deactivation in SPL, PC, PCL, iPS, SPL, SMG, ANG, MTG, OFG, frontal gyri, and left cerebellum. SH1 produced greater activation than ST36 in bilateral STG.
Differential Brain Response Associated with HR− Versus HR+ Response to Acupuncture
Brain response for acupuncture HR− events contrasted significantly with brain response for HR+ events (Fig. 6, Supporting Information Table 3). A direct contrast difference map demonstrated greater de‐activation for HR− events compared with HR+ activation in PC, PCL, and post‐central gyrus (poG)/SPL.
Figure 6.
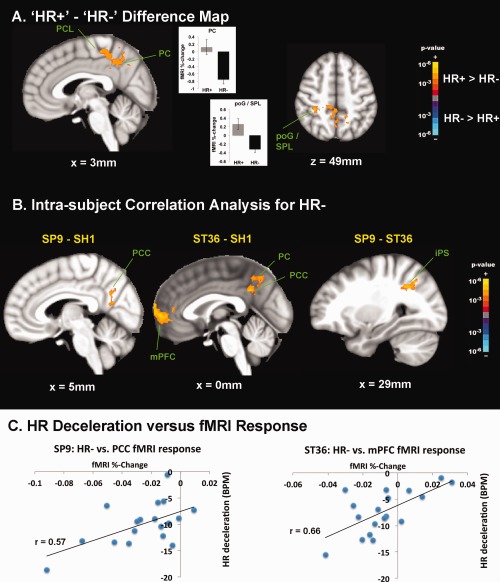
Brain correlates of HR responses to acupuncture. A: Difference map contrasting [HR+] – [HR−] demonstrated greater deactivation for HR− in PCL and DMN areas such as PC. Greater activation for HR+ events was noted in a parietal cluster consistent with poG/SPL. B: An intrasubject correlation analysis with HR− response found that compared with SH1, both SP9 and ST36 demonstrated greater significance in the correlation between HR deceleration and deactivation in DMN areas such as PCC, PC, and mPFC. Also, in comparison with ST36, SP9 stimulation produced greater significance in the correlation between HR− and right iPS activity. C: Greater DMN deactivation correlated with greater HR deceleration following verum acupuncture (SP9 and ST36) stimulation, as evidenced in a representative subject. n.b. iPS, intraparietal sulcus; poG, post‐central gyrus; SPL, superior parietal lobule. [Color figure can be viewed in the online issue, which is available at http://wileyonlinelibrary.com.]
ANS‐fMRI Correlation Analyses: Acupoint Comparisons
We evaluated potential differences between acupoints for brain regions where event‐to‐event variability in brain response correlated with event‐to‐event variability in HR deceleration (the dominant HR response) and SCR. Estimation power for this correlation analysis is maximized when intrasubject (between‐event) variability dominates over intersubject variability. This relationship was evaluated with an intraclass correlation coefficient (ICC). The ICC for HR was 0.12 (95% confidence interval = −0.46 to 0.54), while the ICC for SCR was 0.68 (95% confidence interval = 0.47–0.83). Hence, the within‐subject dynamic range and between‐subject consistency was favored in the correlation analysis for HR versus SCR.
For SH1, greater HR deceleration was positively correlated with deactivation in several brain areas—i.e., greater HR deceleration corresponded to greater fMRI signal decrease. These areas included DMN regions such as IPL, as well as regions in the temporal gyrus, and sensorimotor processing regions (see Supporting Information Table 3). For SP9, positive correlation was again found for DMN regions such as PC, PCC, and IPL, as well as motor (M1, premotor), cognitive (dlPFC) and cerebellar brain regions. A broad network of regions was positively correlated for ST36, including DMN areas (PCC, mPFC), pMCC, temporal gyrus, dlPFC, basal ganglia, and cerebellum. No negative correlations were found for any acupoint location.
Differences between acupoints were also noted (Fig. 6, Supporting Information Table 3). Compared with SH1, both SP9 and ST36 demonstrated greater significance in the correlation between HR deceleration and DMN (e.g., mPFC, PCC, PC, IPL, MTG) deactivation in response to stimulation. Also, in comparison with ST36, SP9 stimulation produced greater significance in the correlation between HR− and right iPS activity.
Because of the results of the ICC analysis, the results for a similar intrasubject correlational analysis using SCR (Supporting Information Table 4) was not reliable. However, we believe that the difference map approach (see below), which yielded results different from the between‐event correlational analysis, was more appropriate to interrogate the relationship between SCR and brain response to acupuncture.
Difference in Brain Response for High–Low SCR
High SCR events (2.68 ± 1.79 μS ±, μ ± σ) were contrast with low SCR events (1.16 ± 0.86 μS, P < 0.01). We found that brain activation for high SCR events was greater in FIC, MCC, and SMA, while activation for high SCR events contrasted with deactivation for low SCR events in the pre‐SMA and SFG (Fig. 7, Supporting Information Table 4). No brain regions demonstrated greater response for low SCR events compared with high SCR events.
Figure 7.
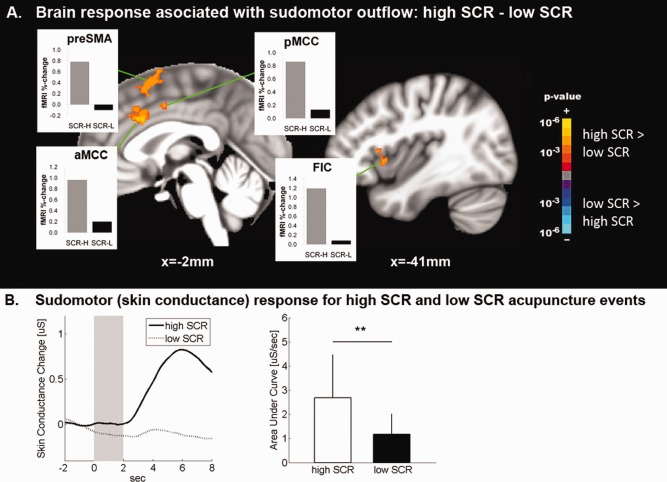
Brain correlates of sudomotor response to acupuncture. A: Brain correlates of acupuncture‐induced SCR demonstrated greater brain response to acupuncture stimulation events in MCC and anterior insula when SCR was high, compared with when SCR was low. B: SCR magnitude for “high‐SCR” events was significantly greater than for “low‐SCR” events. n.b. ** = P < 0.01, error bars represent standard deviation. [Color figure can be viewed in the online issue, which is available at http://wileyonlinelibrary.com.]
DISCUSSION
Our study applied er‐fMRI to evaluate the brain correlates of ANS response to acupuncture stimulation at different acupoints. This approach allowed us to investigate the brain circuitries underlying different ANS outflows, for different acupoints, as well as different response patterns, such as HR− and HR+. Acupuncture stimuli produced activation in S2, insula, and mid‐cingulate cortex, and deactivation in default mode network (DMN) areas. Differences between acupoints in brain response were noted for anterior insula activation, which was greater following SP9 compared with ST36 stimulation, while ST36 produced more robust DMN deactivation than both SP9 and sham acupuncture at SH1. On average, HR deceleration (HR−) and SCR were noted following both real and sham acupuncture, though magnitude of response was greater following real acupuncture and intersubject magnitude of response correlated with evoked sensation intensity. Acupuncture events with strong SCR also produced greater anterior insula activation than without SCR. Moreover, acupuncture at SP9, which produced greater SCR, also produced stronger sharp pain sensation, and greater anterior insula activation. Conversely, acupuncture‐induced HR− was associated with greater DMN deactivation. Between‐event correlation demonstrated that this association was strongest for ST36, which also produced more robust HR−. In fact, DMN deactivation was significantly more pronounced across acupuncture stimuli producing HR−, versus those events characterized by acceleration (HR+). Thus, differences in brain response to different acupoints may relate to differential autonomic outflows and may result from different sensations elicited by stimuli at these different bodily locations.
Previous studies of ANS response to acupuncture have found that acupuncture stimulation can induce both increased [Haker et al., 2000; Knardahl et al., 1998; Yao, 1993], and decreased [Abad‐Alegria et al., 2001; Backer et al., 2002; Imai and Kitakoji, 2003; Nishijo et al., 1997; Sugiyama et al., 1995; Wang et al., 2002] heart rate, but have rarely [Backer et al., 2002] explicitly placed their results into the context of known psychophysiological reflexes, such as the orienting response (OR) and startle/defense response (SR/DR), which have been differentiated by decelerative versus accelerative HR response, respectively [Graham and Clifton, 1966; Ohman et al., 2007; Turpin, 1986]. In our study, events with HR− response patterns may represent OR, while HR+ patterns may represent SR/DR. For SR/DR, HR increase onset is typically greater than 2 s (consistent with our data), and peak response can be as long as 30 s [Turpin, 1986], much longer than OR. The OR is a physiological response to any novel, moderate intensity stimulus and is thought to arise from a mismatch between the stimulus and the subject's expectation for that stimulus [Sokolov and Cacioppo, 1997]. It is characterized by stimulus‐associated SCR, pupillary dilation, and HR deceleration [Cook and Turpin, 1997; Graham and Clifton, 1966; Stelmack and Siddle, 1982]. The OR is accompanied by reduced somatic activity and hypothesized to be associated with enhanced sensitivity to sensory input—in effect priming the subject for future sensory evaluation [Sokolov, 1963]. In our study, acupuncture at both acupoints (ST36 and SP9) and noninsertive sham acupuncture at a nonacupoint (SH1) all produced HR deceleration—a hallmark of the OR. In fact, stimuli of any sensory modality (auditory, visual, somatosensory, etc.) can induce an OR. Also, some of the brain correlates of phasic ANS response to acupuncture are similar to those described by studies evaluating pain and other sensory stimuli [Piche et al., 2010]. However, as acupuncture directs orienting towards an internal target (the needle stimulus is localized inside the body), the acupuncture‐induced OR may have greater salience and may thus differ in behavioral/therapeutic consequence and duration of physiological response from auditory or visual‐induced OR—a hypothesis that should be tested in future studies.
In our study, a HR+ −HR− difference map as well as an intrasubject correlation analysis found a close linkage between HR deceleration and DMN deactivation. While research evaluating the brain correlates of ANS outflows consistent with OR and other psychophysiological reflexes has been limited, er‐fMRI studies suggest that visual OR (evidenced by SCR, not HR deceleration as in our study) was related to activation in the hippocampus, anterior cingulate and ventromedial prefrontal cortices [Williams et al., 2000]—the latter a key node of the DMN. Also, auditory OR, again evidenced by SCR, was related to activation in the amygdala and ventromedial and inferior prefrontal cortices [Williams et al., 2007]. Some of the differences between our results and those of Williams et al. may be due to differences in the ANS metric used to characterize OR (i.e., SCR versus HR), and/or stimulus modality. In fact, Williams et al. analysis approach was more similar to our analysis contrasting brain response for high versus low SCR events, which for us also demonstrated SCR‐associated activity in ACC, but, in contrast to Williams et al., also noted activity in anterior insula, and pSMA. In fact, insula and cingulate activity are commonly related to HR acceleration and SCR response to different stimuli [Critchley et al., 2003; Gray et al., 2009], supporting our SCR results. In our study, the discordance in brain activity associated with high SCR versus high HR− (i.e., robust DMN deactivation) is also supported by the lack of cross‐correlation between SCR and HR response to acupuncture events (see below). In fact, taken together, these results demonstrate that using only SCR to define an OR event is potentially problematic, as SR/DR will also produce SCR, while only HR can reliably differentiate these two patterns [Turpin, 1986]. Additionally, marginal differences between our results and those of previous studies may also be due to differences in stimulus modality, supporting our contention that acupuncture‐induced OR involves different affective, cognitive, and sensorimotor integration brain centers compared with visual and auditory‐induced OR.
In contrast to the predominant HR− response, some acupuncture stimulus events produced more robust HR acceleration (HR+) and thus are more characteristic of SR/DR [Turpin, 1986]. While it is not known why some acupuncture stimuli produced HR+, while others produced HR−, we suspect that, while context was generally consistent across stimuli, variable affective states stemming from variable sensation quality and/or intensity may have played a role. In fact, we found that SP9 stimulation produced more sharp pain intensity, less HR deceleration, and greater SCR compared with ST36. Greater sharp pain in response to acupuncture was correlated with greater SCR, while a trend was found for greater deqi sensation (MASS Index) correlating with greater HR deceleration. This result is broadly consistent with previous pain studies, which have demonstrated cross‐correlation between greater pain perception and greater SCR and insula activation [Piche et al., 2010]. While we could not correlate sensation with SCR or fMRI response on an event‐by‐event basis, future studies should collect sensation data following individual stimulus events for more detailed correlation analyses. In addition, SR/DR is likely an aversive response (e.g., “fight‐or‐flight”), to be avoided in a clinical setting, as it may preclude the establishment of beneficial tonic ANS responses, such as the “relaxation response,” which has been associated with characteristic modulation in ANS outflow to various end‐organs [Peng et al., 2004]. However, direct correlation of acupuncture‐induced phasic ANS response with tonic ANS outflow and, ultimately, clinical outcomes, remains to be investigated.
Provocative differences were noted between real and sham acupuncture, and between real acupuncture at two different acupoints, SP9 and ST36. While the phasic ANS response to both real and noninsertive sham acupuncture resulted in predominant HR decrease and SCR increase, differences in degree existed between different acupoints—e.g., ST36 stimulation produced greater HR decrease, while SP9 stimulation produced greater SCR. Previous studies have also demonstrated phasic SCR [Kang et al., 2011], and longer‐latency, post‐stimulus (tonic) skin conductance decrease [Hsu et al., 1985]. Our results suggest that the magnitude of deqi sensation and the phasic ANS response, which can differ for different acupoint locations (Fig. 2), may relate to the efficiency of different acupoints in modulating different neural circuitries. In fact, DMN deactivation significantly correlated with HR deceleration to a greater degree in real (SP9, ST36) versus sham acupoint locations. However, this relationship may have been driven by the greater deqi sensation evoked by verum versus sham acupoint stimulation. DMN regions such as vmPFC have been linked to acupuncture modulation of HR in recent studies [Beissner et al., 2012], which used a different, non‐erfMRI analysis approach. Additionally, increased correlation between activation in iPS and HR deceleration was noted for SP9, compared with ST36. This region has been implicated in higher order, visuo‐spatial and visuo‐motor integration [Uno et al., 2000]. Ultimately, we propose a more conservative form of “acupoint specificity”—i.e., one of modulatory degree rather than kind. Thus different locations for stimulation may be more efficient to produce physiological effect, and may also relate to the choice of different acupoints to treat different conditions in the clinic. For example, both insertive and noninsertive acupuncture needle stimulation at different locations has been shown to produce analgesia for chronic pain, with real acupuncture at specific points producing slightly better analgesia (a consistent, if not always a statistically significant finding across clinical trials) [Cummings, 2009; Hopton and MacPherson, 2010]. While many clinical trials of acupuncture have used nonpenetrating needling as a placebo control, placebos in efficacy studies should be physiologically inert. Our results suggest that fMRI and ANS response to sham acupuncture stimulation (even at nonacupoints) is robust and, while lower in amplitude, is grossly similar to real acupuncture; hence not physiologically inert.
We found very little cross‐correlation between the different ANS outflow measures—HR and SCR. Organ‐specific outflow in the parasympathetic system is generally accepted [Porges, 2007], and similar organ‐specific organization in the sympathetic system, while not as readily acknowledged, has recently been demonstrated as well [Janig, 2006; Morrison, 2001]. Thus, lack of cross‐correlation suggests that acupuncture can independently modulate ANS outflow to different end‐organs. This lack of cross‐correlation was further supported by different event‐related ANS/fMRI relationships for HR and SCR. Manual acupuncture, a relatively gross stimulus that cannot readily control evoked sensation, was very effective for producing significant dynamic range in ANS outflow, particularly HR deceleration. In fact, intrasubject (i.e., between‐event) variability dominated for HR deceleration (ICC = 0.12), while intersubject variability dominated for SCR (ICC = 0.68). We believe that this difference in ICC was related to greater consistency in results for difference map versus correlational approaches noted for the HR−/fMRI analyses, compared with SCR/fMRI analyses. Thus, our results suggest that future ANS/fMRI studies using similar correlational methods may choose to focus on HR response, if only one metric can be incorporated into the study design.
Our study represents the first application of er‐fMRI experimental design to acupuncture neuroimaging. Previous fMRI studies of brain response to acupuncture stimulation have mostly used blocked designs, and found activation in sensorimotor (e.g., SI, S2, SMA) and stimulus salience (e.g., insula) related areas, and deactivation in default‐mode network (DMN) areas and the amygdala [Dhond et al., 2007; Hui et al., 2005; Napadow et al., 2005]. Thus, similarity exists for brain response to acupuncture using block and er‐fMRI designs, with the latter having the added benefit of concurrent ANS response estimation, differentiation of multiple stimulus locations within the same run, and (potentially) greater ecological validity. While a direct comparison should be performed, our anecdotal observations suggest that er‐fMRI designs for acupuncture stimuli are more robust than block designs, particularly for long duration stimulus blocks, which are likely to involve varying sensation profiles over the needle stimulation period [Napadow et al., 2009].
Several limitations should be noted. First, while several different analysis models (i.e., correlation, difference maps) were used in our study, it is important to note that for all models, we can only determine a correlative, not causal, relationship, and not every variable can be controlled. For instance, stimuli that produce more somatosensation and somatosensory cortical response could also be more startling and hence more apt to produce HR+ rather than HR− response (as we found). Thus, we do not claim that somatosensory regions are, per se, control regions of HR response to acupuncture (unlikely), only that somatosensory activation is also related to ANS outflow. In addition, our imaging protocol was optimized for whole‐brain data acquisition. While we report very few results in brainstem nuclei, many premotor ANS nuclei lie in the brainstem (e.g., medulla). Brainstem focused neuroimaging approaches, which for example improve co‐registration for group analyses [Napadow et al., 2006], have been used to investigate acupuncture stimuli [Napadow et al., 2009], and future studies should adopt er‐fMRI designs to similar brainstem‐focused neuroimaging methods. In addition, our approach was focused on more short‐term phasic ANS and brain response to acupuncture and we needed to balance shorter ISIs to maximize events with longer ISIs to allow for adequate evolution of ANS response. While for mean ANS response, not all responses returned completely to baseline for the shortest ISI tested (8 s), and this is a limitation to the study, peak response was within our analysis window. Moreover, to probe if incomplete recovery affected subsequent SCR response, we correlated SCR response for event i, with the change in baseline used for event i versus i‐1. The correlation was r = –0.003—i.e., a potentially shifting baseline due to incomplete recovery did not affect subsequent SCR response amplitude. Finally, acupuncture has also been noted to produce longer‐term sustained, post‐stimulus effects [Dhond et al., 2008], and future studies should attempt to resolve the interaction between short‐ and long‐term physiological response patterns.
In conclusion, our approach allowed us to link ANS and fMRI response in order to infer potential control brain circuitry underlying different autonomic responses to acupuncture stimuli at different acupoints. Our results suggest that different sub‐regions of the brain circuitry responding to acupuncture appear to be associated with different ANS outflow responses to needle stimuli and may result from different sensations elicited by stimuli at different bodily locations. This study applied er‐fMRI to link brain and ANS response to acupuncture, and future studies should explore how this central autonomic network response to acupuncture influences clinical outcomes.
Supporting information
Supporting Information Table 1
Supporting Information Table 2
Supporting Information Table 3
Supporting Information Table 4
ACKNOWLEDGMENTS
The authors thank Dr. Scott Orr for helpful discussions linking our results with the psychophysiology literature. The content is solely the responsibility of the authors and does not necessarily represent the official views of our funding agencies.
REFERENCES
- Abad‐Alegria F, Pomaron C, et al. (2001): Objective assessment of the sympatholytic action of the Nei‐Kuan acupoint. Am J Chin Med 29:201–210. [DOI] [PubMed] [Google Scholar]
- Andersson S, Lundeberg T (1995): Acupuncture—From empiricism to science: Functional background to acupuncture effects in pain and disease. Med Hypotheses 45:271–281. [DOI] [PubMed] [Google Scholar]
- Backer M, Hammes MG, et al. (2002): Different modes of manual acupuncture stimulation differentially modulate cerebral blood flow velocity, arterial blood pressure and heart rate in human subjects. Neurosci Lett 333:203–206. [DOI] [PubMed] [Google Scholar]
- Bajaj P, Madsen H, et al. (2003): Endometriosis is associated with central sensitization: A psychophysical controlled study. J. Pain 4:372–380. [DOI] [PubMed] [Google Scholar]
- Beissner F, Henke C (2009): Methodological problems in fMRI studies on acupuncture: A critical review with special emphasis on visual and auditory cortex activations. Evid Based Complement Alternat Med 2011:1–7. [DOI] [PMC free article] [PubMed] [Google Scholar]
- Beissner F, Deichmann R, et al. (2012): Acupuncture—Deep pain with an autonomic dimension? Neuroimage 60:653–660. [DOI] [PubMed] [Google Scholar]
- Binks AP, Banzett RB, et al. (2007): An inexpensive, MRI compatible device to measure tidal volume from chest‐wall circumference. Physiol Meas 28:149–159. [DOI] [PubMed] [Google Scholar]
- Birn RM, Smith MA, et al. (2008): The respiration response function: The temporal dynamics of fMRI signal fluctuations related to changes in respiration. Neuroimage 40:644–654. [DOI] [PMC free article] [PubMed] [Google Scholar]
- Chang C, Cunningham JP, et al. (2009): Influence of heart rate on the BOLD signal: The cardiac response function. Neuroimage 44:857–869. [DOI] [PMC free article] [PubMed] [Google Scholar]
- Cheng X (1996):Chinese Acupuncture and Moxibustion.Beijing:Beijing Foreign Languages Press. [Google Scholar]
- Cook E, Turpin G (1997): Differentiating orienting, startle, and defense responses: The role of affect and its implications for psychopathology In: Lang P, Simons R, Balaban M, editors.Attention and Orienting: Sensory and Motivational Processes.Mahwah, NJ:Lawrence Erlbaum Associates Publishers. [Google Scholar]
- Cox RW (1996).AFNI: software for analysis and visualization of functional magnetic resonance neuroimages. Comput Biomed Res 29:162–173. [DOI] [PubMed] [Google Scholar]
- Critchley HD, Mathias CJ, et al. (2003).Human cingulate cortex and autonomic control: Converging neuroimaging and clinical evidence. Brain 126( Part 10):2139–2152. [DOI] [PubMed] [Google Scholar]
- Cummings M (2009): Modellvorhaben Akupunktur—A summary of the ART, ARC and GERAC trials. Acupunct Med 27:26–30. [DOI] [PubMed] [Google Scholar]
- Dale AM, Buckner RL (1997): Selective averaging of rapidly presented individual trials using fMRI. Hum Brain Mapp 5:329–340. [DOI] [PubMed] [Google Scholar]
- Dale AM, Fischl B, et al. (1999): Cortical surface‐based analysis. I. Segmentation and surface reconstruction. Neuroimage 9:179–194. [DOI] [PubMed] [Google Scholar]
- Dhond RP, Kettner N, et al. (2007): Neuroimaging acupuncture effects in the human brain. J Altern Complement Med 13:603–616. [DOI] [PubMed] [Google Scholar]
- Dhond RP, Yeh C, et al. (2008): Acupuncture modulates resting state connectivity in default and sensorimotor brain networks. Pain 136:407–418. [DOI] [PMC free article] [PubMed] [Google Scholar]
- Edwards RR, Grace E, et al. (2009): Sleep continuity and architecture: Associations with pain‐inhibitory processes in patients with temporomandibular joint disorder. Eur J Pain. [DOI] [PMC free article] [PubMed] [Google Scholar]
- Fahy BG (2010): Intraoperative and perioperative complications with a vagus nerve stimulation device. J Clin Anesthesia 22:213–222. [DOI] [PubMed] [Google Scholar]
- Glover GH, Li TQ, et al. (2000): Image‐based method for retrospective correction of physiological motion effects in fMRI: RETROICOR. Magn Reson Med 44:162–167. [DOI] [PubMed] [Google Scholar]
- Graham FK, Clifton RK (1966): Heart‐rate change as a component of the orienting response. Psychol Bull 65:305–320. [DOI] [PubMed] [Google Scholar]
- Gray MA, Minati L, et al. (2009): Physiological recordings: Basic concepts and implementation during functional magnetic resonance imaging. Neuroimage 47:1105–1115. [DOI] [PMC free article] [PubMed] [Google Scholar]
- Haker E, Egekvist H, et al. (2000): Effect of sensory stimulation (acupuncture) on sympathetic and parasympathetic activities in healthy subjects. J Auton Nerv Syst 79:52–59. [DOI] [PubMed] [Google Scholar]
- Harris RE, Zubieta JK, et al. (2009): Traditional Chinese acupuncture and placebo (Sham) acupuncture are differentiated by their effects on mu‐opioid receptors (MORs). Neuroimage. [DOI] [PMC free article] [PubMed] [Google Scholar]
- Hodes RL, Cook EWIII, et al. (1985): Individual differences in autonomic response: Conditioned association or conditioned fear? Psychophysiology 22:545–560. [DOI] [PubMed] [Google Scholar]
- Hopton A, MacPherson H (2010): Acupuncture for chronic pain: Is acupuncture more than an effective placebo? A systematic review of pooled data from meta‐analyses. Pain Practice: Official J World Inst Pain 10:94–102. [DOI] [PubMed] [Google Scholar]
- Hsu CC, Weng CS, et al. (2006): Effects of electrical acupuncture on acupoint BL15 evaluated in terms of heart rate variability, pulse rate variability and skin conductance response. Am J Chin Med 34:23–36. [DOI] [PubMed] [Google Scholar]
- Hui KK, Liu J, et al. (2005): The integrated response of the human cerebro‐cerebellar and limbic systems to acupuncture stimulation at ST 36 as evidenced by fMRI. Neuroimage 27:479–496. [DOI] [PubMed] [Google Scholar]
- Imai K, Kitakoji H (2003): Comparison of transient heart rate reduction associated with acupuncture stimulation in supine and sitting subjects. Acupunct Med 21:133–137. [DOI] [PubMed] [Google Scholar]
- Janig W (2006):The Integrative Action of the Autonomic Nervous System.Cambridge:Cambridge University Press. [Google Scholar]
- Kang OS, Chang DS, et al. (2011): Autonomic and subjective responses to real and sham acupuncture stimulation. Autonomic Neurosci: Basic Clin 159( 1‐2):127–130. [DOI] [PubMed] [Google Scholar]
- Knardahl S, Elam M, et al. (1998): Sympathetic nerve activity after acupuncture in humans. Pain 75:19–25. [DOI] [PubMed] [Google Scholar]
- Kong J, Gollub R, et al. (2007): Acupuncture de qi, from qualitative history to quantitative measurement. J Altern Complement Med 13:1059–1070. [DOI] [PubMed] [Google Scholar]
- Li P, Longhurst JC (2010): Neural mechanism of electroacupuncture's hypotensive effects. Autonomic Neurosci: Basic Clin 157( 1‐2):24–30. [DOI] [PMC free article] [PubMed] [Google Scholar]
- Morrison SF (2001): Differential control of sympathetic outflow. Am J physiol. Regulatory Integrat Compar Physiol 281:R683–R698. [DOI] [PubMed] [Google Scholar]
- Napadow V, Dhond R, et al. (2006): Automated brainstem co‐registration (ABC) for MRI. Neuroimage 32:1113–1119. [DOI] [PubMed] [Google Scholar]
- Napadow V, Makris N, et al. (2005): Effects of electroacupuncture versus manual acupuncture on the human brain as measured by fMRI. Hum Brain Mapp 24:193–205. [DOI] [PMC free article] [PubMed] [Google Scholar]
- Napadow V, Kettner N, et al. (2007): Hypothalamus and amygdala response to acupuncture stimuli in Carpal Tunnel Syndrome. Pain 130:254–266. [DOI] [PMC free article] [PubMed] [Google Scholar]
- Napadow V, Dhond R, et al. (2009): Time‐variant fMRI activity in the brainstem and higher structures in response to acupuncture. Neuroimage 47:289–301. [DOI] [PMC free article] [PubMed] [Google Scholar]
- Napadow V, Dhond RP, et al. (2009): Brain encoding of acupuncture sensation—Coupling on‐line rating with fMRI. Neuroimage 47:1055–1065. [DOI] [PMC free article] [PubMed] [Google Scholar]
- Naqvi N, Bechara A (2006): Skin conductance: A Psychophysiological Approach to the Study of Decision Making In Senior C., Russell T. and Gazzaniga M. (Eds.), Methods in Mind: Cambridge, MA, The MIT Press, 103–122. [Google Scholar]
- Nishijo K, Mori H, et al. (1997): Decreased heart rate by acupuncture stimulation in humans via facilitation of cardiac vagal activity and suppression of cardiac sympathetic nerve. Neurosci Lett 227:165–168. [DOI] [PubMed] [Google Scholar]
- Ohashi T, Fujimoto M, et al. (1994): [A case of isolated vagus nerve palsy with herpes zoster]. Rinsho shinkeigaku = Clin Neurol 34:928–929. [PubMed] [Google Scholar]
- Ohman A, Hamm A, et al. (2007): Cognition and the autonomic nervous system: Orienting, anticipation, and conditioning In: Cacciopo JT, Tassinary LG, Bernston GG.Handbook of Psychophysiology.Cambridge:Cambridge University Press; pp533–575. [Google Scholar]
- Oke SL, Tracey KJ (2009): The inflammatory reflex and the role of complementary and alternative medical therapies. Ann NY Acad Sci 1172:172–180. [DOI] [PMC free article] [PubMed] [Google Scholar]
- Oldfield RC (1971): The assessment and analysis of handedness: The Edinburgh inventory. Neuropsychologia 9:97–113. [DOI] [PubMed] [Google Scholar]
- Pasricha PJ, Colvin R, et al. (2011): Characteristics of patients with chronic unexplained nausea and vomiting and normal gastric emptying. Clin Gastroenterol Hepatol: Official Clin Practice J Am Gastroenterological Assoc 9:567–576e564. [DOI] [PMC free article] [PubMed] [Google Scholar]
- Pavlov I (1927):Conditioned Reflexes: An Investigation of the Physiological Activity of the Cerebral Cortex.Oxford:Oxford University Press. [DOI] [PMC free article] [PubMed] [Google Scholar]
- Peng CK, Henry IC, et al. (2004): Heart rate dynamics during three forms of meditation. Int J Cardiol 95:19–27. [DOI] [PubMed] [Google Scholar]
- Piche M, Arsenault M, et al. (2010): Dissection of perceptual, motor and autonomic components of brain activity evoked by noxious stimulation. Pain 149:453–462. [DOI] [PubMed] [Google Scholar]
- Porges SW (2007): The polyvagal perspective. Biol Psychol 74:116–143. [DOI] [PMC free article] [PubMed] [Google Scholar]
- Smith SM, Jenkinson M, et al. (2004): Advances in functional and structural MR image analysis and implementation as FSL. Neuroimage 23( Suppl 1):S208–S219. [DOI] [PubMed] [Google Scholar]
- Sokolov E (1963):Perception and the Conditioned Reflex. Oxford, U.K.:Pergamon Press. [Google Scholar]
- Sokolov E, Cacioppo J (1997): Orienting and defense reflexes: Vector coding and cardiac response In: Lang P, Simons R, Balaban M, editors.Attention and Orienting: Sensory and Motivational Processes.Mahwah, NJ:Lawrence ErlbaumAssociates Publishers. [Google Scholar]
- Sparrow K (2007): Analysis of heart rate variability in acupuncture practice: Can it improve outcomes? Med Acupuncture 19:37–41. [Google Scholar]
- Stelmack RM, Siddle DA (1982): Pupillary dilation as an index of the orienting reflex. Psychophysiology 19:706–708. [DOI] [PubMed] [Google Scholar]
- Stern R, Koch K, et al. (2011):Nausea: Mechanisms and Management.New York:Oxford University Press. [Google Scholar]
- Sugiyama Y, Xue YX, et al. (1995): Transient increase in human muscle sympathetic nerve activity during manual acupuncture. Jpn J Physiol 45:337–345. [DOI] [PubMed] [Google Scholar]
- Thesen S, Heid O, et al. (2000): Prospective acquisition correction for head motion with image‐based tracking for real‐time fMRI. Magn Reson Med 44:457–465. [DOI] [PubMed] [Google Scholar]
- Tillisch K, Labus JS (2011): Advances in imaging the brain‐gut axis: Functional gastrointestinal disorders. Gastroenterology 140:407–411e401. [DOI] [PMC free article] [PubMed] [Google Scholar]
- Turpin G (1986): Effects of stimulus intensity on autonomic responding: The problem of differentiating orienting and defense reflexes. Psychophysiology 23:1–14. [DOI] [PubMed] [Google Scholar]
- Turpin G, Schaefer F, et al. (1999): Effects of stimulus intensity, risetime, and duration on autonomic and behavioral responding: Implications for the differentiation of orienting, startle, and defense responses. Psychophysiology 36:453–463. [PubMed] [Google Scholar]
- Uno A, Takeda N, et al. (2000): Effects of vestibular cerebellum lesion on motion sickness in rats. Acta oto‐laryngologica 120:386–389. [DOI] [PubMed] [Google Scholar]
- Wang JD, Kuo TB, et al. (2002): An alternative method to enhance vagal activities and suppress sympathetic activities in humans. Auton Neurosci 100( 1‐2):90–95. [DOI] [PubMed] [Google Scholar]
- Williams LM, Brammer MJ, et al. (2000): The neural correlates of orienting: An integration of fMRI and skin conductance orienting. Neuroreport 11:3011–3015. [DOI] [PubMed] [Google Scholar]
- Williams LM, Felmingham K, et al. (2007): Mapping frontal‐limbic correlates of orienting to change detection. Neuroreport 18:197–202. [DOI] [PubMed] [Google Scholar]
- Xiong J, Xue FS, et al. (2009): Transcutaneous vagus nerve stimulation may attenuate postoperative cognitive dysfunction in elderly patients. Med Hypotheses 73:938–941. [DOI] [PubMed] [Google Scholar]
- Yao T (1993): Acupuncture and somatic nerve stimulation, mechanism underlying effects on cardiovascular and renal activities. Scand J Rehabil Med 29:7–18. [PubMed] [Google Scholar]
Associated Data
This section collects any data citations, data availability statements, or supplementary materials included in this article.
Supplementary Materials
Supporting Information Table 1
Supporting Information Table 2
Supporting Information Table 3
Supporting Information Table 4