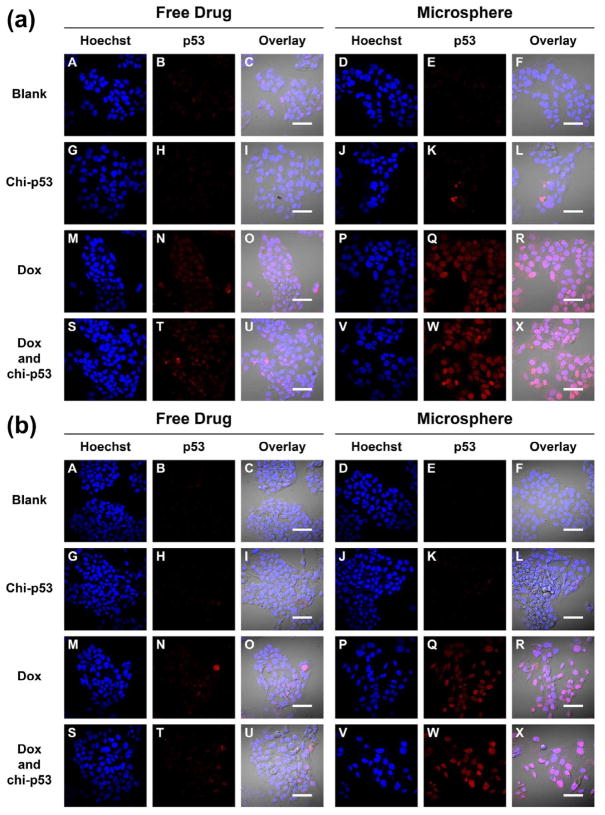
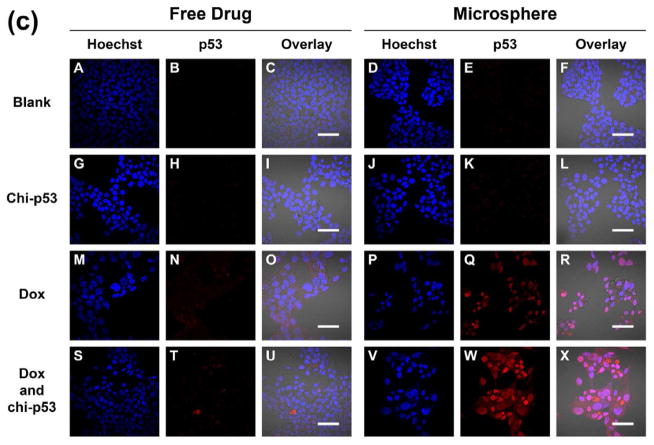
Figure 10.
Immunofluorescence staining of p53 in HepG2 cells at (a) one day, (b) three days, and (c) five days after commencement of treatment. The groups include blank and free drug groups as well as blank and drug loaded microsphere groups. The cell nuclei were stained by Hoechst dye and indicated in blue. The p53 was stained by DyLight™ 549 dye and indicated in red. Scale bar = 50 μm.


