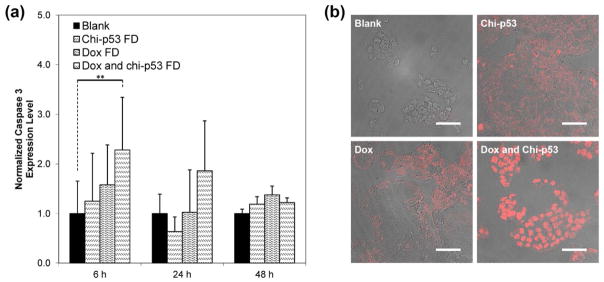
Figure 5.

(a) Expression of caspase 3 in HepG2 cells at 6, 24 and 48 h after commencement of treatment. The cells were either untreated or treated with Dox FD (IC50, 2 μg/ml) and/or chi-p53 FD (0.2 μg DNA). The absorbance values were normalized to cell number, followed by normalizing to the control group. Data represent mean ± standard deviation, n = 5. Statistical significance (**p < 0.05) was determined by Student’s t-test comparison between the two samples. (b) Immunofluorescence staining of caspase 3 in HepG2 cells at 6 h after commencement of treatment. Scale bar = 50 μm.
