

Abstract
Alcohol, a major cause of human cardiomyopathy, decreases cardiac contractility in both animals and man. However, key features of alcohol-related human heart disease are not consistently reproduced in animal models. Accordingly, we studied cardiac histology, contractile function, cardiomyocyte long chain fatty acid (LCFA) uptake, and gene expression in male C57BL/6J mice consuming 0, 10, 14, or 18% ethanol in drinking water for 3 months. At sacrifice, all EtOH groups had mildly decreased body and increased heart weights, dose-dependent increases in cardiac triglycerides and a marked increase in cardiac fatty acid ethyl esters. [3H]-oleic acid uptake kinetics demonstrated increased facilitated cardiomyocyte LCFA uptake, associated with increased expression of genes encoding the LCFA transporters CD36 and Slc27a1 (FATP1) in EtOH-fed animals. Although SCD-1 expression was increased, lipidomic analysis did not indicate significantly increased de novo LCFA synthesis. By echocardiography, ejection fraction (EF) and the related fractional shortening (FS) of left ventricular diameter during systole were reduced and negatively correlated with cardiac triglycerides. Expression of myocardial PGC-1α and multiple downstream target genes in the oxidative phosphorylation pathway, including several in the electron transport and ATP synthase complexes of the inner mitochondrial membrane, were down-regulated. Cardiac ATP was correspondingly reduced. The data suggest that decreased expression of PGC-1α and its target genes result in decreased cardiac ATP levels, which may explain the decrease in myocardial contractile function caused by chronic EtOH intake. This model recapitulates important features of human alcoholic cardiomyopathy and illustrates a potentially important pathophysiologic link between cardiac lipid metabolism and function.
Keywords: ethanol consumption, lipid accumulation, fatty acid transport, PGC-1α, cardiac function, ATP, gene expression
Introduction
Excessive chronic alcohol ingestion causes both histopathologic and functional changes in multiple organs, especially in the liver, heart, and pancreas, and can result in serious or even fatal illness. Chronic, excessive alcohol consumption has been reported to be the most frequent identifiable cause of heart muscle disease [1], and has been shown to decrease the contractility of heart muscle in both animals and humans [2]. Its classical clinical cardiac consequence is a dilated cardiomyopathy, which can lead to congestive heart failure and even to death. However, key features of human heart disease caused by chronic alcohol intake, including congestive heart failure, are not reproducibly recapitulated in animal models [2]. Chronic alcohol ingestion, for example, has not heretofore been reported to produce a cardiomyopathy in wild type mice.
Many cellular and molecular mechanisms of injury have been proposed as the basis for alcoholic cardiomyopathy, including apoptosis [3], mitochondrial dysfunction [4], acetaldehyde protein adduct formation [5], oxidant stress [6-8], and imbalance between protein catabolism and protein synthesis [8-10]. However, intervening steps between exposure of cardiac muscle to ethanol (EtOH) and initiation of the cascade of responses leading to decreased cardiac contractility and output remain poorly understood.
Long chain fatty acids (LCFA), a key cardiac energy source, are taken up by cardiomyocytes via facilitated transport mechanisms [11-15] and either utilized rapidly for β-oxidation in mitochondria or reesterified and stored as cytosolic triglycerides (TG). In well-fed animals this usually does not involve formation of obvious lipid droplets detectable by light microscopy, however such droplets may be seen in otherwise healthy animals after a prolonged fast [16, 17]. While TG accumulation in cardiomyocytes in alcoholic cardiomyopathy has been described in both patients and some animal models [18], this report is the first description and functional characterization of an alcohol-induced cardiomyopathy in wild-type, genetically unmodified mice. As such, it provides a valuable model for additional, future investigations.
Our laboratory has long had an interest in LCFA transport mechanisms [19, 20] and their roles in the pathogenesis of disease states such as obesity [21-23] and its co-morbidities, such as hepatic steatosis [24] and obesity-associated cardiomyopathy [25]. Increased facilitated LCFA uptake was found to be a key process responsible for hepatic steatosis both in mouse models of obesity and in the presence of chronic EtOH consumption [24]. LCFA uptake is also important in the development of obesity-associated cardiomyopathy in mice [25]. In the present studies we applied kinetic methods developed to quantify cellular LCFA uptake in these earlier studies to cardiomyocytes from chronically EtOH-fed mice, used gene expression methods to examine the effects of EtOH on other putative mechanisms which could contribute to TG accumulation, and examined quantitative relationships among EtOH intake, cardiomyocyte LCFA uptake, TG accumulation, and cardiac function. The results suggest that increased facilitated LCFA uptake is a major contributing factor to the increased myocardial lipid accumulation that occurs with chronic EtOH consumption, and suggest possible ways by which this could lead to decreased cardiac function.
Materials and Methods
Mice and diet
Six-week-old male C57BL/6J mice, purchased from Jackson Laboratories (Bar Harbor, ME), were maintained in a temperature-controlled facility with a 12-h light: dark cycle, with free access to water and to a standard chow diet (LabDiet 5001, PMI, St. Louis, MO). After a two week acclimatization period, the control and EtOH groups were created by random separation of mice from the same lot. EtOH at 10% (v/v) was provided in the drinking water as the sole water source for the first 4 weeks for all mice designated for EtOH feeding. In a randomly selected subset of these animals 10% EtOH was replaced with 14% EtOH after 4 weeks (E14 group), and in a subset of these, 14% EtOH was replaced with 18 % EtOH after a further 4 weeks (E18). Age-matched controls were given the same distilled water as that used for mixing the EtOH solutions. Mice were sacrificed after a total of 12 ± 1 wks of treatment. Thus, out of the 12-week EtOH feeding period, the E10 group received 10% EtOH for the full 12 weeks, those designated as E14 received that dose for 8 weeks, and those designated as E18 EtOH received that dose for 4 weeks. This protocol was necessitated by the fact that C57BL/6J mice will initially drink EtOH consistently only at concentrations of ≤10%. After 4 weeks on a 10% regimen they will readily consume 14% EtOH, and after 4 weeks at that concentration, they can be switched successfully to 18% EtOH. In short, a conditioning period was needed to successfully achieve each increment in EtOH consumption. Given these gustatory preferences of the mice, there was no way to design a study in which duration of EtOH intake was equivalent at each of the 3 EtOH doses.
Metabolic cages were not available for this study. Animals were housed individually in standard plastic cages. Weights were recorded weekly, as was consumption of water or water/EtOH and food, until the final week before sacrifice when they were measured daily. The daily measurements of both food and water or water:EtOH consumption were highly reproducible both in individual animals and within treatment groups, as indicated by the standard errors recorded in Table 2. During that final week the blood alcohol concentration (BAC) was measured in plasma separated from tail vein blood samples obtained between midnight and 1 AM, using a NAD-alcohol dehydrogenase reagent (Sigma-Aldrich, St Louis, MO), as previously described [26]. Mice were euthanized at 20 ± 1 wks of age after an overnight (12 hr) fast. All applicable institutional and governmental regulations concerning ethical use of animals were followed during this research. All animal procedures were approved by the Institutional Animal Care and Use Committee (IACUC) of Columbia University Medical Center.
Table 2. Ethanol and Calorie Consumption, Histologic Oil Red O Lipid Score, and Lipid Droplet Size.
| Group | EtOH Consumption/Mouse | Caloric Intake (Kcal/day/mouse) | ORO Score | Droplet Diameter (nm) | |||
|---|---|---|---|---|---|---|---|
| (mL/day) | (mL/lifetime) | Food | EtOH | Total | |||
| Control | 0 | 0 | 12.28 ± 1.540 | 0 | 12.28 ± 1.540 | 0.6 ± 0.13 | 0 |
| 10% EtOH | 0.43 ± 0.020‡,# | 36.12 ± 1.68‡,# | 9.824 ± 0.614 | 3.01 ± 0.140‡‡,¥ | 12.834 ± 0.630 | 0.909 ± 0.16€,# | 570.75 ± 100.734**,†,# |
| 14% EtOH | 0.56 ± 0.028‡,€ | 47.04 ± 2.35‡,€ | 9.517 ± 0.614 | 3.92 ± 0.196‡‡,€ | 13.437 ± 0.645 | 2.3 ± 0.26** | 878.00 ± 63.494**,† |
| 18% EtOH | 0.88 ± 0.108€,# | 74.09 ± 9.07€,# | 10.438 ± 1.228 | 4.802 ± 0.588€,¥ | 15.24 ± 1.362 | 2.529 ± 024**,€, # | 992.75 ± 52.634**,# |
Post-hoc t-test's: vs Control group:
p < 0.05,
p < 0.01;
10% EtOH vs 14% EtOH:
p < 0.05,
p < 0.01,
p < 0.001
10% EtOH vs 18% EtOH:
p < .05,
p < 0.01,
p < 0.005;
14% EtOH vs 1% EtOH:
p < 0.05,
p < 0.01
Tissue harvesting and determination of cardiac tissue triglyceride and cholesterol
At sacrifice hearts were removed and weighed. Portions of each were placed in neutral buffered formalin for hematoxylin and eosin (H&E) staining; or embedded in OCT compound (Tissue-Tek, Sakura Finetek USA, Inc., Torrance, CA), frozen on dry ice and stored at -80°C for future oil red O (ORO) staining. The remainder was fixed in glutaraldehyde for electron microscopy (see below), preserved in RNAlater (Qiagen, Carlsbad, CA) at -80°C for subsequent qRT-PCR studies, or weighed and homogenized in PBS for biochemical studies. The total tissue protein content was determined from the homogenate with the BCA™ protein analysis kit (Thermo Scientific, Rockford, IL ), and triglyceride and cholesterol contents were determined, after Folch extraction, with Wako kits (Cholesterol E and L-Type TG H) according to the manufacturer's instructions.
Blood and serum analysis
Whole blood glucose was measured with a glucose meter (One-Touch, LifeScan, Inc., Milpitas, CA) in tail vein samples obtained before induction of anesthesia. The concentrations of serum free fatty acids, triglycerides (TG), total cholesterol, ALT and AST were measured on blood samples obtained from the inferior vena cava during anesthesia, using commercial kits as previously reported [24, 25].
Lipid analyses
In addition to the kit assays used for serum free fatty acids and TG, noted above, high-sensitivity liquid chromatography/tandem mass spectrometry (LC/MS/MS) and liquid chromatography/mass spectrometry (LC/MS) were used to study the cardiac content of selected lipids of interest in the hearts of both control and 18% EtOH-fed mice. The methods for tissue handling, sample preparation and LC/MS/MS or LC/MS employed in this study were identical to those reported previously in an analogous study of EtOH-induced fatty liver [26]. By using specific internal standards, this method allows the quantification of 62 defined lipid species. The results presented below focus on specific intermediates of LCFA metabolism. A report on the effects of EtOH on the total myocardial lipidome will be published separately.
Cardiac ATP Assay
For the analysis of ATP concentrations, hearts were removed immediately after sacrifice and quickly frozen in liquid nitrogen. Cardiac tissue samples (20 mg) were subsequently homogenized in 10 volumes of 0.25% trichloroacetic acid/2 mM EDTA using 1.0 mm Zirconia/Silica beads (BioSpec Products). Homogenates were spun at 4500 rpm for 10 min at 4°C. The supernatant was diluted 1:10 with 250 mM Tricine buffer, pH 7.8, 50 mM MgSO4, 1 mM EDTA and 1 mM sodium azide. ATP concentrations in the diluted supernatants were determined using a firefly luciferease bioluminescence based ATP assay kit (Invitrogen) [27], following the manufacturer's instructions. Corresponding protein concentrations were determined with the BCA™ protein assay kit.
Histologic Estimation of tissue neutral lipids
Histological images of oil red O (ORO)-stained cardiac sections were observed at 250× with a Nikon Eclipse 80i microscope and captured with a Nikon Digital DXM 1200C camera using standard exposure settings for all photographs. Semi-quantitative estimates of neutral lipids in these sections from each mouse were performed by two independent observers (FG, PDB) who were blinded to the experimental protocol, and who graded the lipid content from 1-4 using previously published criteria [25]. An average score for each mouse was calculated from the scores of the two observers. For the 70 samples analyzed in this study the mean difference in lipid scores between observers was 0.11 ± 0.05 (SE) points. The slope of the regression line between the two sets of scores was 0.96 (r = 0.94, p<0.001).
Transmission Electron Microscopy
Hearts were fixed with 2.5% glutaraldehyde in 0.1 M Sorenson's buffer (0.1 M H2PO4, 0.1M HPO4, pH 7.2) overnight, post-fixed with1% OsO4 in 0.1 M Sorenson's buffer for 1 h. En block staining with 1% tannic acid in water was followed by washing and staining with 1% uranyl acetate [28]. After embedding with Lx-112 (Ladd Research Industries, Inc, Williston, VT, USA), sections (60 nm thick) were cut on an MT-7000 RMC Ultramicrotome, mounted on mesh copper grids (Electron Microscope Sciences, Hatfield, PA), stained with 1% uranyl acetate and 0.4% lead citrate. Transmission electron microscopy was performed on a JEOL JEM-1200.
Cardiac function analysis by 2-D echocardiography
Echocardiography was performed in mice anesthetized with 1.5-2% isofluorane with a Vevo770 (VisualSonics, Toronto, Canada) small animal instrument, using a single-element mechanical transducer with a center frequency of 30 MHz, as previously described [25]. In M-mode short-axis images, anterior and posterior wall thicknesses (AW, PW) and LV end diastolic and systolic dimensions (LVEDD, LVESD) were measured at the mid papillary muscle level. LV fractional shortening (%FS), ejection fraction (EF), and LV mass (LVM) were then calculated [25].
Cardiomyocyte Isolation
Ventricular cardiomyocytes were isolated from 20-week-old mouse hearts with collagenase digestion, using a modification of a procedure initially described in rats [29] but more recently reported in detail for use in mice [25]. Pooled cardiomyocytes from several mice were harvested, re-suspended in 0.1% BSA:HBSS buffer at a cell concentration of 1.5 × 10⁶/ml, and used for oleic acid uptake studies, as described below.
Fatty Acid Uptake
Aliquots of cardiomyocyte suspensions were incubated at 37°C in HBSS medium containing 500 μM BSA with one of 5 different concentrations of [3H]-oleic acid (OA), producing oleic acid: BSA molar ratios (v) of 0.25:1 to 2.5:1. The unbound oleic acid concentration in each test solution, determined by the value of v [11], ranged from 18 to 420 nM. The initial velocity of cellular OA uptake from each test solution was determined by a standard, rapid filtration technique which has been well established in our laboratory [11, 30-32]. Based on prior studies with multiple cell types, the kinetic constants of LCFA uptake (Vmax and Km for the saturable, facilitated uptake component, and rate constant k for the non-saturable component) were derived by fitting the uptake data to the sum of saturable and nonsaturable functions of the unbound fatty acid concentration [19, 21-23, 32, 33]. Data fitting was accomplished using the Simulation Analysis and Modeling II (SAAMII) program [34, 35].
Total RNA extraction, isolation and real-time PCR analysis
Total RNA was extracted from mouse hearts using QIAamp RNA Mini Kits (QiagenInc, Valencia, CA) according to manufacturer's protocol and used to assay the expression of a total of 25 genes in the heart related to fatty acid transport (Got2, Slc27a1, Slc27a6 and CD36), fatty acid synthesis (Scd1, Fasn), VLDL synthesis and export (Apob, Mttp), TG mobilization (Lpl, Ldl-R), LCFA β-Oxidation (Cpt1, Dci), triglyceride synthesis (Dgat1, Dgat2), oxidative phosphorylation (10 genes) and peroxisome proliferator-activated receptor-γ coactivator-1α (PGC-1α) . Details of the methods and the sequences of the PCR primers used for these studies have been previously reported [24].
Statistical Analysis
All results are expressed as mean ± SE, with n≥5. Single comparisons, e.g. of an experimental group with the control group, were examined with two-tailed Student's t-tests, with statistical significance set at p≤0.05. For the parameters reported in the tables, each of the three experimental groups was compared to the control group (principal goal, three comparisons). The three experimental groups were also compared with each other (secondary goal, three more comparisons). Statistical significance was again set at p≤0.05. Analysis was by one way ANOVA, followed by post hoc t-tests, using the pooled standard deviation in computing standard errors of group differences. Application of the Bonferroni correction would have required setting the limit of significance at 0.0083 (0.05 ÷ 6), based on the number of intergroup comparisons. This was unachievable given the numbers of animals per group. We have therefore simply reported the p values for these post hoc tests in the Table legends. Any value that is below the Bonferroni-corrected value of 0.0083 can be taken as definitively significant, whereas other values (0.05 > P > 0.0083) can be considered only as exploratory or suggestive.
Results
Body and Heart Weights and Serum Biochemical Tests
The mean age of the mice at sacrifice was 139 ± 1 days, and was equivalent in all four groups. As previously reported in these animals [24], the C57BL/6J control mice weighed 26.7 ± 0.34 g at sacrifice. Mean weights of the groups consuming 10%, 14%, and 18% EtOH (E10, E14, & E18, respectively) were all less than those of the controls, significantly so in the E14 (p<0.01) and E18 (p<0.05) groups (Table 1).
Table 1. Body Weight, Heart Weight and Cardiac Lipid Content.
| Body Weight (g) | Heart Weight (g) | Heart Weight/Body Weight Ratio (%) | Heart Triglycerides (mg) | Heart Cholesterol (mg) | |
|---|---|---|---|---|---|
| Control | 26.73 ± 0.29 | 0.126 ± 0.002 | 0.47 ± 0.01 | 0.93 ± 0.17 | 0.79 ± 0.05 |
| 10% EtOH | 26.39 ± 0.46 ‡ | 0.143 ± 0.0047 * | 0.54 ± 0.02 | 1.04 ± 0.23 | 0.73 ± 0.19 |
| 14% EtOH | 24.3 ± 0.49 **‡ | 0.136 ± 0.006 | 0.56 ± 0.03 | 1.21 ± 0.19 | 0.62 ± 0.09 |
| 18% EtOH | 25.51 ± 0.51 * | 0.133 ± 0.005 | 0.52 ± 0.02 | 1.23 ± 0.19 | 0.52 ± 0.19 |
P < 0.05
P < 0.01 vs the Control group
P < 0.01 (10% EtOH vs 14% EtOH)
In contrast to the body weights, mean heart weights of all 3 EtOH groups were marginally heavier than those of the controls (Table 1). However, only the difference between the E10 group and the controls was statistically significant by either of the procedures described above in Statistical Analysis, and none of the differences in heart weight among the EtOH-treated groups were significant using the ANOVA procedure. Nevertheless, due to the reductions in body weight in all of the EtOH groups, the heart weight-to-body weight ratio was significantly increased in all EtOH groups. While normalizing heart weights against tibia length rather than body weight may improve the comparability of data from animals of different ages, genders or strains, our studies were all conducted in male C57BL/6J mice fed EtOH for a standardized period of time and sacrificed as non-growing adults at an identical age. Under these circumstances, measurements of tibia length in earlier studies by our laboratories have shown the results at sacrifice to be virtually identical within the study cohort, and to add little to the comparability of heart weight data within a given study. In a recently published study [36], EtOH administration to wild type (WT) C57BL/6J mice had virtually no effect on tibial length, and consequently the authors normalized such parameters as LV mass by body weight, even though tibial length data were available.
Cardiac TG increased modestly but progressively in the E10, E14and E18 groups, whereas the total cardiac cholesterol decreased (Table 1).
Detailed values for multiple other biochemical parameters of interest will be found in a prior publication dealing with the pathogenesis of hepatic steatosis in the same animals [24]. Briefly, blood glucose and serum cholesterol were not significantly affected by EtOH feeding. However, serum insulin, and hence the homeostasis model assessment of insulin resistance (HOMA-IR), calculated as previously described in mice [37], were both increased by EtOH in a dose-dependent fashion. Leptin and adiponectin concentrations were also increased by EtOH. Serum TG was increased in the EtOH-fed mice, but the increase was statistically significant only in the E18 group. Neither AST nor ALT were increased by EtOH feeding in the present studies. Serum fatty acid results are presented below.
Caloric Intake, Alcohol Consumption, and Blood Alcohol Concentration
Blood alcohol concentrations at sacrifice ranged from undetectable in the controls to 0.27 ± 0.073 % in the E18 group (p<0.001). Daily EtOH intake and cumulative EtOH consumption over the 3 months of EtOH feeding increased significantly with each stepwise increase in the concentration of EtOH offered (Table 2). The caloric intake from EtOH increased progressively and significantly between the 10%, 14% and 18% EtOH-fed mice, but was largely offset by a corresponding decrease in intake of food calories. In consequence, although there was a trend toward higher total caloric intakes in the EtOH groups, in none of these groups did daily total caloric intake significantly exceed that in the control animals (Table 2).
Cardiac Histology and Lipid Content
Intra-myocardial lipid accumulation in the form of small droplets was found in all EtOH groups as seen in both ORO stained and transmission electron microscopic images. In ORO-stained sections, only a limited number of tiny lipid droplets were seen in control hearts. Both the size and number of the lipid droplets increased in all EtOH groups in a dose-dependent fashion (Figure 1A, B, C, D). Consequently, the histologic grade of lipid accumulation, a semi-quantitative measure of cardiac lipid content, increased progressively in the E10, E14 and E18 groups compared to the controls (Table 2). The accumulation of lipid droplets in the hearts of EtOH-fed mice, almost invariably in direct contact with mitochondria, was also clearly observed in transmission electron microscopic images (Figure 1E, F, G, H). The mean diameter of the lipid droplets increased progressively with the administered EtOH concentration (Table 2). Although proportional increases in the ORO score and lipid droplet diameter were greater than that in cardiac TGs, both the ORO score (r = 0.9813) and lipid droplet diameter (r = 0.9915) were significantly correlated with the cardiac TG content.
Figure 1. Cardiac histology.
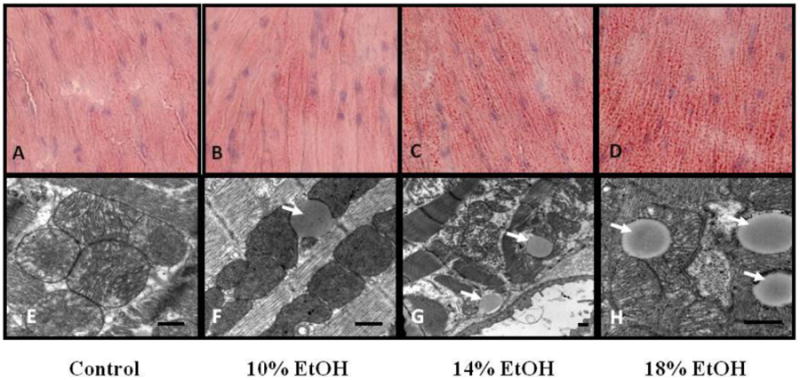
Lipid Staining Representative Oil-Red-O-(ORO-) stained sections of hearts from (A) control, (B) 10%, (C) 14% and (D) 18% EtOH-fed mice. A small number of tiny lipid droplets were seen in control hearts. Both size and number increased in all EtOH groups in dose-dependent fashion. Transmission electron microscopy. Images of (E) control, (F) 10%, (G) 14% and (H) 18% EtOH-fed mice. Lipid droplets (arrows) were clearly observed in direct contact with mitochondria in the all EtOH groups. The scale bar indicates 500nm.
Effect of EtOH on cardiac function
Representative echocardiograms are presented in Figure 2A, and data derived from them in Table 3. The LVESD increased in parallel with increasing concentrations of administered EtOH; however, no significant changes were observed in the LVEDD (Table 3). Greater EtOH administration was also associated with decreases in EF and FS (%) (Figure 2B). EF and FS (%) were highly negatively correlated both with cumulative lifetime alcohol intake (r = -0.9772 & r = -0.9747 respectively) and with heart TG content (r = -0.8960 & r = -0.8854).
Figure 2. Echocardiographic results.
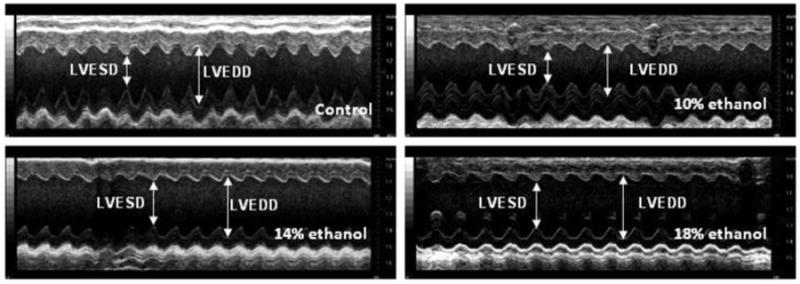
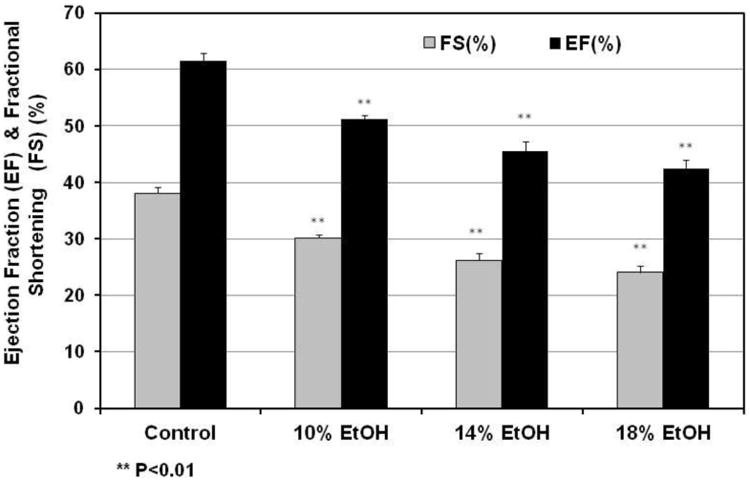
(A) M-mode image of the left ventricle in the parasternal short-axis view, showing depth markers. LVEDD: left ventricular end-diastolic diameter. LVESD: left ventricular end-systolic diameter. (B) Fractional shortening (FS) of the left ventricle between the contracted and relaxed states and ejection fraction (EF) were calculated from measurements made during the cardiac cycle. Both FS and EF were decreased progressively with increasing EtOH dose in all EtOH groups. ** p< 0.01, compared with the control group.
Table 3. Echocardiographic Results in Control and Ethanol-Fed Mice.
| Group | Heart Rate (bpm) | AW¹ (mm) | PW (mm) | LVEDD (mm) | LVESD (mm) | LVM | EF (%) | FS (%) |
|---|---|---|---|---|---|---|---|---|
| Control | 456 ± 52 | 0.73 ± 0.02 | 0.72 ± 0.06 | 4.03 ± 0.08 | 2.50 ± 0.08 | 81.49 ± 2.91 | 61.52 ± 1.38 | 38.04 ± 1.08 |
| 10% EtOH | 445 ± 15 | 0.77 ± 0.02 | 0.72 ± 0.02 | 4.06 ± 0.09 | 2.84 ± 0.09* | 86.88 ± 3.08 | 51.12 ± 1.64**†§§ | 30.12 ± 1.19**†§§ |
| 14% EtOH | 449 ± 11 | 0.74 ± 0.02 | 0.73 ± 0.02 | 4.13 ± 0.08 | 3.05 ± 0.1** | 81.96 ± 2.35 | 45.52 ± 1.61**† | 26.24 ± 1.13**† |
| 18% EtOH | 474 ± 15 | 0.76 ± 0.01 | 0.70 ± 0.01 | 3.97 ± 0.06 | 3.02 ± 0.08** | 88.57 ± 3.4 | 42.34 ± 1.35**§§ | 24.07 ± 0.91**§§ |
AW, PW: anterior and posterior wall thicknesses; LVEDD, LVESD: LV end diastolic and end systolic dimensions; LVM: left ventricular mass; EF, ejection fraction; FS, LV fractional shortening.
P < 0.05,
P < 0.01 vs the Control group
P < 0.05(10% EtOH vs 14% EtOH)
P < 0.01 (10% EtOH vs 18% EtOH)
Cardiomyocyte fatty acid uptake kinetics
Cardiomyocyte LCFA uptake in EtOH-fed mice increased in dose-dependent fashion compared to that in controls. Average uptake curves for each group, generated by computer from mean values for the experimentally determined kinetic parameters using the SAAM software [34, 35], are illustrated in Figure 3A. Facilitated LCFA uptake in particular was accelerated in the presence of EtOH, with the Vmax increasing exponentially from 1.98 ± 0.38 pmol/sec/50,000 cells in control mice to 8.28 ± 1.54 pmol/sec/50,000 cells in cells from 18% EtOH-fed mice (p<0.001 vs control in 14% and 18% EtOH-fed mice) (Figure 3B). Furthermore, Vmax was highly correlated with the heart TG content (r = 0.9581) (Figure 3C).
Figure 3. LCFA uptake kinetics.
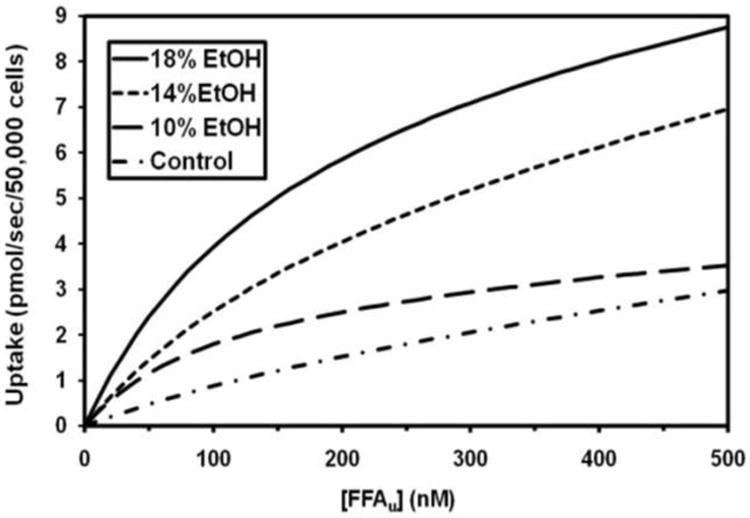
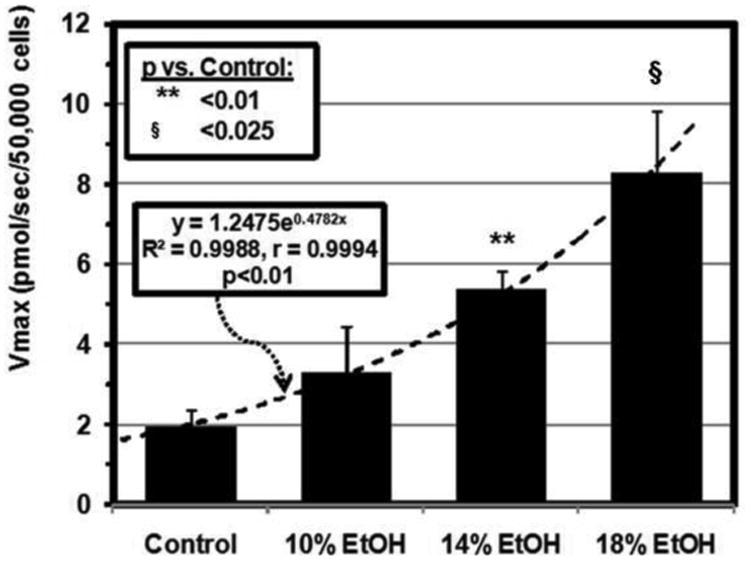
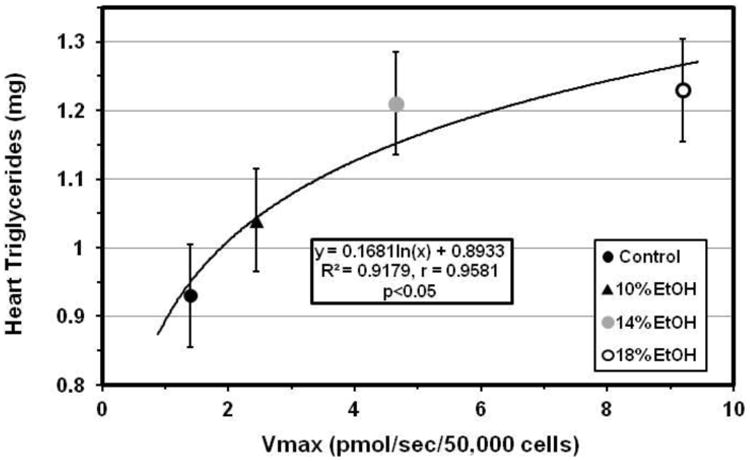
(A) [3H]-oleic acid uptake curves for cardiomyocytes from control, 10, 14 and 18% EtOH mice. Depicted are the average curves for each group, computed from group mean values for the kinetic parameters for saturable and non-saturable uptake (see text). (B) Vmax for facilitated cardiomyocyte LCFA uptake, calculated from the individual uptake curves, was increased in all EtOH groups compared with the control group. Bars represent mean ± SE. (C) Vmax was highly correlated with cardiac TG content across all groups studied.
Gene expression analysis
Expression of the Cd36 and Slc27a1 genes, encoding critical LCFA transport proteins in cardiomyocytes, each increased in the hearts of one or more of the EtOH groups (Figure 4A). Although CD36 expression in the E10 group did not differ significantly from controls, this is most likely a statistical aberration rather than a biological phenomenon, as up-regulation of cardiac CD36 across all experimental groups was significantly correlated with the increasing Vmax for facilitated LCFA uptake (Figure 4B). CD36 expression was previously found to be similarly correlated with the Vmax for cardiomyocyte LCFA uptake in the hearts of mice with high fat diet induced obesity, ob/ob and db/db mice [25], and in the livers of mice with EtOH-associated hepatic steatosis [24]. Surprisingly, expression of the genes for Got2 and Slc27a6, two other cardiac LCFA transporters, was decreased by EtOH.
Figure 4.
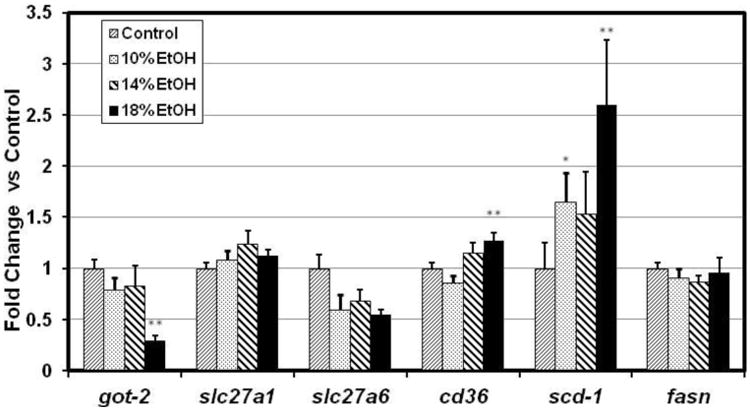
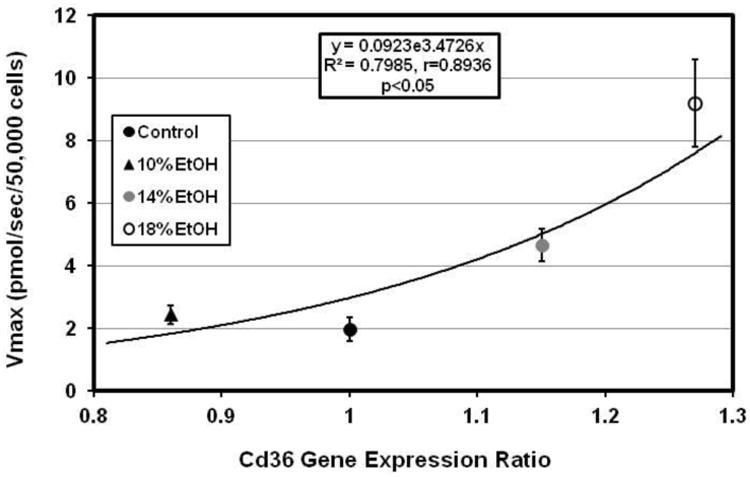
(A) Cardiac gene expression ratios for cardiac LCFA transporters (Got2, Slc27a1, Slc27a6, and Cd36) and for two enzymes of LCFA synthesis, stearoyl CoA desaturase-1 (Scd1), and fatty acid synthase (Fasn). Cd36 and Scd1 were significantly up-regulated in 18% EtOH-fed mice. (B) Vmax for [3H]-oleic acid uptake in cardiomyocytes was significantly correlated with the Cd36 gene expression ratio in all EtOH groups.
Fasn, encoding an important enzyme in de novo fatty acid synthesis, was unchanged by EtOH. However, Scd-1, encoding steroyl-CoA desaturase 1, which catalyzes a rate-limiting step in mono-unsaturated fatty acid synthesis, was up-regulated in all EtOH groups (Figure 4A). Apob and Mttp, involved in VLDL synthesis, assembly and export, showed diverse changes. Apob was up-regulated dramatically while Mttp was either unchanged or down-regulated (data not shown).
The gene for lipoprotein lipase was unchanged, and that for the LDL receptor was down-regulated by EtOH. DGAT-1 and -2, enzymes involved in the final esterification step in triglyceride synthesis, were both up-regulated only in the E14group. Expression of CPT-1, which participates in LCFA import into mitochondria for oxidation, and of dodecenoyl-coenzyme A delta isomerase (3,2-trans-enoyl-coenzyme A isomerase, DCI), which encodes a key mitochondrial enzyme involved in β-oxidation of unsaturated LCFA , were not significantly changed by EtOH-feeding (data not shown).
In a prior study we unexpectedly found several genes in the Kyoto Encyclopedia of Genes and Genomics (KEGG) [38] Oxidative Phosphorylation (OX-PHOS) pathway to be down-regulated in obese human fat [39]. We subsequently found that the expression of all 10 genes in this KEGG pathway that we assayed in cardiomyocytes from mice with several different models of obesity were also coordinately down-regulated [25]. These genes are components of the mitochondrial electron transport chain and the enzyme complex of ATP synthetase. In the current study these same genes, Ndufaf4 an dNdufa8, components of Complex I (NADH dehydrogenase); Sdhd, a component of Complex II (Fumarate reductase); Cox5b, Cox6b1 and Cox6c, from Complex III (Cytochrome c reductase); Uqcrfs1 and Uqcrc2, from Complex IV (Cytochrome c oxidase), and Atp5h and Atp5j from Complex V (F-Type ATPase) were all down-regulated in all of the EtOH groups (Figure 5A). Peroxisome proliferator-activated receptor-γ coactivator-1α (PGC-1α), a master regulator of mitochondrial biogenesis and energy metabolism, was significantly decreased in the E14 and E18 groups (Figure 5B), coincident with the decreases in OX-PHOS gene expression. We believe this is the first study to associate decreased cardiac PGC-1α expression specifically with EtOH.
Figure 5. Gene expression.
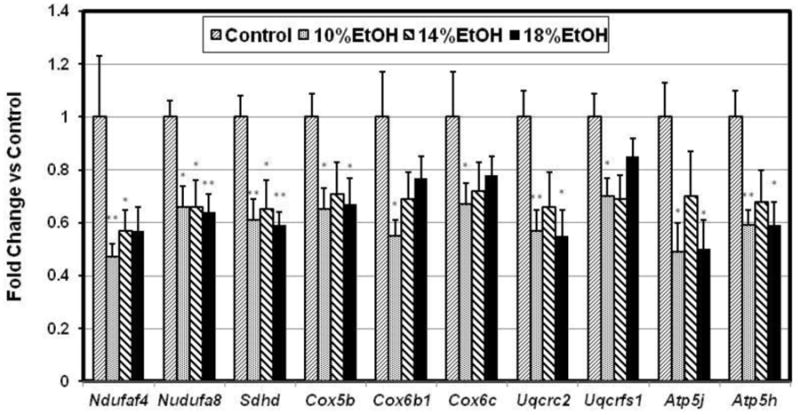
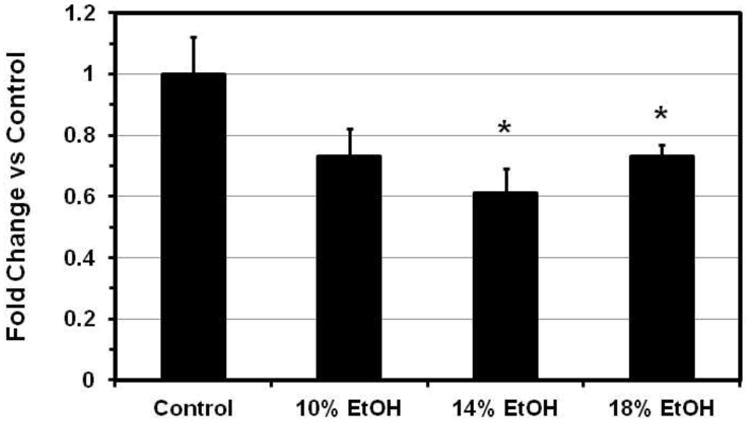
(A) Cardiac expression ratios of 10 oxidative phosphorylation genes. Complex I: NADH dehydrogenase (Ndufaf4, Ndufa8); complex II: fumaratereductase (Sdhd); complex III: cytochrome c reductase (Cox5b, Cox6b1, and Cox6c); complex IV: cytochrome c oxidase (Uqcrc2, Uqcrfs1); Complex V: F-type ATPase (Atp5j, Atp5h) were all down-regulated in all EtOH groups. Data indicate Mean ±SE. * p<0.05, ** p<0.01, compared with the control group. (B) Cardiac PGC-1α gene expression ratio. PGC-1α was significantly decreased in the 14% and 18% EtOH groups. Date presented as Mean ± SE. * p<0.05, compared with the control group.
ATP Measurements
The ATP content in the hearts of 18% EtOH-fed mice (5.18 ± 0.54 pmol/μg protein) was reduced by 30% (p<0.03) compared to that of control hearts (7.40 ± 0.64 pmol/μg protein). The extent of the decrease was very similar to the decreases in EF and FS, related parameters both of which reflect energy consuming, ATP-dependent processes, and to the extent of PGC-1α down-regulation (Figure 6).
Figure 6. PGC-1α Gene Expression.
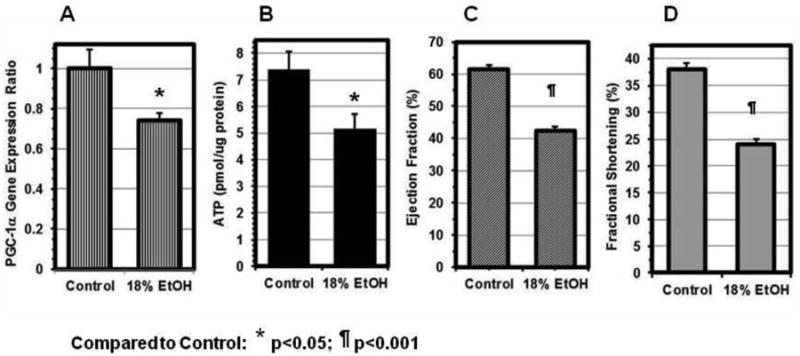
(A) The PGC-1α expression ratio in the hearts of 18% EtOH-fed mice was reduced to 74 ± 4 % of that in Controls. The extent of the decreases in the ATP content (B), EF (C) and FS (D) to 70 ± 9%, 69 ± 3%, and 63 ± 3% of their respective control values was very similar. Data are Mean ± SE. * p<0.05, ¶ p<0.001, compared with the control group.
Lipid analyses
While total serum LCFA concentrations ranged from 670±70 μM in controls to a maximum of 1,220±300 μM in E18 mice (0.1>p>0.05), and were somewhat increased in all the experimental groups, none of these increases was statistically significant, as we have reported previously in EtOH-fed mice with fatty livers [24]. However, serum albumin concentrations were slightly decreased in the EtOH-fed mice. Consequently, the unbound fatty acid concentration, which reflects the fatty acid:albumin molar ratio and which provides a driving force for LCFA uptake, was statistically significantly increased in all experimental groups, from 163±17 nM in the control group to a peak of 490±123 nM in the E18 group (p<0.025) [24]. Plasma TGs were also increased in the EtOH-fed mice, but the increase was statistically significant only in the E18 group [24]. The cardiac content of LCFAs, LCFA acyl CoAs, TGs, and fatty acid ethyl esters (FAEEs), were all increased in EtOH-fed mice compared with controls (Figure 7). While increases in LCFAs, acyl CoAs, and TGs were not statistically significant, the cardiac content of FAEEs in 18% EtOH fed mice was increased 12-fold compared to controls (p<0.025). By contrast the cardiac FAEE content in high fat diet-fed obese mice (DIO mice, Jackson Labs) of the same age was identical to that in controls (Figure 7), although cardiomyocyte LCFA uptake and cardiac TG content in high fat diet-fed mice [25] was very similar to that in the 18% EtOH group. Measurements of FAEEs are not often reported but are important in the context of ALD, as they are produced by the non-oxidative metabolism of alcohol and have been reported to be cardiotoxic [40-44]. We also measured ceramides, resolving total ceramides into 15 distinct molecular species. Total cardiac ceramides were not different between control and E18 mice (13.52 ± 1.16 vs 12.62 ± 0.48 nmol/g, p = 0.497). Values for 14 of the 15 individual species were similarly unchanged. Only C24:1 ceramide changed significantly, decreasing from 0.818 ± 0.078 nmol/g in control hearts to 0.616 ± 0.024 in E18 (p = 0.031).
Figure 7. Lipidomic results.
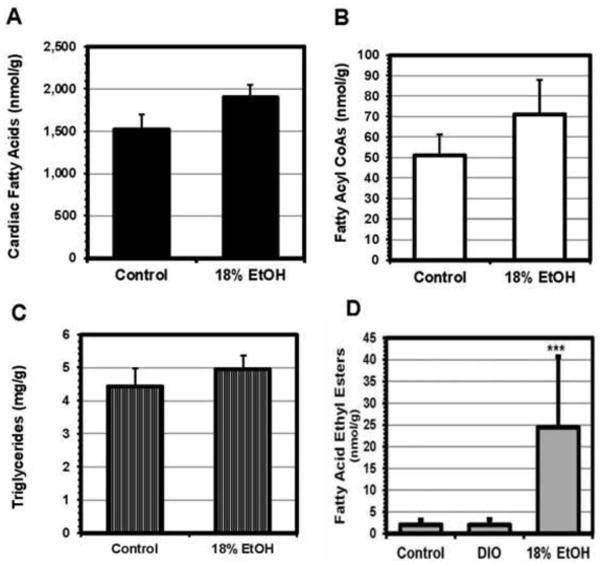
LC/MS/MS measurements of the cardiac content of key components of the fatty acid pathway in EtOH-fed mice. Total fatty acids (A), fatty acyl CoAs (B), and triglycerides (C) were all increased in the EtOH-fed mice compared to controls, although only the increase in fatty acids was statistically significant. In addition, fatty acid ethyl esters (FAEEs), a cardiotoxic non-oxidative metabolite of EtOH metabolism, were increased by a mean of 12-fold in the E18 group (D). The analysis employed resolved 11 different FAEEs; all were increased in the EtOH-treated animals.
Palmitic acid is a product of de novo synthesis, but linoleic and α-linolenic acids are derived from dietary sources. Hence, the direction of change in the cardiac palmitic:linoleic acid and palmitic:α-linolenic acid ratios indicates the relative contributions of uptake vs de novo synthesis to cardiac LCFA and TG content in the presence of cardiac steatosis. In the present study the cardiac palmitate: linoleate ratio decreased from 0.59±0.16 in control to 0.40±0.04 in E18 mice and the palmitic:α-linolenic acid ratio from 13.93±2.77 to 8.23±1.24, suggesting in both cases that LCFA uptake contributed more to increased cardiac TG content than did de novo synthesis. A detailed analysis of EtOH effects on the cardiac lipidome, analogous to a recent study on the hepatic lipodome [26], will be reported separately.
Discussion
Alcohol has been reported by some to be the most frequent identifiable cause of heart muscle disease [1], and heart muscle abnormalities are believed to occur in most chronic alcoholics [45, 46]. In this study, we show that a dose-dependent increase in TG accumulation in cardiomyocytes resulting from chronic alcohol consumption is associated in mice with a progressive decrease in cardiac functional capacity as manifested by decreases in echocardiographic measures of cardiac contractility. These findings lead to three questions: 1) What is the mechanism underlying the increased myocardial TG accumulation? 2) Is the TG accumulation causally linked to the decreased functional capacity? and 3) If so, how?
As with hepatic steatosis [20, 47, 48] increased myocardial TG content can result from one or more of several process that increase cardiomyocyte LCFA or TG uptake or synthesis, or decrease LCFA metabolism, e.g. by decreasing LCFA oxidation or TG export. The current studies show that facilitated LCFA uptake is increased in mouse cardiomyocytes isolated from all three EtOH-fed groups, and that the cardiac TG content is significantly and positively correlated with the Vmax for facilitated LCFA uptake. Regression and lipidomic analyses suggest that of the majority of the increased myocardial TG content in the EtOH-fed groups is attributable to increased LCFA uptake. Our technique for studying LCFA uptake, in which measurements are made over 15 sec, is unique in determining unidirectional, facilitated influx rates, largely independent of intracellular binding and metabolism of LCFAs [30]. In specific settings, results from this approach have also been highly correlated with the expression of genes for specific LCFA transporters [21, 22, 24, 25, 49]. This report and our earlier study in mouse obesity models [25] are the first to apply this specific, validated technique to measurements of cardiac LCFA uptake and to correlate the results directly with the expression of multiple cardiac LCFA transporter genes.
Seven proteins have been proposed as putative LCFA transporters, of which four are believed to be important in myocardial LCFA uptake: CD36; plasma membrane fatty acid binding protein (FABPpm), which has proven identical to mitochondrial aspartate aminotransferase (mAspAT); and fatty acid transport proteins 1 and 6 (FATP1 and FATP6) [12, 14, 20, 50, 51]. In the present study, some degree of up-regulation of the Cd36 and/or Slc27a1 (FATP1) genes was found by qRT-PCR in all EtOH-fed groups. Up-regulation of Slc27a6 was not seen in any of the groups. Expression ratios for Cd36 were especially highly correlated with Vmax across all of the EtOH-treated groups.
A relationship between increased uptake and/or accumulation of myocardial lipids and cardiac dysfunction was established by Chiu et al, who created lines of transgenic mice selectively over-expressing myocardial FATP1 [52] and long-chain acyl CoA-synthetase (ACS) [53]. FATP1 facilitates the movement of LCFA across the plasma membrane, whereas ACS, also located at the plasma membrane, functions coordinately with FATP1 to facilitate vectorial LCFA uptake by esterifying LCFAs immediately after their transmembrane transport, thereby trapping them inside the cell. FATP1 overexpression resulted in a 4-fold increase in the rate of cardiac LCFA uptake, although, reportedly, no increase in myocardial TG content, possibly reflecting rapid metabolism of the fatty acids taken up. Transgenic ACS overexpression resulted in marked cardiac accumulation of TGs and other lipids. Both transgenic lines resulted in severe “lipotoxic cardiomyopathies”. Neither the extent of the lipid accumulation nor the degree of cardiac dysfunction in the obesity- and EtOH-associated mouse models that we have studied are as severe as those reported by Chiu et al [52, 53]. However, the precise processes by which cardiomyocyte lipid accumulation leads to myocardial dysfunction remain to be elucidated. Whether those in obese or EtOH-fed mice are the same as those described as “lipotoxic cardiomyopathy” in transgenic mouse models is unclear. Nevertheless, the many similarities between both the present cardiac findings and those recently reported in obese mice [24], and analogous human data, suggest that these mice may be useful models for human alcoholic and obesity cardiomyopathies.
EtOH consumption of ≥100 g/day (1.7 g/day/kg body weight) in men and 80 g/day (1.3 g/day/kg weight) in women over ≥ 10 yrs, representing a minimum lifetime dose of 7 kg EtOH/kg body weight in men and 5 kg EtOH/kg weight in women, is reportedly required to produce human alcoholic cardiomyopathy [54, 55]. In one 5-year study, 20% of alcoholic women and 26% of alcoholic men consuming such quantities developed a dilated cardiomyopathy [56]. Our male mice drank a mean of 17.2 g EtOH /day/kg weight for 3 months, a period equivalent to > 5 years of human life. The observed dose-related decreases in EF and FS clearly indicate a degree of cardiac dysfunction, and the negative correlations between these measures of cardiac function and cumulative EtOH consumption suggest that in some manner EtOH exerts a dose-related toxic effect on the myocardium. The echocardiographic measurements reported are indicative of systolic dysfunction. No specific data on diastolic function were obtained. In humans, although isolated diastolic dysfunction can be found in many pathological conditions, it is rather unusual to have systolic dysfunction without accompanying diastolic dysfunction. Whether the same is true in mice is less certain. We have no evidence that our mice had developed a dilated cardiomyopathy, which is the most typical form of alcoholic cardiomyopathy in man. This may simply be because the mice were still in a sub-clinical stage of alcoholic cardiomyopathy when studied. Fully developed dilated cardiomyopathy is readily identified by echocardiography, but can be difficult to detect in its early stages. While the situation in mice is less clear, rats only develop an overt, dilated cardiomyopathy after ≥12 mos of EtOH consumption [57]. Finally, EtOH administration to mice in some, but not all circumstances, may lead to hypertension with significant cardiac hypertrophy [36]. Although blood pressure was not recorded in this study, neither the heart weight nor any of the echocardiographic, histologic or electron microscopic data obtained was suggestive of cardiac hypertrophy. While it is therefore unlikely that hypertension was a significant contributing cause to the reduced ventricular function observed, the lack of blood pressure measurements is an admitted weakness of the present report, which we will correct in planned future studies.
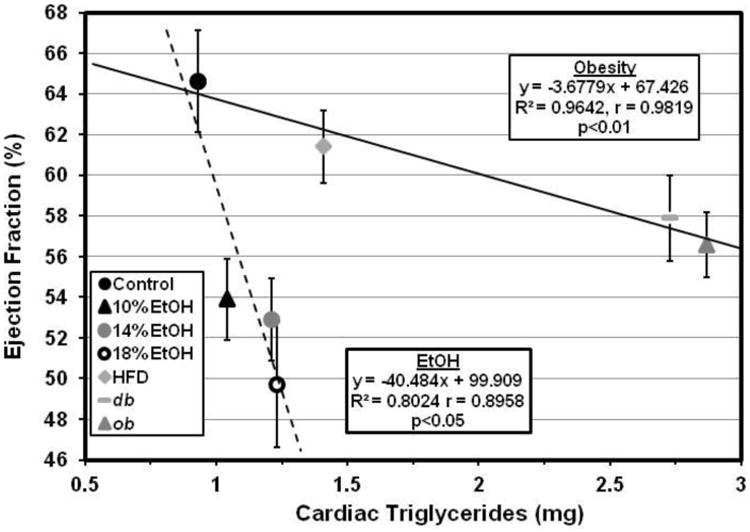
Although alcoholic cardiomyopathy and obesity cardiomyopathy (fatty heart) are considered distinct entities, their mouse models exhibit notable similarities. Both obesity and EtOH consumption in mice lead to modest increases in intra-cardiomyocyte TGs [25], resulting principally from comparable increases in facilitated LCFA uptake, due in turn to up-regulation of LCFA transporters, particularly CD36 and FATP1. Gene expression and lipidomics data suggest that increased de novo LCFA synthesis also occurs in both situations, but contributes less than increased uptake to the increased TG accumulation. The increased myocardial TG levels are highly negatively correlated with measures of cardiac contractility such as ejection fraction (Figure 8) and the closely related fractional shortening of the left ventricle during systole (not shown) associated with both EtOH-consumption and obesity [25] in mice, although the slope of the decline in these parameters with increasing cardiac TG content is much steeper with EtOH (Figure 8). This raises the possibility of an additional injury in the EtOH-associated model. The highly significant increase in cardiac FAEEs seen in EtOH-fed, but not HFD-fed mice, may represent precisely the basis for such an injury. This possibility may address another question that has arisen in the course of these studies. While they are correlated, there is seemingly a discrepancy between the amount of ORO-stainable lipid and the amount of actual TG in the hearts of EtOH-fed mice. Although the structure of FAEEs suggests that they might accumulate in lipid droplets, the relative quantities of FAEE and TG are roughly 1:1,000 in both control and EtOH-fed mice, making it highly unlikely that FAEE themselves are responsible for the discrepancy between stainable neutral lipid and measured TG. However, there are potentiallly many other neutral lipid species within the myocardial lipidome that were not detected or quantitated in the current lipidomic studies. It is possible that up-regulation of one or more of these presently unidentified lipid species could account for both the ORO staining:TG discrepancy and the apparently increased myocardial toxicity observed in EtOH-fed mice. Because several models suggest that TG alone is not cardiotoxic but is a relatively inert intracellular storage form of energy, it has already been suggested that TG may be a marker for accumulation of other, toxic, lipids [58]. While potentially explaining the more severe loss of contractile function found at any given level of cardiac TG accumulation in EtOH-fed mice, this leaves open the question of how increased cardiac TG accumulation is related to the degree of decreased ventricular function which is found in both the EtOH- and obesity-associated models.
Figure 8. Myocardial triglycerides and left ventricular function.
The increased myocardial triglyceride levels are highly negatively correlated with EF in both obese (
 ) and EtOH-consuming (
 ) mice. However, the slope of the decline in EF with increasing cardiac triglyceride content is much steeper with EtOH consumption than with obesity. Accordingly, although high fat diet (HFD)-fed and 18% EtOH-consuming mice have similar increases in cardiac TG content, reflecting similar increases in facilitated LCFA uptake, the E18 mice have a much greater reduction in ejection fraction.
LCFA oxidation leading to increased formation of reactive oxygen species (ROS) has also been suggested to cause cardiotoxicity, but data on this issue, while extensive, are conflicting. Moreover, the EtOH model is characterized by reduced oxidation, down-regulation of PGC-1α and coordinate down-regulation of its multiple downstream target genes in the mitochondrial oxidative phosphorylation (OX-PHOS) pathway, including members of the five major complexes comprising the electron transport chain and ATP synthase on the inner mitochondrial membrane. Strong correlations between increased tissue TG levels and increased LCFA uptake, and significantly decreased expression of OX-PHOS genes, have previously been reported in obese human adipocytes [39], hepatocytes from mice with hepatic steatosis due either to obesity or EtOH feeding [24], and in cardiomyocytes from mice with an obesity-associated cardiomyopathy [25]. In these studies, genes involved in β-oxidation were also down-regulated in obese adipocytes, but not in either steatotic hepatocytes or cardiomyocytes. Our data are consistent with a model in which both EtOH and obesity cause up-regulation of myocardial LCFA uptake, leading to increased myocardial TG content. Related accumulation of toxic, non-TG lipids, e.g. FAEEs in the case of EtOH, may, in turn, be what leads to down-regulation of PGC-1α expression and its downstream targets in the mitochondrial OX-PHOS pathway, decreased myocardial ATP levels, and consequent decreased myocardial contractility. While, hypothetically, inhibition of fatty acid oxidation might precede and be the primary reason for TG accumulation in the heart, our data demonstrating highly significant correlations between increased LCFA uptake and increased myocardial TG in both obesity- and EtOH-related myocardial dysfunction argue against this latter possibility.
Decreased PGC-1α expression has been implicated in the maladaptive energetic profile of failing hearts from many causes [59-63]. It is therefore also possible that decreased PGC-1α expression and resultant decreases in ATP production and LV contractility are non-specific consequences of myocardial injury from EtOH or its metabolites, rather than a specific consequence of increased cardiac lipid accumulation [64]. However, that PGC-1α and the OX-PHOS pathway are downregulated in association with increased TG accumulation in the absence of overt tissue toxicity in obese human adipose tissue [39] and in the liver in multiple mouse models of hepatic steatosis [24] suggests that PGC-1α may, indeed, provide a direct link between cardiac TG accumulation and contractile dysfunction. While the mechanisms regulating PGC-1α transcription are complex, and vary between different tissues and different situations [65], sometimes subtle experimental stresses have been shown to lead to upregulated cardiac expression of e.g. Myc, TNFα, NF-κB, and p38 MAP kinase, which in turn down-regulate PGC-1α [66-68]. Whether increased myocardial TG accumulation constitutes such a situation remains to be established. In addition, two different PGC-1α-/- mouse models showed significantly impaired energetics and cardiac dysfunction [59, 61, 69].
Abnormalities of mitochondrial structure and function are known results of chronic EtOH abuse in both man and animals [70-72]. While some reports attribute this to acetaldehyde, the initial breakdown product of EtOH [71], others implicate cardiac metabolism of EtOH to FAEEs, which accumulate in the heart after chronic EtOH exposure, bind to mitochondria, and interfere with mitochondrial ATP production. Our results suggest that FAEEs may be an important link between EtOH and heart muscle disease [40-44], possibly explaining the apparent differences in the relationship between cardiac TG content and ejection fraction observed in obesity- vs EtOH-related cardiac dysfunction (Figure 8).
In summary, our results strongly suggest relationships between EtOH consumption, myocardial LCFA uptake and TG accumulation, and cardiac dysfunction. While changes in gene expression suggest that increased de novo myocardial LCFA synthesis may also contribute to the increased myocardial TG accumulation, our lipidomic data indicate that this contribution is less than that of increased LCFA uptake. However, definitive proof of the role of LCFA uptake in EtOH-associated cardiac steatosis and cardiomyopathy will ultimately require a demonstration that blocking LCFA uptake diminishes cardiac lipid accumulation and protects against diminished cardiac function in the setting of chronic EtOH consumption. Intra-myocardial TG accumulation is a multi-step process, to which up-regulation of facilitated CD36- and FATP1-mediated LCFA uptake makes a major contribution. Knockouts of the genes encoding CD36 and/or FATP1 are an obvious strategy for confirming the role of LCFA uptake in the development of cardiac steatosis and cardiomyopathy. We have begun breeding a colony of CD36(-/-) mice as a first step in pursuit of this strategy. Finally, our data also suggest that EtOH-associated increases in myocardial TG or related lipid metabolites may be responsible for decreased expression of PGC-1α and its downstream OX-PHOS targets, resulting in decreased myocardial ATP levels and corresponding decreases in LV contractility. The development of transgenic mice in which cardio-specific transgene-mediated PGC-1α expression can be regulated [73] makes this a testable hypothesis that will allow direct clarification of the roles of both PGC-1α expression and TG accumulation in LV function in EtOH-fed mice. For the moment, precisely how, and indeed, whether EtOH directly down-regulates cardiac PGC-1α expression remains unclear.
Highlights.
Ethanol intake by C57BL/6J mice increases cardiomyocyte fatty acid (FA) uptake.
The increased FA uptake correlates with increased triglyceride (TG) content.
Ethanol also down-regulates cardiac PGC-1α, the OX-PHOS pathway, and ATP.
Ejection fraction correlates negatively with TGs and positively with ATP.
This model mimics important features of human alcoholic cardiomyopathy.
Acknowledgments
These studies were supported by National Institutes of Health grants DK-52401 and DK-72526-S1 to PDB,HL-73029 and HL-45095 to IJG, AA-019413 and DK-068437 to WSB, and HL-095742, HL-101272-01, UL1 RR 024156, HL-073029and the Herbert and Florence Irving Scholar Award to PCS. We thank Kristy R Brown (Department of Pathology) for the transmission electron microscope photomicrographs, the Diabetes and Endocrinology Research Center Histology Core for preparing the frozen sections and Oil Red O staining, and Biao Cai, PhD for biostatistical advice.
Footnotes
Disclosure: None of the authors has any conflict of interest to declare.
Publisher's Disclaimer: This is a PDF file of an unedited manuscript that has been accepted for publication. As a service to our customers we are providing this early version of the manuscript. The manuscript will undergo copyediting, typesetting, and review of the resulting proof before it is published in its final citable form. Please note that during the production process errors may be discovered which could affect the content, and all legal disclaimers that apply to the journal pertain.
References
- 1.Regan TJ. Alcohol and the cardiovascular system. JAMA. 1990 Jul 18;264(3):377–81. [PubMed] [Google Scholar]
- 2.Fernandez-Sola J, Preedy VR, Lang CH, Gonzalez-Reimers E, Arno M, Lin JC, et al. Molecular and cellular events in alcohol-induced muscle disease. Alcohol Clin Exp Res. 2007 Dec;31(12):1953–62. doi: 10.1111/j.1530-0277.2007.00530.x. [DOI] [PubMed] [Google Scholar]
- 3.Fernandez-Sola J, Fatjo F, Sacanella E, Estruch R, Bosch X, Urbano-Marquez A, et al. Evidence of apoptosis in alcoholic cardiomyopathy. Hum Pathol. 2006 Aug;37(8):1100–10. doi: 10.1016/j.humpath.2006.03.022. [DOI] [PubMed] [Google Scholar]
- 4.Guo R, Ren J. Alcohol dehydrogenase accentuates ethanol-induced myocardial dysfunction and mitochondrial damage in mice: role of mitochondrial death pathway. PLoS One. 2010;5(1):e8757. doi: 10.1371/journal.pone.0008757. [DOI] [PMC free article] [PubMed] [Google Scholar]
- 5.Worrall S, Niemela O, Parkkila S, Peters TJ, Preedy VR. Protein adducts in type I and type II fibre predominant muscles of the ethanol-fed rat: preferential localisation in the sarcolemmal and subsarcolemmal region. Eur J Clin Invest. 2001 Aug;31(8):723–30. doi: 10.1046/j.1365-2362.2001.00848.x. [DOI] [PubMed] [Google Scholar]
- 6.Adachi J, Asano M, Ueno Y, Reilly M, Mantle D, Peters TJ, et al. 7alpha- and 7beta-hydroperoxycholest-5-en-3beta-ol in muscle as indices of oxidative stress: response to ethanol dosage in rats. Alcohol Clin Exp Res. 2000 May;24(5):675–81. [PubMed] [Google Scholar]
- 7.Fernandez-Sola J, Garcia G, Elena M, Tobias E, Sacanella E, Estruch R, et al. Muscle antioxidant status in chronic alcoholism. Alcohol Clin Exp Res. 2002 Dec;26(12):1858–62. [PubMed] [Google Scholar]
- 8.Otis JS, Brown LA, Guidot DM. Oxidant-induced atrogin-1 and transforming growth factor-beta1 precede alcohol-related myopathy in rats. Muscle Nerve. 2007 Dec;36(6):842–8. doi: 10.1002/mus.20883. [DOI] [PMC free article] [PubMed] [Google Scholar]
- 9.Lang CH, Frost RA, Svanberg E, Vary TC. IGF-I/IGFBP-3 ameliorates alterations in protein synthesis, eIF4E availability, and myostatin in alcohol-fed rats. Am J Physiol Endocrinol Metab. 2004 Jun;286(6):E916–26. doi: 10.1152/ajpendo.00554.2003. [DOI] [PubMed] [Google Scholar]
- 10.Ronis MJ, Wands JR, Badger TM, de la Monte SM, Lang CH, Calissendorff J. Alcohol-induced disruption of endocrine signaling. Alcohol Clin Exp Res. 2007 Aug;31(8):1269–85. doi: 10.1111/j.1530-0277.2007.00436.x. [DOI] [PubMed] [Google Scholar]
- 11.Sorrentino D, Robinson RB, Kiang CL, Berk PD. At physiologic albumin/oleate concentrations oleate uptake by isolated hepatocytes, cardiac myocytes, and adipocytes is a saturable function of the unbound oleate concentration. Uptake kinetics are consistent with the conventional theory. J Clin Invest. 1989;84:1325–33. doi: 10.1172/JCI114301. [DOI] [PMC free article] [PubMed] [Google Scholar]
- 12.Glatz JF, Bonen A, Luiken JJ. Sarcolemmal fatty acid transport in normal and diseased hearts. Curr Hypertens Rep. 2007 Dec;9(6):450–4. doi: 10.1007/s11906-007-0083-6. [DOI] [PubMed] [Google Scholar]
- 13.Glatz JF, Luiken JJ, Bonen A. Involvement of membrane-associated proteins in the acute regulation of cellular fatty acid uptake. J Mol Neurosci. 2001 Apr-Jun;16(2-3):123–32. doi: 10.1385/JMN:16:2-3:123. [DOI] [PubMed] [Google Scholar]
- 14.Luiken JJ, van Nieuwenhoven FA, America G, van der Vusse GJ, Glatz JF. Uptake and metabolism of palmitate by isolated cardiac myocytes from adult rats: involvement of sarcolemmal proteins. J Lipid Res. 1997 Apr;38(4):745–58. [PubMed] [Google Scholar]
- 15.Carley AN, Kleinfeld AM. Fatty acid (FFA) transport in cardiomyocytes revealed by imaging unbound FFA is mediated by an FFA pump modulated by the CD36 protein. J Biol Chem. 2011 Feb 11;286(6):4589–97. doi: 10.1074/jbc.M110.182162. [DOI] [PMC free article] [PubMed] [Google Scholar]
- 16.Suzuki J, Shen WJ, Nelson BD, Patel S, Veerkamp JH, Selwood SP, et al. Absence of cardiac lipid accumulation in transgenic mice with heart-specific HSL overexpression. Am J Physiol Endocrinol Metab. 2001;281:857–66. doi: 10.1152/ajpendo.2001.281.4.E857. [DOI] [PubMed] [Google Scholar]
- 17.Jacob S. Lipid droplet accumulation in the heart during fasting. Acta Histochem. 1987;82(2):149–52. doi: 10.1016/S0065-1281(87)80020-X. [DOI] [PubMed] [Google Scholar]
- 18.Tsiplenkova VG, Vikhert AM, Cherpachenko NM. Ultrastructural and histochemical observations in human and experimental alcoholic cardiomyopathy. Journal of the American College of Cardiology. 1986 Jul;8(1 Suppl A):22A–32A. doi: 10.1016/s0735-1097(86)80025-0. [DOI] [PubMed] [Google Scholar]
- 19.Berk PD, Stump DD. Mechanisms of cellular uptake of long chain free fatty acids. Mol Cell Biochem. 1999 Feb;192(1-2):17–31. [PubMed] [Google Scholar]
- 20.Berk PD. Regulatable fatty acid transport mechanisms are central to the pathophysiology of obesity, fatty liver, and metabolic syndrome. Hepatology. 2008 Nov;48(5):1362–76. doi: 10.1002/hep.22632. [DOI] [PMC free article] [PubMed] [Google Scholar]
- 21.Berk PD, Zhou S, Kiang C, Stump DD, Fan X, Bradbury MW. Selective up-regulation of fatty acid uptake by adipocytes characterizes both genetic and diet-induced obesity in rodents. J Biol Chem. 1999;274:28626–31. doi: 10.1074/jbc.274.40.28626. [DOI] [PubMed] [Google Scholar]
- 22.Berk PD, Zhou SL, Kiang CL, Stump D, Bradbury M, Isola LM. Uptake of long chain free fatty acids is selectively up-regulated in adipocytes of Zucker rats with genetic obesity and non-insulin-dependent diabetes mellitus. J Biol Chem. 1997 Mar 28;272(13):8830–5. doi: 10.1074/jbc.272.13.8830. [DOI] [PubMed] [Google Scholar]
- 23.Petrescu O, Fan X, Gentileschi P, Hossain S, Bradbury M, Gagner M, et al. Long-chain fatty acid uptake is upregulated in omental adipocytes from patients undergoing bariatric surgery for obesity. Int J Obes (Lond) 2005 Feb;29(2):196–203. doi: 10.1038/sj.ijo.0802868. [DOI] [PubMed] [Google Scholar]
- 24.Ge F, Zhou S, Hu C, Lobdell H, IV, Berk PD. Insulin- and leptin-regulated fatty acid uptake plays a key causal role in hepatic steatosis in mice with intact leptin signaling but not in ob/ob or db/db mice. Am J Physiol Gastrointest Liver Physiol. 2010 Oct;299(4):G855–66. doi: 10.1152/ajpgi.00434.2009. [DOI] [PMC free article] [PubMed] [Google Scholar]
- 25.Ge F, Hu C, Hyodo E, Arai K, Zhou S, Lobdell H, IV, et al. Cardiomyocyte triglyceride accumulation and reduced ventricular function in mice with obesity reflect increased long chain Fatty Acid uptake and de novo Fatty Acid synthesis. J Obes. 2012;2012:205648. doi: 10.1155/2012/205648. [DOI] [PMC free article] [PubMed] [Google Scholar]
- 26.Clugston RD, Jiang H, Lee MX, Piantedosi R, Yuen JJ, Ramakrishnan R, et al. Altered hepatic lipid metabolism in C57BL/6 mice fed alcohol: a targeted lipidomic and gene expression study. J Lipid Res. 2011 Nov;52(11):2021–31. doi: 10.1194/jlr.M017368. [DOI] [PMC free article] [PubMed] [Google Scholar]
- 27.Leach FR. ATP Determination with Firefly Luciferase. J Appl Biochem. 1981;3:473–517. [Google Scholar]
- 28.Hayat MA. Principles and techniques of electron microscopy. 3rd. CRC Press Inc.; Boca Raton, Fla.: p. 1989. [Google Scholar]
- 29.Sorrentino D, Stump D, Potter BJ, Robinson RB, White R, Kiang CL, et al. Oleate uptake by cardiac myocytes is carrier mediated and involves a 40-kD plasma membrane fatty acid binding protein similar to that in liver, adipose tissue, and gut. J Clin Invest. 1988 Sep;82(3):928–35. doi: 10.1172/JCI113700. [DOI] [PMC free article] [PubMed] [Google Scholar]
- 30.Stremmel W, Berk PD. Hepatocellular influx of [14C]oleate reflects membrane transport rather than intracellular metabolism or binding. Proc Natl Acad Sci U S A. 1986 May;83(10):3086–90. doi: 10.1073/pnas.83.10.3086. [DOI] [PMC free article] [PubMed] [Google Scholar]
- 31.Stremmel W, Strohmeyer G, Berk PD. Hepatocellular uptake of oleate is energy dependent, sodium linked, and inhibited by an antibody to a hepatocyte plasma membrane fatty acid binding protein. Proc Natl Acad Sci U S A. 1986;83:3584–8. doi: 10.1073/pnas.83.11.3584. [DOI] [PMC free article] [PubMed] [Google Scholar]
- 32.Stump DD, Fan X, Berk PD. Oleic acid uptake and binding by rat adipocytes define dual pathways for cellular fatty acid uptake. J Lipid Res. 2001;42:509–20. [PubMed] [Google Scholar]
- 33.Berk PD, Zhou S, Bradbury MW. Increased hepatocellular uptake of long chain fatty acids occurs by different mechanisms in fatty livers due to obesity or excess ethanol use, contributing to development of steatohepatitis in both settings. Trans Am Clin Climatol Assoc. 2005;116:335–44. [PMC free article] [PubMed] [Google Scholar]
- 34.SAAMII User Guide. Seatle, WA: SAAM Institute; 1998. [Google Scholar]
- 35.Berman M, Weiss MF. User's Manual for SAAM: U S Public Health Service Publication 1703. Department of Health and Human Services; Washington, DC.: 1967. [Google Scholar]
- 36.Tan Y, Li X, Prabhu SD, Brittian KR, Chen Q, Yin X, et al. Angiotensin II plays a critical role in alcohol-induced cardiac nitrative damage, cell death, remodeling, and cardiomyopathy in a protein kinase C/nicotinamide adenine dinucleotide phosphate oxidase-dependent manner. Journal of the American College of Cardiology. 2012 Apr 17;59(16):1477–86. doi: 10.1016/j.jacc.2011.12.034. [DOI] [PMC free article] [PubMed] [Google Scholar]
- 37.Akagiri S, Naito Y, Ichikawa H, Mizushima K, Takagi T, Handa O, et al. A Mouse Model of Metabolic Syndrome; Increase in Visceral Adipose Tissue Precedes the Development of Fatty Liver and Insulin Resistance in High-Fat Diet-Fed Male KK/Ta Mice. J Clin Biochem Nutr. 2008 Mar;42(2):150–7. doi: 10.3164/jcbn.2008022. [DOI] [PMC free article] [PubMed] [Google Scholar]
- 38.Kanehisa M, Goto S, Kawashima S, Okuno Y, Hattori M. The KEGG resource for deciphering the genome. Nucleic Acids Res. 2004 Jan 1;32:D277–80. doi: 10.1093/nar/gkh063. [DOI] [PMC free article] [PubMed] [Google Scholar]
- 39.Walewski JL, Ge F, Gagner M, Inabnet WB, Pomp A, Branch AD, et al. Adipocyte accumulation of long-chain fatty acids in obesity is multifactorial, resulting from increased fatty acid uptake and decreased activity of genes involved in fat utilization. Obes Surg. 2010;20:93–9107. doi: 10.1007/s11695-009-0002-9. [DOI] [PMC free article] [PubMed] [Google Scholar]
- 40.Beckemeier ME, Bora PS. Fatty acid ethyl esters: potentially toxic products of myocardial ethanol metabolism. J Mol Cell Cardiol. 1998 Nov;30(11):2487–94. doi: 10.1006/jmcc.1998.0812. [DOI] [PubMed] [Google Scholar]
- 41.Bora PS, Farrar MA, Miller DD, Chaitman BR, Guruge BL. Myocardial cell damage by fatty acid ethyl esters. J Cardiovasc Pharmacol. 1996;27:1–6. doi: 10.1097/00005344-199601000-00001. [DOI] [PubMed] [Google Scholar]
- 42.Guo R, Ren J. Alcohol and acetaldehyde in public health: from marvel to menace. Int J Environ Res Public Health. 2010 Apr;7(4):1285–301. doi: 10.3390/ijerph7041285. [DOI] [PMC free article] [PubMed] [Google Scholar]
- 43.Lange LG, Sobel BE. Mitochondrial dysfunction induced by fatty acid ethyl esters, myocardial metabolites of ethanol. J Clin Invest. 1983;72:724–31. doi: 10.1172/JCI111022. [DOI] [PMC free article] [PubMed] [Google Scholar]
- 44.Laposata M. Fatty acid ethyl esters: ethanol metabolites which mediate ethanol-induced organ damage and serve as markers of ethanol intake. Prog Lipid Res. 1998 Nov;37(5):307–16. doi: 10.1016/s0163-7827(98)00013-7. [DOI] [PubMed] [Google Scholar]
- 45.Thomas AP, Rozanski DJ, Renard DC, Rubin E. Effects of ethanol on the contractile function of the heart: a review. Alcohol Clin Exp Res. 1994 Feb;18(1):121–31. doi: 10.1111/j.1530-0277.1994.tb00891.x. [DOI] [PubMed] [Google Scholar]
- 46.Zambrano SS, Mazzotta JF, Sherman D, Spodick DH. Cardiac dysfunction in unselected chronic alcoholic patients: noninvasive screening by systolic time intervals. Am Heart J. 1974;87:318–20. doi: 10.1016/0002-8703(74)90072-6. [DOI] [PubMed] [Google Scholar]
- 47.Bradbury MW, Berk PD. Lipid metabolism in hepatic steatosis. Clin Liver Dis. 2004 Aug;8(3):639–71. doi: 10.1016/j.cld.2004.04.005. xi. [DOI] [PubMed] [Google Scholar]
- 48.Goldberg IJ, Ginsberg HN. Ins and outs modulating hepatic triglyceride and development of nonalcoholic fatty liver disease. Gastroenterology. 2006 Apr;130(4):1343–6. doi: 10.1053/j.gastro.2006.02.040. [DOI] [PubMed] [Google Scholar]
- 49.Zhou SL, Gordon RE, Bradbury M, Stump D, Kiang CL, Berk PD. Ethanol up-regulates fatty acid uptake and plasma membrane expression and export of mitochondrial aspartate aminotransferase in HepG2 cells. Hepatology. 1998 Apr;27(4):1064–74. doi: 10.1002/hep.510270423. [DOI] [PubMed] [Google Scholar]
- 50.Glatz JF, Luiken JJ, Bonen A. Membrane fatty acid transporters as regulators of lipid metabolism: implications for metabolic disease. Physiol Rev. 2010 Jan;90(1):367–417. doi: 10.1152/physrev.00003.2009. [DOI] [PubMed] [Google Scholar]
- 51.Stahl A. A current review of fatty acid transport proteins (SLC27) Pflugers Arch. 2004 Feb;447(5):722–7. doi: 10.1007/s00424-003-1106-z. [DOI] [PubMed] [Google Scholar]
- 52.Chiu HC, Kovacs A, Blanton RM, Han X, Courtois M, Weinheimer CJ, et al. Transgenic expression of fatty acid transport protein 1 in the heart causes lipotoxic cardiomyopathy. Circ Res. 2005 Feb 4;96(2):225–33. doi: 10.1161/01.RES.0000154079.20681.B9. [DOI] [PubMed] [Google Scholar]
- 53.Chiu HC, Kovacs A, Ford DA, Hsu FF, Garcia R, Herrero P, et al. A novel mouse model of lipotoxic cardiomyopathy. J Clin Invest. 2001 Apr;107(7):813–22. doi: 10.1172/JCI10947. [DOI] [PMC free article] [PubMed] [Google Scholar]
- 54.Urbano-Marquez A, Estruch R, Navarro-Lopez F, Grau JM, Mont L, Rubin E. The effects of alcoholism on skeletal and cardiac muscle. N Engl J Med. 1989 Feb 16;320(7):409–15. doi: 10.1056/NEJM198902163200701. [DOI] [PubMed] [Google Scholar]
- 55.Urbano-Marquez A, Fernandez-Sola J. Effects of alcohol on skeletal and cardiac muscle. Muscle Nerve. 2004 Dec;30(6):689–707. doi: 10.1002/mus.20168. [DOI] [PubMed] [Google Scholar]
- 56.Urbano-Marquez A, Estruch R, Fernandez-Sola J, Nicolas JM, Pare JC, Rubin E. The greater risk of alcoholic cardiomyopathy and myopathy in women compared with men. JAMA. 1995 Jul 12;274(2):149–54. doi: 10.1001/jama.1995.03530020067034. [DOI] [PubMed] [Google Scholar]
- 57.Kim SD, Beck J, Bieniarz T, Schumacher A, Piano MR. A rodent model of alcoholic heart muscle disease and its evaluation by echocardiography. Alcohol Clin Exp Res. 2001 Mar;25(3):457–63. [PubMed] [Google Scholar]
- 58.Goldberg IJ, Trent CM, Schulze PC. Lipid metabolism and toxicity in the heart. Cell metabolism. 2012 Jun 6;15(6):805–12. doi: 10.1016/j.cmet.2012.04.006. [DOI] [PMC free article] [PubMed] [Google Scholar]
- 59.Arany Z, He H, Lin J, Hoyer K, Handschin C, Toka O, et al. Transcriptional coactivator PGC-1 alpha controls the energy state and contractile function of cardiac muscle. Cell metabolism. 2005 Apr;1(4):259–71. doi: 10.1016/j.cmet.2005.03.002. [DOI] [PubMed] [Google Scholar]
- 60.Huss JM, Torra IP, Staels B, Giguere V, Kelly DP. Estrogen-related receptor alpha directs peroxisome proliferator-activated receptor alpha signaling in the transcriptional control of energy metabolism in cardiac and skeletal muscle. Mol Cell Biol. 2004 Oct;24(20):9079–91. doi: 10.1128/MCB.24.20.9079-9091.2004. [DOI] [PMC free article] [PubMed] [Google Scholar]
- 61.Lehman JJ, Boudina S, Banke NH, Sambandam N, Han X, Young DM, et al. The transcriptional coactivator PGC-1alpha is essential for maximal and efficient cardiac mitochondrial fatty acid oxidation and lipid homeostasis. Am J Physiol Heart Circ Physiol. 2008 Jul;295(1):H185–96. doi: 10.1152/ajpheart.00081.2008. [DOI] [PMC free article] [PubMed] [Google Scholar]
- 62.Rowe GC, Jiang A, Arany Z. PGC-1 coactivators in cardiac development and disease. Circ Res. 2010 Oct 1;107(7):825–38. doi: 10.1161/CIRCRESAHA.110.223818. [DOI] [PMC free article] [PubMed] [Google Scholar]
- 63.Sihag S, Cresci S, Li AY, Sucharov CC, Lehman JJ. PGC-1alpha and ERRalpha target gene downregulation is a signature of the failing human heart. J Mol Cell Cardiol. 2009 Feb;46(2):201–12. doi: 10.1016/j.yjmcc.2008.10.025. [DOI] [PMC free article] [PubMed] [Google Scholar]
- 64.Huss JM, Kelly DP. Nuclear receptor signaling and cardiac energetics. Circ Res. 2004 Sep 17;95(6):568–78. doi: 10.1161/01.RES.0000141774.29937.e3. [DOI] [PubMed] [Google Scholar]
- 65.Fernandez-Marcos PJ, Auwerx J. Regulation of PGC-1alpha, a nodal regulator of mitochondrial biogenesis. Am J Clin Nutr. 2011 Apr;93(4):884S–90. doi: 10.3945/ajcn.110.001917. [DOI] [PMC free article] [PubMed] [Google Scholar]
- 66.Ahuja P, Zhao P, Angelis E, Ruan H, Korge P, Olson A, et al. Myc controls transcriptional regulation of cardiac metabolism and mitochondrial biogenesis in response to pathological stress in mice. J Clin Invest. 2010 May;120(5):1494–505. doi: 10.1172/JCI38331. [DOI] [PMC free article] [PubMed] [Google Scholar]
- 67.Alvarez-Guardia D, Palomer X, Coll T, Davidson MM, Chan TO, Feldman AM, et al. The p65 subunit of NF-kappaB binds to PGC-1alpha, linking inflammation and metabolic disturbances in cardiac cells. Cardiovasc Res. 2010 Aug 1;87(3):449–58. doi: 10.1093/cvr/cvq080. [DOI] [PubMed] [Google Scholar]
- 68.Palomer X, Alvarez-Guardia D, Rodriguez-Calvo R, Coll T, Laguna JC, Davidson MM, et al. TNF-alpha reduces PGC-1alpha expression through NF-kappaB and p38 MAPK leading to increased glucose oxidation in a human cardiac cell model. Cardiovasc Res. 2009 Mar 1;81(4):703–12. doi: 10.1093/cvr/cvn327. [DOI] [PubMed] [Google Scholar]
- 69.Lin J, Wu PH, Tarr PT, Lindenberg KS, St-Pierre J, Zhang CY, et al. Defects in adaptive energy metabolism with CNS-linked hyperactivity in PGC-1alpha null mice. Cell. 2004 Oct 1;119(1):121–35. doi: 10.1016/j.cell.2004.09.013. [DOI] [PubMed] [Google Scholar]
- 70.Davidson DM. Cardiovascular effects of alcohol. West J Med. 1989 Oct;151(4):430–9. [PMC free article] [PubMed] [Google Scholar]
- 71.Regan TJ, Khan MI, Ettinger PO, Haider B, Lyons MM, Oldewurtel HA. Myocardial function and lipid metabolism in the chronic alcoholic animal. J Clin Invest. 1974 Sep;54(3):740–52. doi: 10.1172/JCI107812. [DOI] [PMC free article] [PubMed] [Google Scholar]
- 72.Rubin E. Alcoholic myopathy in heart and skeletal muscle. N Engl J Med. 1979;301:28–33. doi: 10.1056/NEJM197907053010107. [DOI] [PubMed] [Google Scholar]
- 73.Russell LK, Mansfield CM, Lehman JJ, Kovacs A, Courtois M, Saffitz JE, et al. Cardiac-specific induction of the transcriptional coactivator peroxisome proliferator-activated receptor gamma coactivator-1alpha promotes mitochondrial biogenesis and reversible cardiomyopathy in a developmental stage-dependent manner. Circ Res. 2004 Mar 5;94(4):525–33. doi: 10.1161/01.RES.0000117088.36577.EB. [DOI] [PubMed] [Google Scholar]