

Abstract
Schafmeister, Po, and Verdine (another study) introduced a method using a hydrocarbon linker (staple) to stabilize a peptide in a helical configuration. One intended goal of this scheme is to facilitate the delivery of peptide drugs into target cells. Here, we investigate whether stapled peptides are intrinsically membrane permeable, by performing a case study on a stapled 12-mer peptide named NYAD-1. We found that the native peptide CAI (an HIV-1 inhibitor) does not bind to lipid bilayers, however NYAD-1 indeed permeates through lipid bilayers even at low solution concentrations. To understand the reason for the membrane permeability, we investigated the physical properties of NYAD-1 as a function of bound peptide/lipid molar ratio P/L. We found that NYAD-1 spontaneously binds to a lipid bilayer. At low P/L, the peptide primarily binds on the polar-apolar interface with its helical axis parallel to the bilayer, which has the effect of stretching the membrane area and thinning the membrane. The membrane thinning reaches its maximum at P/L ∼1/15–1/12 in DOPC bilayers. Additional bound peptides have little thinning effect and their helical axes are normal to the plane of bilayers. Thus, the stapled peptide has a membrane interaction behavior similar to helical antimicrobial peptides, such as magainin and melittin. We emphasize that not all peptides that bind to lipid bilayers in the α-helical form behave this way.
Introduction
The lipid matrix of a cell membrane provides a hydrophobic barrier that defines the boundary of the cell. An intact membrane is crucial for cell function but it is also a major impediment for the delivery of therapeutic agents into cells. This is so even if the drug enters the cell by endocytosis—in such a case, the drug still needs to cross the endosomal membrane. In recent years a new type of drug technology called stapled peptides has been developed and adopted by the pharmaceutical industry. An all-hydrocarbon staple cross-links a peptide at i and i+4 or i+7 position to increase its α-helix propensity (1–7). The rationale for the stapled peptides is threefold (1): 1), stabilizing the peptide in a configuration that matches the binding site of the protein target, 2), protecting the peptide against proteolytic action, and 3), making the peptide membrane permeable. Although the functionality and stability of stapled peptides are understandable, it is not clear why the stapled helicity would facilitate cell uptake. Notably these stapled peptides bypass the Lipinski rules, which stipulate that the molecular mass of a drug should not exceed 500 Da (6,8). Stapled peptides are several times that size, and yet still traffic to the intracellular targets (2,4,7). The goal of our study is to investigate first, if the peptides indeed gain membrane permeability by the stapling modification, and second, if so what could be the underlying mechanism for the membrane permeation. We hope to provide a rational basis for the use of this new drug delivery technology. Understanding the mechanism for membrane permeation will facilitate the development of strategies for drug delivery.
We studied a stapled peptide called NYAD-1 based on a 12-mer peptide capsid assembly inhibitor (CAI) that has been found to target the capsid of human immunodeficiency virus type 1 (HIV-1). CAI inhibits HIV-1 assembly in vitro; however, it failed to inhibit HIV-1 in cell culture. The x-ray crystal structure of CAI in complex with the C-terminal domain of capsid revealed that the peptide adopts an α-helical conformation (4,9). Accordingly, Zhang et al. (4) used the hydrocarbon stapling technique (1–3) to convert CAI into a stable helical peptide named NYAD-1. Subsequently, the authors showed the anti-HIV-1 activity of NYAD-1 in cell culture and that the stapled peptide indeed targeted the C-terminal domain of capsid. However, cellular uptake is not a proof of self-permeation through the membrane. For example, cellular uptake of various cell-penetrating peptides has been widely reported, yet the mechanisms of cell-penetrating peptides are still being debated (10,11).
With a fluorescence-labeled NYAD-1 (named NYAD-2) we found that the peptide indeed permeates across lipid bilayers. To understand what properties of the peptide enable the membrane permeability, we studied NYAD-1mixed in lipid bilayers as a function of the peptide/lipid ratio. We compare the results with antimicrobial peptides and amyloid precursor peptides. We discuss the important properties of NYAD-1 that make the peptide membrane permeable.
Experiment
Materials
NYAD-1 is H - Ile - Thr - Phe - X - Asp - Leu - Leu - X - Tyr - Tyr - Gly - Pro - NH2 (with special cyclization to get double bond, X = (S) - alpha - (2′-pentenyl)alanine) (4). NYAD-1 and CAI (H-Ile-Thr-Phe-Glu-Asp-Leu-Leu-Asp-Tyr-Tyr-Gly-Pro-NH2) were synthesized by CPC Scientific (San Jose, CA) under the supervision of Xiaohe Tong, one of the authors of (4). NYAD-2 is FITC - (beta - Ala) - Ile - Thr - Phe - X - Asp - Leu - Leu - X - Tyr - Tyr - Gly - Pro - NH2 (with special cyclization to get double bond, X = (S) - alpha - (2′- pentenyl)alanine; FITC = fluorescein isothiocyanate) synthesized by AnaSpec (Fremont, CA). The chemical structures of NYAD-1 and NYAD-2 (4) are reproduced in Fig. 1. 1,2-dioleoyl-sn-glycero-3-phosphocholine (DOPC) and 1,2-dioleoyl-sn-glycero-3-phosphoethanolamine-N-(lissamine rhodamine B sulfonyl) (Rh-DOPE) were purchased from Avanti Polar Lipids (Alabaster, AL). Texas Red sulfonyl chloride (TRsc) (MW 625), Texas Red dextran (TRD) (MW 10,000), and calcein (MW 623) were purchased from Invitrogen (Grand Island, NY). Fluorescein PEG (MW 1000), was purchased from NANOCS (Boston, MA). All other chemicals were purchased from Sigma-Aldrich (St. Louis, MO) and were used without further purification. All experiments were performed at room temperature ∼25°C unless specified otherwise.
Figure 1.
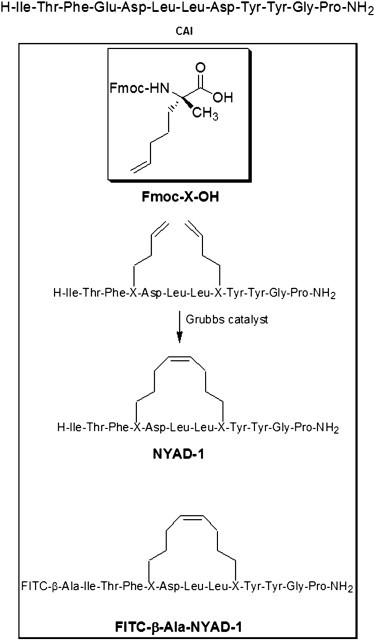
The sequence of CAI and, in the box, the synthesis of NYAD-1 and FITC-NYAD-1(also called NYAD-2), reproduced with permission from (4).
Giant unilamellar vesicles (GUVs) were produced by the electroformation method (12) in a production chamber containing a GUV interior solution. The solution includes ∼200 mM sugar (sucrose or glucose) to control the osmolality, a pH buffer and solution dyes if necessary. A typical GUV experiment was performed with GUVs containing ∼200 mM sucrose inside, in an outside solution of ∼200 mM glucose. The refractive index contrast between sucrose and glucose makes the GUVs visible and the density contrast makes the GUVs sink to the bottom of the solution for the ease of manipulation. The osmolalities of the solutions used for the GUV interior and GUV exterior were measured separately by a Wescor model 5520 dew-point Osmometer (Wescor, Logan, UT). Equiosmolality between the inside and outside of the GUV was the initial condition in all GUV experiments. To produce GUVs, DOPC or DOPC and 0.5% molar ratio of Rh-DOPE (for clear imaging) were dissolved in 1:1 (v/v) tetrafluoroethylene and chloroform. The lipid solution (∼0.05 mg lipid) was deposited onto two indium tin oxide (ITO)-coated glass coverslips. After drying under vacuum, an o-ring was sandwiched between the two ITO slips and the gap was filled with the interior solution. 3 V ac at 10 Hz was applied between the two ITO electrodes for 2 h. Subsequently, the frequency was adjusted to 5 Hz for 10 min and followed by 1 Hz for 10 min. This electroformation method has been shown to produce unilamellar large vesicles (12). The GUV suspension was then gently collected in a glass vial (reservoir). The vesicles were used within 24 h of production.
Aligned multilamellae of peptide/lipid mixtures were prepared by first dissolving the peptide and lipid at a chosen molar ratio, P/L, in 1:1 (v/v) tetrafluoroethylene and chloroform. The mixture was uniformly spread on a thoroughly cleaned fused-quartz substrate (0.018 mg peptide on a 1 cm2 quartz plate for P/L > 1/30; 0.3 mg of lipid on a 1 cm2 plate for P/L ≤ 1/30). After the solvent evaporated in vacuum, the sample was hydrated with saturated water vapor in a 37°C oven overnight. The results were well-aligned parallel bilayers, as proven by x-ray diffraction (XRD). During the experiment, the samples were housed in a temperature humidity chamber in which the hydration level of the sample was controlled by the relative humidity (RH) of water vapor (13).
Aspirated GUV experiment
The experimental setup for the aspirated GUV experiment was described in Sun et al (14). Before the experiment, micropipettes (with inner diameter 16–20 μm) and the walls of sample chambers were coated with 0.5% bovine serum albumin to dissipate the charge on the glass surface and then washed extensively with water. The micropipette was connected to an oil-filled U tube where a negative pressure was produced and controlled by reference to the atmosphere pressure (15).
A selected GUV (diameter ∼30–70 μm) in the reservoir was aspirated at a low constant negative pressure (∼100 Pa producing a membrane tension ∼0.4 mN/m) by a micropipette, and transferred via a transfer pipe (14) to an observation chamber where the solution contained the peptide. Note that CAI, NYAD-1, or NYAD-2 was added to the solution by first dissolving in dimethylsulfoxide (DMSO) (the DMSO concentration in the experimental chamber was 2 to 7 mM). It is known that DMSO permeates through lipid bilayers (16). To avoid the effect of DMSO on osmolality balance (16), the same concentration of DMSO was also added to the interior solution, so that the osmolality of the solution in the observation chamber was the same as in the GUV interior solution. The response of the GUV to the peptide binding was observed by a conventional inverted widefield microscope (IX81, Olympus, Tokyo, Japan) and recorded by a Hamamatsu Photonics digital CCD Camera (model C10600-10B) (Hamamatsu City, Japan), or by a confocal microscopy (Nikon C1 si-LU4A confocal spectral imaging system and Nikon C2 confocal laser point scanning system—Tokyo, Japan) with 488 nm/561 nm lasers (OBIS/Sapphire, Coherent, Santa Clara, CA).
In response to peptide binding, a GUV can potentially change its membrane area A and volume V. The GUV protrusion inside the micropipette serves as an amplifier for the measurement of such changes. From the microscopic images, the length of the protrusion, the radius of the micropipette, and the radius of the GUV were carefully measured. It is then straightforward to show , and (17). If there is no molecular leakage and as long as the inside and outside of the GUV have the same osmolality, there should be no change of volume. Under the condition ΔV = 0, ΔLp is directly proportional to ΔA: .
On the other hand, if peptides induce formation of transmembrane pores, the influx of glucose will be greater than the efflux of sucrose through the pores, because sucrose is approximately two times as large as glucose. The resultant osmolality imbalance induces a net water influx, causing a volume increase in the GUV (18). (Conversely if sucrose and glucose were exchanged, the GUV volume decreased (14).) If the membrane area is constant, the relation between ΔLp and ΔV is . Thus, if peptides induce pores in the membrane, the GUV protrusion length would decrease, , after the peptide binding has reached equilibrium (18,19).
GUV dye leakage experiment
For the leakage experiment, the GUV interior solution also contained 30 μM calcein and 50 μM TRD10,000. Two observation chambers containing the same solution 190 mM glucose and 10 mM HEPES pH 7 were set side by side. About 10 μL of the GUV suspension was injected into the first observation chamber and well mixed with the solution in the chamber by stirring. About 10 GUVs were transferred from the first to the second chamber via a transfer pipe. The purpose of this two-chamber procedure was to dilute the untrapped calcein and TRD in the solution external to the GUVs. In the second chamber, the GUVs settled at the bottom due to the density differential and were observed by a widefield microscope. The effect of peptide-induced leakage was observed by slowly injecting a small amount of exterior solution containing NYAD-1 into the chamber until the peptide concentration equal to 25 μM. Slow injection (for ∼30 s) was necessary to not create a flow in the observation chamber.
Peptide permeation experiment
We used FITC-labeled NYAD (called NYAD-2) to observe membrane permeation. Like many fluorescent dyes, the fluorescence intensity of NYAD-2 is pH dependent. In particular, we found that the intensity at pH 9 is 1.78 times higher than at pH 7. We decided to use this property to help measure the intensity of permeated NYAD-2 inside the GUV.
The permeation experiment was performed as follows. The interior solution for GUV production was 190 mM sucrose, 10 mM Tris at pH 9, 10 μM TRsc, and 2.82 mM DMSO. Two chambers each contained 190 mM glucose, 10 mM Tris at pH 7, and 2.82 mM DMSO were set side by side, one for control and one for observation. Only the observation chamber contained 2 μM NYAD-2. A GUV aspirated from the production chamber was first transferred to the control chamber to dilute the untrapped TRsc in the exterior solution, and then transferred to the observation chamber for observation under a confocal microscope. The image was recorded in two channels: 488 nm for FITC and 561 nm for TRsc. The recording time was 0.5 s every minute to avoid excessive photobleaching. A negative control was performed with the same conditions with NYAD-2 replaced by fluorescein PEG (1000).
For the pH 9 experiment, GUVs were produced in a solution containing 190 mM sucrose, 20 μM TRsc, 7 mM DMSO, and 10 mM Tris at pH 9. The solution in the observation chamber contained 190 mM glucose, 2 μM NYAD-2, 7 mM DMSO, 10 mM Tris at pH9. After GUVs were introduced into the observation chamber, the chamber was sealed to prevent water evaporation. This was necessary for a long permeation time. The images were taken every hour manually by refocusing the microscope because of the slight movement of the GUV.
The fluorescence intensities are corrected as follows. A background intensity from the confocal system, in the absence of the dye but with the same laser power, is subtracted from every intensity reading—this intensity is . The solution dye intensity, , outside the GUV was practically constant (with negligible photobleaching). This is because there was only one GUV (or ∼10 GUVs in the case pH 9 experiment) in a chamber of ∼700 μL; the total number of bound NYAD-2 is <10−6 (or 10−5) of the total in solution. Because of the imperfection of confocality, there is an influence of the dye on the GUV surface to the interior fluorescence intensity. This was estimated by comparing the interior intensities of GUVs with and without lipid dye (NBD-DOPE) on the surface. The interior intensity is increased by 4% of the intensity averaged over the GUV surface, . Similarly, the interior intensity is influenced by the external solution intensity, which was estimated by the interior reading with fluorescein PEG (1000) outside the GUV. The interior reading is 20% of the external reading. Thus, the intensity of GUV interior, , is corrected by 1), the system background, 2), the effect of surface intensity, and 3), the effect of outside intensity: . The corrected solution dye intensity outside of the GUV is .
XRD experiment
Multilamellar samples were measured in a temperature-humidity chamber (13). ω-2θ diffraction was collected on a four-circle Huber goniometer (Huber Diffraktionstechnik, Rimsting, Germany), with a vertical line-focused Cu Kα source (λ = 1.542 Å) operating at 35 kV and 15–30 mA. The incident beam was collimated by a horizontal soller slit and two vertical slits on the front and the back sides of the soller slit. The horizontal and vertical divergences of the incident beam were 0.23° and 0.3°, respectively. The diffracted beam first passed through a vertical slit and then was discriminated by a bent graphite monochromator (selected for 1.542 Å) before entering a scintillation detector. Thus, the detector excluded Compton scattering, fluorescence, and most of the x-rays from air scattering. This diffractometer was designed to minimize the background signal, thus allowing the measurement of high diffraction orders.
Before the measurement, the aligned multilayer sample was carefully positioned at the center of the x-ray beam and was oriented so that ω = 0° and θ = 0° coincided. We have established an elaborate routine for positioning and orienting the sample as described in Wu et al. (20). A two-dimensional ω-θ scan around the second or the third Bragg order was used to check the alignment of the ω-angle and the mosaic of the multilayers alignment. Typically, the full width at half-maximum of the peak on the ω axis (of the ω-θ scan) was 0.2–0.3° (example in (21)). Once the sample was properly positioned and aligned on the diffractometer, each ω-2θ scan was performed from ω = 0.5° to ω = 7.5° with a step size of Δω = 0.01°. An attenuator was used to prevent the first-order Bragg peak from saturating the detector. The scan was repeated 2–3 times at each of several hydration levels and averaged at each hydration level for data analysis. Measurements at several hydration levels were for the purpose of phase determination by the swelling method. Only the results of 98–100% RH are reported. (Note that the readings of commercial humidity sensors are not accurate above 98% RH; we used the maximum RH above which the membrane samples would flow.)
The procedure of data reduction was described in many of our previous works (22,23). Briefly, the measured diffraction intensity was first corrected for the attenuator absorption and for the detector’s dead-time factor. After removing the background, data were corrected for sample absorption and diffraction volume. The integrated peak intensities were then corrected for the polarization and the Lorentz factors. The relative magnitude of the diffraction amplitude was the square root of the integrated intensity. With their phases determined by the swelling method, the diffraction amplitudes were used to reconstruct the electron density profile of the bilayer. Across the bilayer profile, the phosphate peak to phosphate peak distance (PtP) was measured for the bilayer thickness. Measurements by the previously described procedure have been applied to various peptide-lipid mixtures for more than a decade, e.g., (20,21,23).
Oriented circular dichroism (OCD)
CD spectra were measured in a Jasco (Tokyo, Japan) J-810 Spectropolarimeter. Aligned multilamellar samples of NYAD-1 in DOPC bilayers were kept fully hydrated in a humidity chamber with quartz windows. The substrates were oriented normal to the incident light for the measurement of OCD (24). Each sample was measured at least 5 times and averaged. The background spectrum for each sample was measured for the same amount of lipid on the same substrate. After the background correction, the spectra of different P/L were normalized by the amount of peptide.
For comparison, a solution CD of NYAD-1 was measured in Tris buffer pH 8 in the presence of 35% (v/v) acetonitrile at a final peptide concentration of 424 μM (following the protocol given in (4)). (Note that DMSO absorbs ultraviolet, not usable for CD measurement.)
Results
Aspirated GUV experiment
Aspirated GUV experiment is useful for understanding the general behavior of a new membrane-acting molecule. To begin, if the molecule binds to lipid bilayers, we can expect an expansion of the membrane area. The consequence of molecular binding may vary. The molecule could simply incorporate into the lipid bilayer, e.g., curcumin(16). The molecule could form pores in the membrane, e.g., melittin (19). The molecule could turn into aggregates, e.g., penetratin (25). The molecule could extract lipid molecules from the bilayer, e.g., tea catechin (14). These general characteristics of interaction with membranes have been shown for a great variety of lipid compositions, with the only differences in the P/L dependence (26). Thus, we have arbitrarily chosen DOPC for our investigation. The initial experiment with an aspirated GUV was to provide a qualitative understanding of how NYAD interacts with membranes. We observed what happened to the membrane exposed to NYAD. Equally important was what did not happen to the GUV, for example peptide-lipid aggregates on the GUV surface.
Fig. 2 shows separately the responses of a DOPC GUV to CAI, NYAD-1, and NYAD-2 all at the same concentration 8 μM in pH 7 solutions. There was no indication of CAI binding to the GUV over a long time (Fig. 2 A). The very slow increase of the protrusion length was the same as in a control run with no peptide (see Fig. 2 D). The background increase (in the absence of peptides) was caused by a slow increase of osmolality in the exterior solution due to water evaporation. A higher osmolality in the exterior solution caused an efflux of water from the GUV. A decrease of GUV volume at constant membrane area caused an increase of the protrusion length. This background protrusion length increase is added to the protrusion length increase caused by peptide binding. We normally design our experiment to finish within a few minutes to avoid this complication (for example, using anionic lipids to increase the binding rate to cationic peptides). Here, we let the experiment last for 30 min to make sure there is no membrane binding by CAI. The experiment with CAI was repeated many times at different peptide concentrations (highest 40 μM) with the same result, all similar to control runs. The conclusion is that CAI has negligible binding affinity to lipid bilayers.
Figure 2.
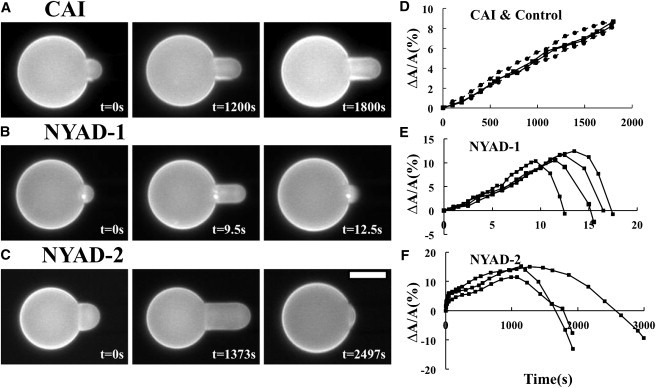
An aspirated GUV of DOPC (and 0.5% molar ratio of Rh-DOPE) was introduced into a solution containing 8 μM CAI (A), 8 μM NYAD-1 (B), or 8 μM NYAD-2 (C) at pH 7. The length of the GUV protrusion into the micropipette, , was measured at regular time intervals. For the purpose of comparison, was converted to the fractional area change by the relation . (A) With CAI, the protrusion length increase is similar to the control runs without peptides, as shown in (D). (B and C) With NYAD-1/NYAD-2, the protrusion length increased initially. After the protrusion length reached a maximum, it steadily decreased; this indicates pore formation. Scale bar = 25 μm. Experiments A, B, and C were repeated several times with similar results. (D) The protrusion length change was converted to for CAI (square dots, solid lines) compared with controls (round dots and dashed lines)—2 runs are shown for each. The osmolalities of the internal and external solutions of GUVs were initially balanced. The protrusion length increase in a control was due to water evaporation from the external solution. (E) vs. time for 4 runs of the NYAD-1 experiment. (F) vs. time for 3 runs of the NYAD-2 experiment. In (E and F), a decreasing is used to indicate pore formation, not a decrease in membrane area.
In the presence of 8 μM NYAD-1, the protrusion length increased and reached a maximum within 15 s (Fig. 2 B and Fig. 2 E). This membrane area increase implies peptide binding. After reaching the maximum, the protrusion length decreased indicating that pores were formed in the membrane as explained in the Experiment section. Although the cause of the protrusion length decrease was due to pore formation, the beginning of pore formation was not coincidental with the point of maximum protrusion length. Because of the continuing peptide binding, which continued to increase the protrusion length, the protrusion length did not immediately decrease as soon as pores appeared.
The same experiment was repeated for NYAD-2 (Fig. 2 C) to show that the FITC label on NYAD-1 did not alter the peptide’s characteristic property (Fig. 2, E and F). The modification by the FITC label slowed the action of the peptide considerably, indicating a lower binding affinity to the bilayer (note the timescale). Nevertheless, NYAD-2 also caused the protrusion length to increase to a maximum followed by a steady decrease, showing its pore forming capability.
Dye leakage experiment
This experiment was performed to confirm the observation of pore formation in aspirated GUVs. Fig. 3 shows molecular leakage induced by NYAD-1 at high concentrations. A GUV containing green dye calcein (MW 623) and red dye TRD (MW 10,000) was transferred to the observation chamber. NYAD-1 dissolved in the external solution was slowly injected into the observation chamber until its final concentration was 25 μM. After a while both dyes were observed to leak out, whereas the GUV membrane remained intact (Fig. 3). The time of leakage depended on the position of the injector relative to the GUV and the speed of injection.
Figure 3.
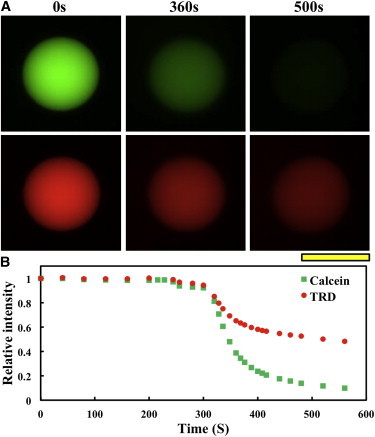
A GUV (DOPC) containing green dye calcein (MW 623) and red dye TRD (MW 10,000) was in a solution of pH 7. NYAD-1 was injected slowly (a duration of ∼30 s) into the solution until it reached 25 μM. Time zero was at the beginning of peptide injection. The time of leakage depended on the distance between the injector and the GUV and the speed of injection; it should not be compared with Fig. 2B. Both dyes started to leak out at the same time. Scale bar = 50 μm.
Understandably, the leakage of calcein was faster than TRD10,000 due to the difference in molecular weight. When the same leakage experiment was performed with antimicrobial peptide magainin, the pores at first allowed both large and small dye molecules to leak out but after a while only small molecules continued to leak out, implying a pore size reduction with time (27). It is not clear from our leakage curves whether the large dye would leak out completely. The pore size kinetics was not pursued, because it is probably of no interest to the therapeutic use of NYAD-1 at much lower concentrations.
NYAD permeation experiment
Because NYAD peptide forms pores at high concentrations, the permeation experiment was conducted at a low peptide concentration, 2 μM, to avoid pore formation. However, the fluorescence intensity of NYAD-2 at this concentration was too weak for the permeation measurement. We tested and found that the fluorescence intensity of NYAD-2 at pH 9 is 1.78 times higher than at pH 7. To make use of this pH effect, we produced GUVs with a pH 9 solution in the lumen and performed the permeability experiment in pH 7 solutions.
An aspirated GUV was first imaged in the control chamber (which contained no NYAD-2) right before it was transferred to the observation chamber. It took ∼1.5 min to readjust the confocal focus after the transfer. Therefore, the first fluorescence measurement was taken ∼1.5 min after the GUV was exposed to 2 μM NYAD-2. The time sequence of images is shown in Fig. 4 A. The protrusion length increased without any sign of decrease, indicating peptide binding without molecular leakage. The absence of molecular leakage was reconfirmed by the constant intensity of TRsc inside the GUV (Fig. 4 B). The steady increase of the FITC fluorescence intensity inside the GUV clearly indicates permeation of NYAD-2 through the GUV membrane. However, after the normalization by the effect of pH 9 (i.e., dividing the corrected inside intensity by 1.78), we were surprised to find the normalized intensity of NYAD-2 inside the GUV greater than the intensity outside after ∼30 min (Fig. 4 B).
Figure 4.
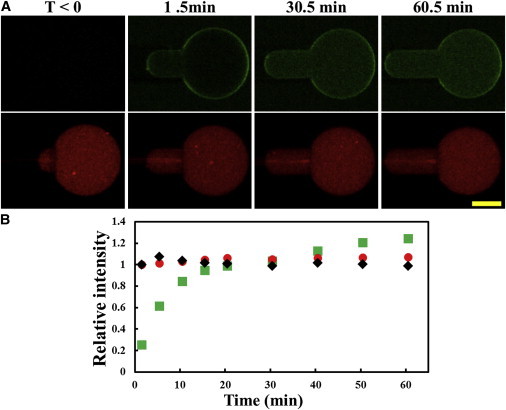
(A) Confocal images of an aspirated GUV (DOPC) containing a pH 9 solution and 10 μM TRsc (red) in the lumen, first in the control chamber (t < 0) and then transferred to the observation chamber (time 0) containing a solution of 2 μM NYAD-2 (green) at pH 7. The binding of NYAD-2 (the green intensity on the GUV boundary increased with time) caused the membrane expansion (protrusion length increase) with no molecular leakage. (The bright, thin, horizontal red bar on the micropipette was an optical artifact.) Scale bar = 20 μm. (B) Relative intensities of fluorescence: Red for TRsc inside the GUV (normalized to one at t = 0); Black for the corrected solution intensity of NYAD-2 outside the GUV, (also normalized to one at time = 0); Green for the corrected intensity of NYAD-2 inside the GUV divided by the corrected intensity outside averaged over time, (and divided by 1.78 due to the pH 9 effect): . Note that the corrected intensity inside the GUV exceeded the corrected outside intensity after ∼30 min.
This unusual phenomenon could be explained by a possible pH-effect on the concentration dependence of the chemical potential. If the peptide can permeate through the membrane, the chemical potential of NYAD-2 will approach an equal value inside and outside. However, the concentration dependence of the chemical potential could be different for pH 7 and pH 9.
We also performed a permeation experiment with a pH 9 solution both inside and outside of GUV, so that there was no differential pH effect. Fig. 5 shows the result. Clearly the fluorescence intensity of NYAD-2 inside the GUV increased with time and it approached ∼60% of the outside intensity after ∼7 h, whereas the fluorescence intensity of the interior dye TRsc was constant. NYAD-2 permeated through the lipid bilayer without causing molecular leakage. We did not feel it was necessary to continue this manual experiment any longer to prove the permeation of NYAD-2. For a negative control, the pH 7-pH 9 permeation experiment was performed with fluorescein PEG (1000) replacing NYAD-2. As expected, no fluorescein PEG was detected inside the GUV.
Figure 5.
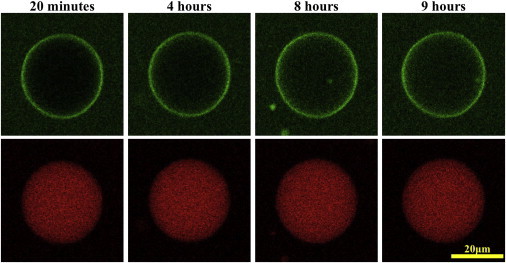
Peptide permeation experiment in a pH 9 solution both inside and outside the GUV (DOPC). The top row shows the green channel images for the intensity of NYAD-2, and the bottom row the red channel for the intensity of TRsc. The observation chamber was sealed to keep the water from evaporation (hence no micropipette aspiration). The TRsc intensity was essentially constant in 7 h. The inside to outside intensity ratios for NYAD-2, , increased from a few percent in the first image to ∼60% after ∼7 h.
Membrane thinning by NYAD-1 binding
Electron density profiles obtained by XRD show that the peptide-lipid mixtures formed well-defined lipid bilayers (Fig. 6, A and B). The electron density of the peptides did not show up in the diffraction-constructed profiles, because the peptide positions were not correlated from bilayer to bilayer (diffraction is the result of electron density correlations (28)). The most important effect of peptide binding is measured by the phosphate peak to phosphate peak distance across the bilayer (PtP). PtP is a measure of the bilayer thickness. It decreases more or less linearly with P/L up to a value P/L* between 1/15 and 1/12, and levels off for P/L > P/L* (Fig. 6 C). Previous studies with antimicrobial peptides (AMPs) (29,30) showed that AMPs caused a linear decrease of PtP with P/L and followed by a PtP leveling off, similar to NYAD-1. Neutron in-plane scattering showed that transmembrane pores were formed in the bilayers for P/L > P/L* but no pores were detected for P/L < P/L* (31–33). Thus, for AMPs, P/L* is the threshold concentration for pore formation.
Figure 6.
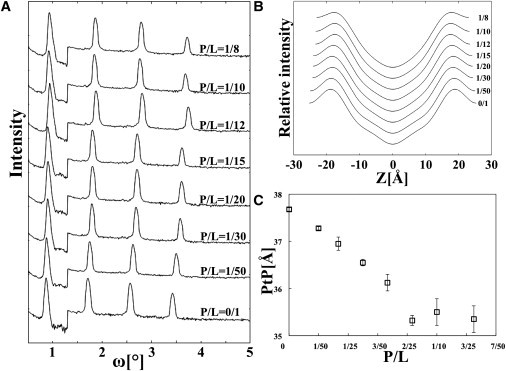
X-ray lamellar diffraction of NYAD-1/DOPC mixtures in a series of P/L. (A) Raw data of the diffraction patterns. (B) Electron density profiles of the bilayers: Z is the distance from the bilayer center. (C) The phosphate peak to phosphate peak distance across the bilayer, PtP, measured for a series of P/L. The error bars are that of reproducibility using two to three independently prepared samples.
Membrane thinning in proportion to P/L implies that peptides bind on the bilayer interface. Due to the near incompressibility of the hydrocarbon volume in the chain region of lipid bilayer (34), the area expansion is accompanied by a corresponding membrane thinning. Thus, the linear thinning detected by x-ray corresponds to the initial membrane expansion detected in the aspirated GUV experiment.
OCD measurement
Although NYAD-1 is only 12 amino-acids long, its solution CD is no different from a normal α-helical spectrum (Fig. 7). Its OCD spectra are also similar to that of longer peptides (Fig. 7). The method of OCD was explained in great detail in Wu et al. (24). The most prominent feature for α-helices is the orientation dependence of the π-π* transition near 208 nm. The electric transition dipole for this band is polarized along the helical axis, therefore the band magnitude is largest when the helices are perpendicular to the light or parallel to the plane of membrane and vanishes when the helices are in the direction of light or perpendicular to membrane (24). The magnitude of the n-π* transition near 224 nm also decreases (but not vanishes), because the helices change from parallel to perpendicular orientation relative to the plane of membrane. Fig. 7 shows that for all values of P/L ≤ 1/20, the OCD spectra of NYAD-1 are identical and have the largest 208 nm amplitude (compared with the OCD at higher P/Ls), consistent with the peptide helices being parallel to the bilayer at low P/Ls. The decrease of 208 nm amplitude for P/L ≥ 1/15 indicate that a fraction of NYAD-1 helices changed to normal orientation, and this fraction increased with P/L. The transition point where a fraction of helices begin to change orientation from parallel to perpendicular is between P/L = 1/20 and 1/15, which is reasonably close to the membrane thinning transition point (P/L between 1/15 and 1/12) where membrane thinning levels off (Fig. 6 C). In many other peptide experiments, we found that these two transition points were in agreement within experimental errors (29,30,35).
Figure 7.
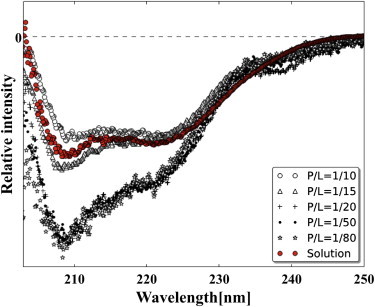
OCD of NYAD-1 in a series of P/L and a solution CD for comparison. OCD spectra are mutually normalized to the same amount of peptide; the solution CD (red) was superimposed by matching a long wavelength region to the OCDs. The OCD spectra imply that the NYAD-1 helices are parallel to the bilayer for P/L ≤ 1/20. A fraction of NYAD-1 helices are oriented normal to the bilayer for P/L ≥ 1/15.
Note that a solution CD is the orientational average of the OCD spectra and is equivalent to a mixture of 1/3 of helices normal to the bilayer and 2/3 of helices parallel to the bilayer (this was proven both theoretically and experimentally in (24)). The shape of the solution CD is between the OCD spectra at P/L = 1/15 and 1/10.
Discussion
These experimental methods have been used in the past to discover at least four different types of membrane-active molecules. Our intention is to compare NYAD-1 with them. Curcumin induces a nonlinear membrane thinning as a function of P/L; its binding states are a combination of interfacial state and chain insertion state; it has no other effects on the membrane (16,36). Tea catechin induces a linear membrane thinning; it binds only to the interface of membranes but also solubilizes the lipid molecules (14). Amyloid peptide penetratin binds to membranes as an α-helix and induces a linear membrane thinning until P/L reaches a critical value P/L*; additional peptide binding (P/L > P/L*) would turn the peptides into β-sheet aggregates and come off the external surface of GUV (25,35). AMPs induce a linear membrane thinning until P/L reaches P/L*; additional peptide binding (P/L > P/L*) causes pore formation. Clearly, the membrane interaction behavior of NYAD-1 is closely similar to AMPs.
First, we found that both NYAD-1 and NYAD-2 bound to the lipid bilayer and expanded the membrane area, whereas the native peptide CAI did not. To distinguish whether the peptide binding is on the bilayer’s polar-apolar interface or into the lipid chain region, we performed XRD experiment. The result showed that the membrane thickness decreased linearly in proportion to P/L. This implies that the initial binding is on the bilayer interface. However, when P/L exceeds P/L*, the membrane thinning levels off, exactly in the same manner as AMPs. The dye leakage experiment showed that NYAD-1 formed pores in the membrane but left the GUV intact.
A method for measuring membrane permeability
To detect the membrane permeability of NYAD, we used the dye-labeled NYAD-2, which we have shown to have the same membrane interaction as NYAD-1, i.e., binding to the membrane and causing membrane leakage at high P/L. To overcome the weak fluorescence intensity in low concentrations (e.g., 2 μM), we exploited the pH dependence of FITC fluorescence whose intensity at pH 9 is 1.78 times higher than at pH 7. A previous experiment by Zhou and Raphael (37) showed there was little change in the bilayer elastic properties between pH 7 and pH 9.
The peptide permeation experiment was performed by introducing GUVs containing a pH 9 solution into a solution of NYAD-2 at pH 7. The result (Fig. 4 A) clearly shows that NYAD-2 peptides permeated through the membrane, whereas the integrity of the membrane was assured by no decrease of the GUV protrusion length (see the Experimental section on aspirated GUVs) and no leakage of TRsc. Permeation was also demonstrated with pH 9 solutions both inside and outside of the GUV, in the absence of differential pH effect. This method of membrane permeability measurement could be useful for other membrane-active molecules.
Membrane-bound states and membrane permeability
At low concentrations, the membrane-bound state of NYAD-1 is on the bilayer interface. Nevertheless, the peptide can translocate across the bilayer. Thus, we conclude that the hydrocarbon-stapling has imparted three essential characteristics to NYAD-1 that are relevant to its membrane permeability. First, the hydrocarbon link provides an amphiphathic molecular surface to the otherwise hydrophilic peptide. CAI has negligible binding affinity to lipid bilayers, whereas NYAD-1 has a strong affinity for membrane binding. Second, NYAD-1 has a membrane interacting property similar to AMPs. Third, the hydrocarbon stapling prevents the peptide from turning into β-sheet aggregates; the possibility of forming amyloids could deprive a peptide of its membrane permeability, as in the case of penetratin (25,35).
Acknowledgments
This work was supported by National Institutes of Health (NIH) (US) grant GM55203 and by the Robert A. Welch Foundation grant C-0991.
References
- 1.Schafmeister C.E., Po J., Verdine G.L. An all-hydrocarbon cross-linking system for enhancing the helicity and metabolic stability of peptides. J. Am. Chem. Soc. 2000;122:5891–5892. [Google Scholar]
- 2.Walensky L.D., Kung A.L., Korsmeyer S.J. Activation of apoptosis in vivo by a hydrocarbon-stapled BH3 helix. Science. 2004;305:1466–1470. doi: 10.1126/science.1099191. [DOI] [PMC free article] [PubMed] [Google Scholar]
- 3.Bernal F., Tyler A.F., Verdine G.L. Reactivation of the p53 tumor suppressor pathway by a stapled p53 peptide. J. Am. Chem. Soc. 2007;129:2456–2457. doi: 10.1021/ja0693587. [DOI] [PMC free article] [PubMed] [Google Scholar]
- 4.Zhang H., Zhao Q., Debnath A.K. A cell-penetrating helical peptide as a potential HIV-1 inhibitor. J. Mol. Biol. 2008;378:565–580. doi: 10.1016/j.jmb.2008.02.066. [DOI] [PMC free article] [PubMed] [Google Scholar]
- 5.Kutchukian P.S., Yang J.S., Shakhnovich E.I. All-atom model for stabilization of alpha-helical structure in peptides by hydrocarbon staples. J. Am. Chem. Soc. 2009;131:4622–4627. doi: 10.1021/ja805037p. [DOI] [PMC free article] [PubMed] [Google Scholar]
- 6.Arora P.S., Ansari A.Z. Chemical biology: A Notch above other inhibitors. Nature. 2009;462:171–173. doi: 10.1038/462171a. [DOI] [PubMed] [Google Scholar]
- 7.Moellering R.E., Cornejo M., Bradner J.E. Direct inhibition of the NOTCH transcription factor complex. Nature. 2009;462:182–188. doi: 10.1038/nature08543. [DOI] [PMC free article] [PubMed] [Google Scholar]
- 8.Lipinski C.A., Lombardo F., Feeney P.J. Experimental and computational approaches to estimate solubility and permeability in drug discovery and development settings. Adv. Drug Deliv. Rev. 2001;46:3–26. doi: 10.1016/s0169-409x(00)00129-0. [DOI] [PubMed] [Google Scholar]
- 9.Ternois F., Sticht J., Rey F.A. The HIV-1 capsid protein C-terminal domain in complex with a virus assembly inhibitor. Nat. Struct. Mol. Biol. 2005;12:678–682. doi: 10.1038/nsmb967. [DOI] [PubMed] [Google Scholar]
- 10.Yang S.T., Zaitseva E., Melikov K. Cell-penetrating peptide induces leaky fusion of liposomes containing late endosome-specific anionic lipid. Biophys. J. 2010;99:2525–2533. doi: 10.1016/j.bpj.2010.08.029. [DOI] [PMC free article] [PubMed] [Google Scholar]
- 11.Madani F., Lindberg S., Gräslund A. Mechanisms of cellular uptake of cell-penetrating peptides. J. Biophys. 2011;2011:414729. doi: 10.1155/2011/414729. [DOI] [PMC free article] [PubMed] [Google Scholar]
- 12.Angelova M.I. Liposome electroformation. In: Luisi P.L., Walde P., editors. Giant Vesicles. John Wiley & Sons; Chichester: 2000. pp. 27–36. [Google Scholar]
- 13.Yang L., Huang H.W. A rhombohedral phase of lipid containing a membrane fusion intermediate structure. Biophys. J. 2003;84:1808–1817. doi: 10.1016/S0006-3495(03)74988-1. [DOI] [PMC free article] [PubMed] [Google Scholar]
- 14.Sun Y., Hung W.C., Huang H.W. Interaction of tea catechin (-)-epigallocatechin gallate with lipid bilayers. Biophys. J. 2009;96:1026–1035. doi: 10.1016/j.bpj.2008.11.007. [DOI] [PMC free article] [PubMed] [Google Scholar]
- 15.Fygenson D.K., Elbaum M., Libchaber A. Microtubules and vesicles under controlled tension. Phys. Rev. E Stat. Phys. Plasmas Fluids Relat. Interdiscip. Topics. 1997;55:850–859. [Google Scholar]
- 16.Sun Y., Lee C.C., Huang H.W. The bound states of amphipathic drugs in lipid bilayers: study of curcumin. Biophys. J. 2008;95:2318–2324. doi: 10.1529/biophysj.108.133736. [DOI] [PMC free article] [PubMed] [Google Scholar]
- 17.Kwok R., Evans E. Thermoelasticity of large lecithin bilayer vesicles. Biophys. J. 1981;35:637–652. doi: 10.1016/S0006-3495(81)84817-5. [DOI] [PMC free article] [PubMed] [Google Scholar]
- 18.Longo M.L., Waring A.J., Hammer D.A. Area expansion and permeation of phospholipid membrane bilayer by influenza fusion peptides and melittin. Langmuir. 1998;14:2385–2395. [Google Scholar]
- 19.Lee M.T., Hung W.C., Huang H.W. Mechanism and kinetics of pore formation in membranes by water-soluble amphipathic peptides. Proc. Natl. Acad. Sci. USA. 2008;105:5087–5092. doi: 10.1073/pnas.0710625105. [DOI] [PMC free article] [PubMed] [Google Scholar]
- 20.Wu Y., He K., Huang H.W. X-ray diffraction study of lipid bilayer membranes interacting with amphiphilic helical peptides: diphytanoyl phosphatidylcholine with alamethicin at low concentrations. Biophys. J. 1995;68:2361–2369. doi: 10.1016/S0006-3495(95)80418-2. [DOI] [PMC free article] [PubMed] [Google Scholar]
- 21.Weiss T.M., van der Wel P.C., Huang H.W. Hydrophobic mismatch between helices and lipid bilayers. Biophys. J. 2003;84:379–385. doi: 10.1016/S0006-3495(03)74858-9. [DOI] [PMC free article] [PubMed] [Google Scholar]
- 22.Olah G.A., Huang H.W., Wu Y.L. Location of ion-binding sites in the gramicidin channel by X-ray diffraction. J. Mol. Biol. 1991;218:847–858. doi: 10.1016/0022-2836(91)90272-8. [DOI] [PubMed] [Google Scholar]
- 23.Harroun T.A., Heller W.T., Huang H.W. Experimental evidence for hydrophobic matching and membrane-mediated interactions in lipid bilayers containing gramicidin. Biophys. J. 1999;76:937–945. doi: 10.1016/S0006-3495(99)77257-7. [DOI] [PMC free article] [PubMed] [Google Scholar]
- 24.Wu Y., Huang H.W., Olah G.A. Method of oriented circular dichroism. Biophys. J. 1990;57:797–806. doi: 10.1016/S0006-3495(90)82599-6. [DOI] [PMC free article] [PubMed] [Google Scholar]
- 25.Sun Y., Lee C.C., Huang H.W. Kinetic process of beta-amyloid formation via membrane binding. Biophys. J. 2010;99:544–552. doi: 10.1016/j.bpj.2010.04.045. [DOI] [PMC free article] [PubMed] [Google Scholar]
- 26.Lee M.T., Hung W.C., Huang H.W. Many-body effect of antimicrobial peptides: on the correlation between lipid’s spontaneous curvature and pore formation. Biophys. J. 2005;89:4006–4016. doi: 10.1529/biophysj.105.068080. [DOI] [PMC free article] [PubMed] [Google Scholar]
- 27.Tamba Y., Ariyama H., Yamazaki M. Kinetic pathway of antimicrobial peptide magainin 2-induced pore formation in lipid membranes. J. Phys. Chem. B. 2010;114:12018–12026. doi: 10.1021/jp104527y. [DOI] [PubMed] [Google Scholar]
- 28.Warren B.E. Dover Publications; Mineola, New York: 1990. X-ray Diffraction. [Google Scholar]
- 29.Huang H.W. Molecular mechanism of antimicrobial peptides: the origin of cooperativity. Biochim. Biophys. Acta. 2006;1758:1292–1302. doi: 10.1016/j.bbamem.2006.02.001. [DOI] [PubMed] [Google Scholar]
- 30.Lee C.C., Sun Y., Huang H.W. Transmembrane pores formed by human antimicrobial peptide LL-37. Biophys. J. 2011;100:1688–1696. doi: 10.1016/j.bpj.2011.02.018. [DOI] [PMC free article] [PubMed] [Google Scholar]
- 31.He K., Ludtke S.J., Huang H.W. Neutron scattering in the plane of membranes: structure of alamethicin pores. Biophys. J. 1996;70:2659–2666. doi: 10.1016/S0006-3495(96)79835-1. [DOI] [PMC free article] [PubMed] [Google Scholar]
- 32.Ludtke S.J., He K., Huang H.W. Membrane pores induced by magainin. Biochemistry. 1996;35:13723–13728. doi: 10.1021/bi9620621. [DOI] [PubMed] [Google Scholar]
- 33.Yang L., Harroun T.A., Huang H.W. Barrel-stave model or toroidal model? A case study on melittin pores. Biophys. J. 2001;81:1475–1485. doi: 10.1016/S0006-3495(01)75802-X. [DOI] [PMC free article] [PubMed] [Google Scholar]
- 34.Seemann H., Winter R. Volumetric properties, compressibilities, and volume flucturations in phospholipid-cholesterol bilayers. Z. Phys. Chem. 2003;217:831–846. [Google Scholar]
- 35.Lee C.C., Sun Y., Huang H.W. Membrane-mediated peptide conformation change from alpha-monomers to beta-aggregates. Biophys. J. 2010;98:2236–2245. doi: 10.1016/j.bpj.2010.02.001. [DOI] [PMC free article] [PubMed] [Google Scholar]
- 36.Hung W.C., Chen F.Y., Huang H.W. Membrane-thinning effect of curcumin. Biophys. J. 2008;94:4331–4338. doi: 10.1529/biophysj.107.126888. [DOI] [PMC free article] [PubMed] [Google Scholar]
- 37.Zhou Y., Raphael R.M. Solution pH alters mechanical and electrical properties of phosphatidylcholine membranes: relation between interfacial electrostatics, intramembrane potential, and bending elasticity. Biophys. J. 2007;92:2451–2462. doi: 10.1529/biophysj.106.096362. [DOI] [PMC free article] [PubMed] [Google Scholar]