

Abstract
DNA recognition by DNA-binding proteins (DBPs), which is a pivotal event in most gene regulatory processes, is often preceded by an extensive search for the correct site. A facilitated diffusion process in which a DBP combines three-dimensional diffusion in solution with one-dimensional sliding along DNA has been suggested to explain how proteins can locate their target sites on DNA much faster than predicted by three-dimensional diffusion alone. Although experimental and theoretical studies have recently advanced understanding of the biophysical principles underlying the search mechanism, the process under in vivo cellular conditions is poorly understood. In this study, we used various computational approaches to explore how the presence of obstacle proteins on the DNA influences search efficiency. At a low obstacle occupancy (i.e., when few obstacles occupy sites on the DNA), sliding by the searching DBP may be confined, which may impair search efficiency. The obstacles, however, can be bypassed during hopping events, and the number of bypasses is larger for higher obstacle occupancies. Dynamism on the part of the obstacles may even further facilitate search kinetics. Our study shows that the nature and efficiency of the search process may be governed not only by the intrinsic properties of the DBP and the salt concentration of the medium, but also by the in vivo association of DNA with other macromolecular obstacles, their location, and occupancy.
Introduction
DNA binding proteins (DBPs) mediate cellular gene expression and regulation by rapidly and specifically binding to DNA sites in the genome (1). DNA target localization by proteins may exceed the diffusion limit by two orders of magnitude, as was observed in vitro for the lac repressor (2). To explain this phenomenon, the theory of facilitated diffusion (3,4) suggested that DBPs use a reduced dimensionality search process involving three-dimensional (3D) diffusion in solution and one-dimensional (1D) sliding along DNA. Such 1D movement of proteins along DNA is enabled through electrostatic attraction between the positively charged patches common in DBPs (5) and the negatively charged backbone of DNA. This attraction typically results in a transient nonspecific protein-DNA association, with affinities that strongly depend on the salt concentration and that can be several orders of magnitude lower than the affinities to the specific DNA target sites (6).
Early evidence from ensemble studies that focused on endonuclease activity provided important indirect evidence for the ability of proteins to move one-dimensionally along DNA (7,8). More recently, NMR (9), single-molecule studies (10), and in vivo evidence (11,12) have demonstrated that a combination of 1D and 3D motions is indeed common in many DBPs and have further elucidated the mechanism and kinetics of 1D motion along DNA. In particular, it is now accepted that proteins may track the DNA backbone when they helically slide along the major groove (13,14) or may perform microscopic hopping from one site to another.
Despite considerable theoretical (15–21) and experimental efforts, researchers have yet to obtain a detailed description and understanding of the possible effects of macromolecular crowding and of the presence of obstacles on the properties and quality of 1D movement along DNA, and the overall efficiency of DNA search by proteins is still poorly understood (22–24). A particularly puzzling issue is how proteins that slide along DNA stretch in a rotation-coupled manner (13) to overcome obstacles, such as statically bound nucleosomes in eukaryotes (25–27), nucleoid proteins in bacteria (28), or other nonspecifically bound DBPs that may diffuse independently along the DNA (22,29). DNA coverage by DBPs is high—indeed, they are estimated to cover ∼30% of genomic prokaryotic DNA (28,30) and a much higher percentage of eukaryotic DNA (31). In the yeast genome, the presence of obstacles results in the average nucleosomal spacer region length between obstacles ∼10–40 bp (25). The presence of obstacles may interfere with the 1D motion of DBPs along DNA. Although several theoretical studies suggested that increasing the number of obstacles occupying sites on the DNA increases the search time for a specific target (22,32), several experiments demonstrated that obstacles could be bypassed under certain conditions. Specifically, proteins that employ more hopping in their 1D DNA search can bypass obstacles as large as nucleosomes (33) or other DBPs (34,35). By contrast, proteins that slide can be blocked by nucleosomes or even by DNA deformations (33,35).
Here, our purpose is to understand the consequences that DNA coverage by obstacles has for the mechanism and kinetics of 1D DBP searches of DNA. Using coarse-grained molecular dynamic (MD) simulations for nonspecific protein-DNA interactions, which have been demonstrated to capture many of the search features observed experimentally (36–38), we provide several new, to our knowledge, insights regarding the effects of the obstacles on the search.
Materials and Methods
Coarse-grained simulation model
We used a coarse-grained model (5,14,36) in which the protein is represented by a single bead per residue centered at the Cα position and the DNA is modeled by three beads per nucleotide (representing phosphate, sugar, and base) that are positioned at the geometric center of the represented group. We performed MD simulations of a human DNA-binding protein Sap-1 (PDB code: 1bc8), member of the Ets transcription factors in the presence of 100 bp double-stranded DNA. Sap-1, a 93 amino-acids globular protein with a total of 15 and 6 positively and negatively charged residues, respectively, uses a winged-helix DNA-binding domain to activate transcription. The protein was simulated by a native topology-based model that excludes nonnative interactions and uses Lennard-Jones potential to represent native contact interactions. Electrostatic interactions acting between all the charged beads in the system were modeled by the Debye-Hückel potential (see below). For all simulations, we used a 100 bp double-stranded DNA that remains rigid and static in its canonical B-form and that was centered on and aligned with the Z-axis. Obstacles were equally spaced along the DNA. Each obstacle occupied 2 bp (see Fig. S1 in the Supporting Material) and was modeled by either changing the charge of the phosphate beads from −1 to +1 or by neutralizing the charge of the phosphates and increasing the exclusion volume repulsion radius (Cex) by a factor of 2 or 4 relative to the radius of DNA beads in nonoccupied sites (Cex0).
The dynamics of the protein along the DNA was simulated using the Langevin dynamics (36,39). The simulations were performed at constant temperature below the unfolding temperature of the protein Sap-1 (i.e., Tsimulation ≈ Tf, where Tf is the equilibrium proteins folding/unfolding temperature), and was analyzed in terms of sliding and hopping (together termed 1D diffusion) and 3D diffusion. All runs were simulated for 200 × 106 time steps that allow extensive DNA sampling by the protein and transitions between sliding, hopping, and 3D search modes. To differentiate in silico between protein sliding, hopping, and free 3D diffusion, we used the definitions defined by Givaty and Levy (36). 1D diffusion along the DNA was used to calculate the mean square displacement profiles along the Z-axis. We accounted for obstacle bypasses in the simulations as hopping events that result in the protein jumping from one side of an obstacle to another and calculated the kinetics for the obstacle bypassing as kbypass = 1/τbypass, where τbypass is the median protein residence time between two adjacent obstacles in a 1D search mode. We point out that due to coarse-graining of the model, one cannot easily convert the time steps to realistic time. Nevertheless, our model reproduces the ratio D3/D1 ≈ 100 as characterized experimentally as well as other kinetic and mechanistic features such as the dependence of the linear diffusion on salt concentration.
Modeling nonspecific protein-DNA interaction using Debye-Hückel potential
Because of the elusive nature of nonspecific interactions between protein and DNA, which are central to the DNA search process by proteins, we used a simplified representation for nonspecific DNA binding in which the interactions between proteins and DNA are governed solely by electrostatic forces. Beads representing the charged amino acids (Arg, Lys, Asp, and Glu) and the DNA phosphate groups were charged in the model. We employed the Debye-Hückel potential to describe the electrostatic interactions between the protein and DNA. Although the Debye-Hückel model is powerful in introducing the salt effect of screening electrostatic interactions into the Coulomb potential, one should be aware of its approximations. The model is valid for relatively dilute conditions, as it approximates that the potential energy of an ion is determined by pairwise interactions with other neighboring ions. The detailed effects of higher salt concentrations and of ion condensation on DNA have to be studied using the nonlinearized Poisson-Boltzmann equation, as well with atomistic simulations that can elucidate the dynamics of the ionic layer during sliding on the DNA.
Because the model is coarse-grained, the distances between the charged beads of the protein and the charged DNA beads are longer compared to fully atomistic models (the charges are placed at the phosphate and Cα beads instead of their actual atoms). Consequently, the salt concentrations reported in this work using the coarse-grained model (10–50 mM) are smaller than typical physiological salt conditions (∼100–150 mM). The range for the salt condition selected in this work is however a measure of strength within the model that successfully recapitulates many important characteristics of protein search modes on DNA (36,40–43). We used a dielectric constant of 70–80 (the typical range in water), because the protein-DNA interface is much more hydrated in the nonspecific complex than in the specific complex (17).
Estimation of the search efficiency of the DNA
To address the efficiency of the DNA search, we employed the positions probed (PP) measure (36), which indicates the number of new DNA sites visited by a protein during a simulation when the helical recognition site is located at the DNA major groove. This measure is calculated by dividing the DNA into sections having a length of 3.3 Å (the length of a single DNA bp). Any frame in which the protein is situated at the DNA major groove is added to the PP measure, unless this position has already been visited by the sliding mode. When the protein dissociates from the DNA, all marked positions are wiped, and the number of probed positions is left unchanged. Thus, the next time the DNA is probed, all positions will be unmarked. Wiping the marked positions after each dissociation event is performed to mimic the fact that, upon dissociation, the probability of the protein returning to the same DNA section is negligible; thus, upon reassociation, the protein would be probing an unprobed region of the DNA. Because our model does not include the specific site, the PP measure serves as an estimate for the ease with which the protein locates the specific site.
Monte Carlo simulations for a random walk on a 1D lattice with Gaussian obstacles
We simulated the movement of a random walker on a 1D lattice with uniform potential. For each set of simulations, we imposed on the 1D lattice equally distributed Gaussian potentials at spacing ranging from 5 to 50 lattice sites (Gaussian height equals 10, and standard deviation is σ = 7, 10, or 15). The protein moves between adjacent sites with the moves being accepted or rejected according to the Metropolis criteria.
Lattice simulations of a random walker with mobile obstacles
We account for a scenario in which some obstacles leave the DNA, whereas others randomly associate with it at the same rate such that constant equilibrium obstacle occupancy is maintained. The obstacles may cover the target site and hide it for a searcher protein. The model we use is a circular 1D lattice representing a DNA with N = 200 sites. The protein takes random single move walks in each step where kProt,1D is the rate constant for protein 1D movements. The dynamics of the obstacles is incorporated through the factor μ = kObst/kProt,1D, where kObst is the rate at which each obstacle is evacuated from its current site and randomly binds at another nonoccupied site). Salt effects are introduced through an additional pair of rate constants for the protein: k1D−3D for on- to off-lattice transitions and k3D-1D for off- to on-lattice sites. For simplicity, we represent the salt condition by an exponential measure ρ = k1D-3D/k3D-1D. A low value of ρ corresponds to a low salt concentration at which the protein has a higher probability for 1D than 3D diffusion. We studied five values of ρ (see Table S1).
Results and Discussion
DNA search efficiency depends on obstacle occupancy and salt concentration
A typical DBP often alternates between 3D diffusion in solution and 1D excursion along DNA that may involve sliding or microscopic hopping events, depending on salt concentration (36). In addition, the protein may transfer between two distant DNA segments through a looped DNA region (44) (Fig. 1 A). To explore the effects of obstacles on the 1D motion of a DBP along DNA, we used coarse-grained (MD) simulations of a globular transcription factor (Sap-1, PDB code: 1bc8, see Materials and Methods) interacting with a DNA molecule that is 100 bp long. In our model, only nonspecific electrostatic interactions, which are incorporated through the Debye-Hückel potential, exist between the protein and the DNA, and protein motion is driven by thermal diffusion. Obstacles were represented by perturbations: electrostatic repulsions or strong excluded volume effects (see Materials and Methods) introduced onto the canonical B-DNA to create a nonuniform backbone incompatible with continuous 1D sliding by a DBP along DNA (Fig. 1 A). In each simulation, various numbers (0–15) of obstacles (each occupying 2 bp) were positioned at equal intervals along the DNA. The efficiency with which the protein sampled the DNA was monitored using the PP measure (see Materials and Methods), which records the number of DNA sites that are newly visited by a DBP using the sliding search mode (36).
Figure 1.
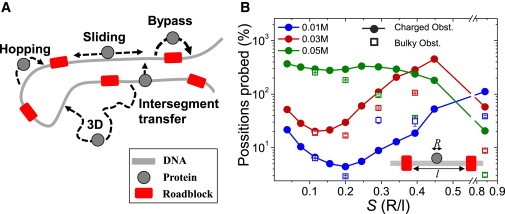
Protein search mechanism on obstacle-covered DNA. (A) A schematic view of protein search mechanisms on DNA in the presence of obstacles (red rectangles). The protein may encounter an obstacle during sliding or may perform microscopic hops, which may assist bypassing the obstacles. DNA loops may also assist obstacle bypassing as the protein may occasionally use intersegmental transfers to traverse between two DNA regions that are far apart in sequence but are spatially close. (B) PP as a function of obstacle occupancy S (calculated as R/l, where R is the diameter of the searching protein and l is the length of spacer DNA between two adjacent obstacles, see inset). Obstacles repel the searching protein via electrostatic repulsions (DNA phosphate bead charge is modified from −1 to +1 at the location of the obstacles—shown by solid circles) or via excluded volume interactions (bulky obstacles with an excluded volume four times that of the protein, CEx/CEx0 = 4—shown by empty squares). Reported results reflect averages over 40–50 simulations under each salt condition and obstacle settings. Error bars reflect standard errors.
At a low salt concentration (0.01 M) where electrostatic screening is relatively weak, the protein is mostly bound to the DNA (i.e., performs sliding) and is likely to encounter the obstacle quite often. Fig. 1 B shows a decrease in the PP at a moderate occupancy of 3–5 obstacles per 100 bp (corresponding to 0.1 < S < 0.2, where S is the obstacle occupancy—a unitless ratio of the protein diameter R to the distance between two adjacent obstacles l; see inset). As the obstacle occupancy on DNA increases (S > ∼0.35), the search efficiency recovers. Naturally, on a fully loaded DNA, the DNA backbone is not accessible for sliding and consequently the previous rapid rise in the number of newly visited DNA sites tapers off. At a higher salt concentration of 0.03 M, a similar trend is observed, though the overall search efficiency is higher and, when the DNA is fully loaded with obstacles, the search efficiency is strongly diminished. When further increasing the salt concentration to 0.05 M, moderate DNA occupancies (3–5 obstacles, S ∼0.2) have less effect on DNA sampling, presumably because the sliding events are much more transient and obstacles are encountered less frequently. Marked changes in PP values are evident only at high obstacle occupancies (S > ∼0.4) at which the DNA has limited accessibility to the protein. Similar effects on search efficiency are obtained for charged and bulky obstacles.
To highlight interference by the obstacle in the kinetics and mechanism of the search performed by the DBP, we calculated the mean-squared displacement (MSD) profiles for 1D dynamics of the protein along the DNA occupied by 0 (S = 0.04), 4 (S = 0.2), and 7 (S = 0.34) obstacles, under salt concentrations of 0.01, 0.03, and 0.05 M. Fig. S2 shows MSD profiles for 10 representative trajectories. For a moderate occupancy of S = 0.2, the overall slope of the profiles is lower than that obtained from naked DNA simulations, therefore implying a decrease in the 1D diffusion coefficient of the protein. As the occupancy increases (S = 0.34), so do the slopes of the MSD profiles, implying that the 1D diffusion coefficient has recovered, in agreement with the increase in DNA sampling efficiencies observed in Fig. 1 B for 0.01 and 0.03 M at high values of S. Similar to the effect of salt concentration on the usage of sliding, hopping, and 3D diffusion (36), we find that increasing obstacle occupancy may interfere with the population of these search mechanisms. At a low salt concentration of 0.01 M, the protein performs mostly sliding. However, under higher salt conditions, increasing the load of obstacles on the DNA results in more hopping and 3D diffusion events at the expense of sliding (Fig. S3). We next aim to understand the source for the modified sampling efficiency under varying obstacles occupancies, and to elucidate how the preference for a particular combination of sliding, hopping, and 3D diffusion may enable the protein to efficiently probe loaded DNA.
Moderate obstacle occupancies confine 1D search to the linker region
To test whether obstacles block the linear diffusion path for the searcher protein as it moves along DNA, we focused on 1D excursion by the DBP. For each 1D event, we measured dz, which is the distance between the minimal and maximal positions of the DBP on the Z-axis (with which the DNA is aligned) and MSDz, which is the sum of all projections on the Z-axis during a single 1D excursion (14) (see Fig. 2 A). A higher value for MSDz/dz, reflects greater redundancy in 1D search, with the DBP revisiting previously searched DNA sites. Fig. 2 A shows how the average redundancy changes as a function of DNA obstacle occupancy, with a clear hierarchy between different salt concentrations. At 0.01 M, redundancy in sampling the DNA sites is greatest for S ∼0.2 (3–5 obstacles per 100 bp). Repeatedly revisiting DNA sites reduces the overall search efficiency, and indeed search redundancy is significantly negatively correlated with PP at a salt concentration of 0.01 M (Fig. 1 B) (Pearson = −0.74, p < 0.01). A high degree of 1D sampling redundancy for S ∼0.1–0.2 is also observed under 0.03 M salt conditions, but to a lesser extent under high salt conditions of 0.05 M. Fig. S4 illustrates that, at low to moderate obstacle occupancies (S < ∼0.2), the mean value of dz decreases and is confined by obstacle spacing length. For a salt concentration of <0.05 M, the values are highly correlated with the length of the linker region between two adjacent obstacles. These observations imply that moderate occupancies confine the protein to 1D motion in regions restricted between two adjacent obstacles and therefore reduce the overall sampling efficiency of the DNA.
Figure 2.
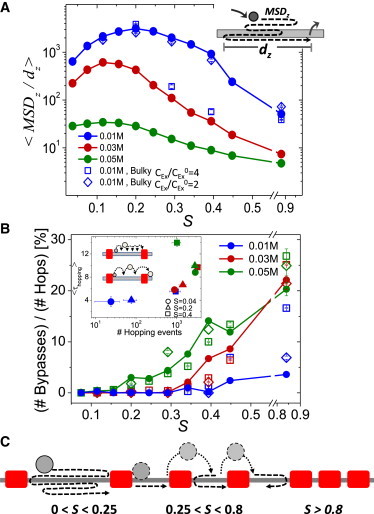
Protein confinement and obstacle bypassing. (A) Each 1D event (sliding and/or hopping dynamics), is characterized by two measures: dz, the distance between the minimal and maximal positions of the protein along the Z-axis and MSDz, the total mean square displacement of the protein along the Z-axis (diagrammed in the inset). Redundancy in 1D searches of DNA (MSDz/dz) is shown as a function of obstacle occupancy S for various salt concentrations for charged obstacles (solid circles) and for bulky obstacles (squares and diamonds) characterized by different ratios of the excluded volume repulsion radius (Cex) to the radius of DNA beads in nonoccupied sites (Cex0). (B) Productive hopping events versus S for the same salt concentrations and obstacle types as in (A). The inset shows the average duration of all hopping events 〈τhopping〉 (in units of simulation time steps) against the average number of hopping events per simulation for 0, 4, and 8 obstacles (corresponding to S = 0.04 (circles), 0.2 (triangles), or 0.4 (squares), respectively) for transient (unproductive) hops (upper diagram) and successful bypasses (lower diagram). (C) Protein sampling of DNA with a nonuniform obstacle occupancy including tightly packed inaccessible regions (S > ∼0.8), low occupancy oversampled regions (0 < S < ∼0.25), and moderately occupied efficiently sampled regions (∼0.25 < S < ∼0.8).
Obstacle bypass is enabled by enriched hopping events
The negative effect of obstacles on overall DNA search efficiency that arises from confinement of the DBP to a restricted region is more pronounced under conditions that commit DBP sliding to a helical motion along the DNA major groove. This can be seen in both the PP (Fig. 1 B) and search redundancy (Fig. 2 A) data at relatively low salt concentrations and for low obstacle occupancies.
However, we found that as the obstacle load on DNA increases, the protein may perform more hopping events (see Fig. S3). Because the protein is more detached from the DNA backbone during hopping than sliding, these events may enable it to bypass obstacles. Fig. 2 B shows the percentage of productive hopping events that result in bypassing an obstacle (measured as the number of hopping events from one side of an obstacle to the other side, normalized by the total number of hopping events) as a function of S. At a low salt concentration of 0.01 M, the percentage of productive hopping events at S ∼0.45 does not exceed ∼8% (for a charged obstacle). At higher salt concentrations, hopping events are more productive and ∼14% of hops result in crossing an obstacle at occupancies of S ∼0.45.
The effect of salt concentration on the ability of a protein to bypass obstacles arises from its effects on both the total number of hopping events and the duration of each such microscopic jump (the product of the total number of hopping events and their durations, τhopping, is the fraction of hopping used in the search, Fig. S3). The inset of Fig. 2 B shows the average duration of hopping as a function of the number of hopping events for 0, 4, and 8 obstacles on the DNA (S = 0.04, 0.2, and 0.4, respectively) under three different salt conditions. At a low salt concentration of 0.01 M, the number of hops dramatically increases with obstacle occupancy but their duration remains relatively short, and rarely enables obstacle bypassing. At a salt concentration of 0.03 M, the number of jumps does not increase dramatically with S, but their duration becomes longer and they may be more productive in bypassing obstacles (see inset of Fig. 2 B). This is consistent with the observation that, as the length of DNA flanking an obstacle decreases, the protein is able to bypass the obstacle more frequently (see Fig. S5). When further increasing the salt concentration to 0.05 M, the number of jumps at large S values decreases because of the dominance of 3D diffusion over sliding and hopping (Fig. S3).
Collectively, the observations of protein confinement in a redundant 1D scanning of the linker region under low obstacle occupancy (Fig. 2 A) and of enhanced bypassing through hopping as the obstacle occupancy increases (Fig. 2 B) may outline a predictive scenario for scanning an inhomogeneous genome bearing a nonhomogenous distributions of obstacles (Fig. 2 C). Although regions that are fully packed with obstacles (S > ∼0.8) restrict protein accessibility for nonspecific DNA binding, low occupancy regions (0 < S < ∼0.25) might be oversampled by a searcher DBP, and regions with moderate occupancy (∼0.25 < S < ∼0.8) can facilitate protein bypass from one linker region to another and thus increase the number of sites to be visited by a protein. Such a mechanism may enable nucleosomal repositioning, for example, to guide regulatory proteins to key genomic regions and prevent their access to other regions, or may cause the proteins to diffuse rapidly among different genomic regions that occupy internucleosomal DNA. Fig. 3 shows scenarios of DNA sampling and obstacles bypassing by the simulated protein Sap-1 as it interacts with DNA occupied uniformly by 4 obstacles (S = 0.2). The protein intimately, but nonspecifically, interacts with the DNA major groove (i.e., sliding dynamics) via its recognition helix in the middle of spacer regions where the obstacles have no effects. Bypassing of the obstacles by the DBP is enabled through perturbing the rotation-coupled translation dynamics of the DBP from the helical trace of the DNA.
Figure 3.
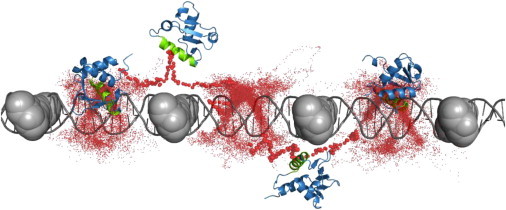
A typical trajectory of Sap-1 search on DNA associated with obstacles, under salt concentration of 0.03 M. For illustrative purposes, the obstacles (4 equally spaced charged obstacles) are shown as bulky spheres. Red dots mark the Cα position of residue 61 (from the center of the protein DNA recognition helix that is shown in green) during the simulation. The left and right conformations depict simulation snapshots where the protein propagates through helical sliding in which its recognition helix is situated at the DNA major groove. The two protein conformations in the middle depict bypass snapshots. Obstacle bypassing is enabled as the protein undergoes hopping and its recognition helix is excluded from the DNA.
Protein-DNA energy landscape in the presence of obstacles: effect on bypass kinetics
Fig. 4 A shows three trajectories of the protein movement along the DNA axis under two salt conditions and for three different values of obstacle occupancy. The random walk nature of motion observed for the protein when no obstacles present, is restricted by the presence of the obstacles (4 (S = 0.2) and 6 (S = 0.29)). The number of transitions from one spacer region to another through obstacle bypass increases with the number of obstacles. In the absence of obstacles (S = 0), the motion of the DBP along the DNA is random and not restricted. Fig. 4 B shows that the obstacle bypass rate achieved by the protein at low and medium salt concentrations (0.01 and 0.03 M, respectively) increases with obstacle occupancy on DNA (0.2 < S < 0.9). The manner in which the rate increases and saturates depends on the type of obstacle and the salt conditions (e.g., the bypass rate is higher at 0.03 M compared with 0.01 M because of the greater number of hopping events, see Fig. 2 B), although qualitative agreement between the trends is observed.
Figure 4.
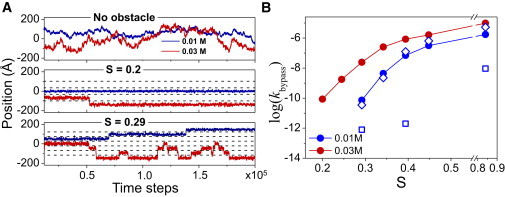
Obstacle bypass kinetics. (A) Raw trajectories data of the displacement of the protein along the DNA axis (Z-axis) under salt concentrations of 0.01 M (blue) and 0.03 M (red). Upper panel: No obstacles (S = 0), middle panel: 4 obstacles (S = 0.2), low panel: 6 obstacles (S = 0.29). Dashed black lines denote the positions of obstacles. (B) Dependence of obstacle bypass kinetics (kbypass) on obstacle occupancy S at various salt concentrations for charged (circles) and bulky obstacles with Cex/Cex0 equals 2 (diamonds) or 4 (squares).
The origin for the enhanced kinetics can be determined by plotting the mean protein-DNA energy (the sum of the electrostatic and exclusion volume energies) at each position along the DNA. Fig. 5 A shows the energy of the DBP on DNA that is loaded with 4 obstacles (top, S = 0.2) and 6 obstacles (bottom, S = 0.29). Notably, the energetic barrier for crossing the obstacles is lower for the more crowded DNA. In addition, the bypass barrier is lower for the higher salt concentration.
Figure 5.
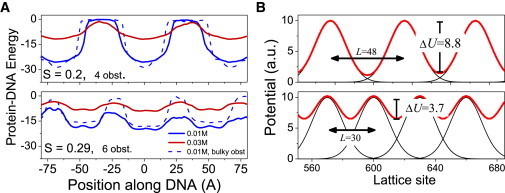
Protein-DNA energy landscape. (A) Protein-DNA energy landscape at two salt concentrations and under two obstacle occupancy conditions on DNA loaded with charged (smooth line) or bulky (dotted line) obstacles. (B) Monte Carlo simulation landscapes for a random walker on a 1D lattice showing a reduced energy barrier for bypassing under increasing obstacle occupancy.
To rationalize the linkage between the energetic barrier for bypassing obstacles and their density on the DNA, we performed simplified Monte Carlo simulations in which we measured the bypass kinetics for a random walker on a 1D lattice that is uniformly loaded with obstacles. In this model, the obstacles were represented by Gaussian potentials (defined by their width σ) and were positioned at equal spacings L along the 1D lattice. Under crowded conditions, the Gaussian tails of the obstacles overlap, therefore elevating the potential energy between the Gaussian peaks and reducing the energy barrier for crossing the obstacles (Fig. 5 B and Fig. S6).
Dynamic obstacles impair DNA search less than stationary ones
In vivo, a searching DBP may encounter other DNA-bound macromolecules, such as other DBPs, that search for their own target sites on the DNA. Although some obstacles, such as nucleosomes, are relatively stationary, others, such as enzymes or transcription factors, may be more mobile. To quantify the effects of obstacle dynamics on search mechanism, we simulated a random walker (representing the DBP) on a 1D lattice (representing DNA) at constant obstacle occupancies in the range of 0–95% (each obstacle occupies a lattice site that is inaccessible to the walker). The walker moves one-dimensionally from one site to another with a characteristic rate of kProt,1D, as each obstacle is evacuated from its current site and immediately binds randomly at another nonoccupied site at a rate of kObst (Fig. S7). Thus, the dynamics of the obstacles is incorporated into the model through μ, which is the ratio of the two characteristic rate constants (μ = kObst/kProt,1D). In addition, we introduced a salt dependency that came into play in the ratio of rate constants, ρ = k1D-3D/k3D-1D, where k1D-3D and k3D-1D are the rate constants for protein transition from the DNA into the bulk and vice versa, respectively. At a low ρ value corresponding to a low salt concentration, the protein is predominantly bound to the 1D lattice, whereas at higher ρ values the protein dissociates from the lattice and rebinds randomly to an unoccupied site. We studied five values of ρ (see Table S1).
We measured search efficiency (calculated as the ratio of the number of visited sites to the total number of sites in the lattice) for various conditions of μ, ρ, and percentage of obstacle occupancy. Beyond the pronounced, but expected, improvement in search efficiency at higher salt concentrations (at which dissociation of the walker from the lattice is followed by reassociation at a distant site), the results clearly show that increasing the obstacle dynamics (increasing μ) enables the random walker to maintain lattice sampling efficiency with no interruptions even at high occupancies of ∼75% (Fig. 6, A and B). Fig. 6 C illustrates the sampling efficiency for a random walker that can bypass a single obstacle with probability of 0.5. The ability of the protein to hop enables it to overcome immobile obstacles and scan the DNA efficiently at occupancies as high as 50%. Our observations imply that smaller proteins that diffuse relatively fast will experience obstacles as static objects, whereas large proteins experience them as dynamic objects (i.e., for a given DNA environment, μlarge-protein > μsmall-protein). We expect therefore, that small DBPs will be more affected by crowding on DNA in comparison with larger DBPs that search for their regulatory sites.
Figure 6.
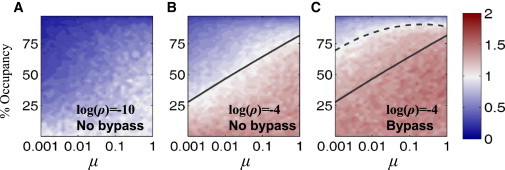
Effect of mobile obstacles on DNA sampling efficiency. Lattice simulations of a protein (random walker) moving at a rate kProt,1D on a 1D lattice containing mobile obstacles. The protein may dissociate to the bulk at rate k1D-3D or reassociate at rate k3D-1D. The obstacles dissociate from their sites at a rate kObst. Immobile obstacles have a small μ value, dynamic obstacles have a large μ value, and ρ indicates the tendency of the protein to dissociate from the DNA and so corresponds to the salt concentration. (A and B) Lattice sampling efficiency (average of 10 simulations, normalized by the mean at 0% occupancy) under low salt (A, ρ = 10−10) and higher salt (B, ρ = 10−4) conditions. (C) As in C, but here the protein may hop over single obstacles with a probability of 0.5. The black lines in B and C, correspond to a sampling of obstacle-covered DNA with sampling efficiency similar to that achieved on naked DNA when obstacle bypassing are excluded (solid) or included (dashed).
Conclusions
We demonstrated that, as the DBP performs more sliding along the DNA, its search efficiency in the presence of obstacles may be reduced as its dynamics confine it to redundant 1D scanning of the spacer region between two adjacent obstacles. This finding may imply that an inhomogeneous positioning of obstacles along DNA can sequester sampling to within certain regions while reducing the possibility of searching other regions, as is the scenario in yeast genomes, for example, where most regulatory regions exhibit low nucleosomal occupancies (26). The sequestration effect by the obstacle may result in a slower search when the target site is not located in the accessible region that is defined by the obstacles.
Although the obstacles may restrict the DNA region that is accessible for searching, they may be bypassed during hopping events. The number of hops and their duration, which could differ between different DBPs and can be modulated by the salt concentration, might determine the possibility of jumping over obstacles. More importantly, at a relatively high obstacle density, the nonspecific interaction between the DBP and the DNA is weaker compared with less crowded DNA and the protein therefore performs more hopping at the expense of sliding. This observation serves as another example of the importance of hopping in searching DNA (34,45–48). The enhanced hopping dynamics may be viewed also as an outcome of the more frequent collisions of the DBP with obstacles as the density of the latter increases. Alternatively, the hopping may be viewed as two-dimensional sliding, which was proposed as a mechanism for bypassing obstacles (35). We anticipate that protein hopping in looped DNA regions may facilitate intersegmental transfers between DNA regions far apart in sequence (Fig. 1 A), which further assist obstacle bypassing. Increasing obstacle occupancy thus reduces the energetic barrier for bypassing an obstacle. By contrast, on less crowded DNA, obstacle effects become more localized and the protein may be trapped and perform a redundant and inefficient sampling of the linker region (49,50). In causing the protein to linger in a particular region, the obstacles may mask other DNA regions and thus bias the search to the linker region and reduce the search time (51). On the other hand, causing the protein to pause in a particular region may be advantageous if, by increasing the search time, it enables the search to be better synchronized with other cellular processes (22).
Our lattice simulations imply that dynamic obstacles, such as other DBPs that search for their own target DNA sites, are far less of an impediment to the search process than immobile obstacles. Consequently, a protein may be able to efficiently sample DNA even if it is relatively densely loaded with obstacles. Thus, the synergism between obstacle occupancy, the intrinsic dynamics of obstacles, and the salt concentration may facilitate the search and contribute to the ability of proteins to navigate through the complex DNA organization to find their regulatory binding sites.
Acknowledgments
This work was supported by the Kimmelman Center for Macromolecular Assemblies and the Minerva Foundation with funding from the Federal German Ministry for Education and Research. Y.L. is the incumbent of the Lillian and George Lyttle Career Development Chair.
Supporting Material
References
- 1.Zakrzewska K., Lavery R. Towards a molecular view of transcriptional control. Curr. Opin. Struct. Biol. 2012;22:160–167. doi: 10.1016/j.sbi.2012.01.004. [DOI] [PubMed] [Google Scholar]
- 2.Riggs A.D., Bourgeois S., Cohn M. The lac repressor-operator interaction. 3. Kinetic studies. J. Mol. Biol. 1970;53:401–417. doi: 10.1016/0022-2836(70)90074-4. [DOI] [PubMed] [Google Scholar]
- 3.Berg O.G., Winter R.B., von Hippel P.H. Diffusion-driven mechanisms of protein translocation on nucleic acids. 1. Models and theory. Biochemistry. 1981;20:6929–6948. doi: 10.1021/bi00527a028. [DOI] [PubMed] [Google Scholar]
- 4.von Hippel P.H., Berg O.G. Facilitated target location in biological systems. J. Biol. Chem. 1989;264:675–678. [PubMed] [Google Scholar]
- 5.Marcovitz A., Levy Y. Frustration in protein-DNA binding influences conformational switching and target search kinetics. Proc. Natl. Acad. Sci. USA. 2011;108:17957–17962. doi: 10.1073/pnas.1109594108. [DOI] [PMC free article] [PubMed] [Google Scholar]
- 6.Record M.T., Jr., Ha J.H., Fisher M.A. Analysis of equilibrium and kinetic measurements to determine thermodynamic origins of stability and specificity and mechanism of formation of site-specific complexes between proteins and helical DNA. Methods Enzymol. 1991;208:291–343. doi: 10.1016/0076-6879(91)08018-d. [DOI] [PubMed] [Google Scholar]
- 7.Jack W.E., Terry B.J., Modrich P. Involvement of outside DNA sequences in the major kinetic path by which EcoRI endonuclease locates and leaves its recognition sequence. Proc. Natl. Acad. Sci. USA. 1982;79:4010–4014. doi: 10.1073/pnas.79.13.4010. [DOI] [PMC free article] [PubMed] [Google Scholar]
- 8.Gowers D.M., Wilson G.G., Halford S.E. Measurement of the contributions of 1D and 3D pathways to the translocation of a protein along DNA. Proc. Natl. Acad. Sci. USA. 2005;102:15883–15888. doi: 10.1073/pnas.0505378102. [DOI] [PMC free article] [PubMed] [Google Scholar]
- 9.Iwahara J., Zweckstetter M., Clore G.M. NMR structural and kinetic characterization of a homeodomain diffusing and hopping on nonspecific DNA. Proc. Natl. Acad. Sci. USA. 2006;103:15062–15067. doi: 10.1073/pnas.0605868103. [DOI] [PMC free article] [PubMed] [Google Scholar]
- 10.Gorman J., Greene E.C. Visualizing one-dimensional diffusion of proteins along DNA. Nat. Struct. Mol. Biol. 2008;15:768–774. doi: 10.1038/nsmb.1441. [DOI] [PubMed] [Google Scholar]
- 11.Elf J., Li G.W., Xie X.S. Probing transcription factor dynamics at the single-molecule level in a living cell. Science. 2007;316:1191–1194. doi: 10.1126/science.1141967. [DOI] [PMC free article] [PubMed] [Google Scholar]
- 12.Hammar P., Leroy P., Elf J. The lac repressor displays facilitated diffusion in living cells. Science. 2012;336:1595–1598. doi: 10.1126/science.1221648. [DOI] [PubMed] [Google Scholar]
- 13.Blainey P.C., Luo G., Xie X.S. Nonspecifically bound proteins spin while diffusing along DNA. Nat. Struct. Mol. Biol. 2009;16:1224–1229. doi: 10.1038/nsmb.1716. [DOI] [PMC free article] [PubMed] [Google Scholar]
- 14.Marcovitz A., Levy Y. RSC; United Kingdom: 2012. Sliding Dynamics Along DNA: A Molecular Perspective. [Google Scholar]
- 15.Slutsky M., Mirny L.A. Kinetics of protein-DNA interaction: facilitated target location in sequence-dependent potential. Biophys. J. 2004;87:4021–4035. doi: 10.1529/biophysj.104.050765. [DOI] [PMC free article] [PubMed] [Google Scholar]
- 16.Kolomeisky A.B. Physics of protein-DNA interactions: mechanisms of facilitated target search. Phys. Chem. Chem. Phys. 2011;13:2088–2095. doi: 10.1039/c0cp01966f. [DOI] [PubMed] [Google Scholar]
- 17.Dahirel V., Paillusson F., Victor J.M. Nonspecific DNA-protein interaction: why proteins can diffuse along DNA. Phys. Rev. Lett. 2009;102:228101. doi: 10.1103/PhysRevLett.102.228101. [DOI] [PubMed] [Google Scholar]
- 18.Sheinman M., Bénichou O., Voituriez R. Classes of fast and specific search mechanisms for proteins on DNA. Rep. Prog. Phys. 2012;75:026601. doi: 10.1088/0034-4885/75/2/026601. [DOI] [PubMed] [Google Scholar]
- 19.Bénichou O., Kafri Y., Voituriez R. Searching fast for a target on DNA without falling to traps. Phys. Rev. Lett. 2009;103:138102. doi: 10.1103/PhysRevLett.103.138102. [DOI] [PubMed] [Google Scholar]
- 20.Hu T., Grosberg A.Y., Shklovskii B.I. How proteins search for their specific sites on DNA: the role of DNA conformation. Biophys. J. 2006;90:2731–2744. doi: 10.1529/biophysj.105.078162. [DOI] [PMC free article] [PubMed] [Google Scholar]
- 21.Klenin K.V., Merlitz H., Wu C.X. Facilitated diffusion of DNA-binding proteins. Phys. Rev. Lett. 2006;96:018104. doi: 10.1103/PhysRevLett.96.018104. [DOI] [PubMed] [Google Scholar]
- 22.Li G., Berg O., Elf J. Effects of macromolecular crowding and DNA looping on gene regulation kinetics. Nat. Phys. 2009;5:294–297. [Google Scholar]
- 23.Bénichou O., Chevalier C., Voituriez R. Facilitated diffusion of proteins on chromatin. Phys. Rev. Lett. 2011;106:038102. doi: 10.1103/PhysRevLett.106.038102. [DOI] [PubMed] [Google Scholar]
- 24.Lomholt M.A., van den Broek B., Metzler R. Facilitated diffusion with DNA coiling. Proc. Natl. Acad. Sci. USA. 2009;106:8204–8208. doi: 10.1073/pnas.0903293106. [DOI] [PMC free article] [PubMed] [Google Scholar]
- 25.Shivaswamy S., Bhinge A., Iyer V.R. Dynamic remodeling of individual nucleosomes across a eukaryotic genome in response to transcriptional perturbation. PLoS Biol. 2008;6:e65. doi: 10.1371/journal.pbio.0060065. [DOI] [PMC free article] [PubMed] [Google Scholar]
- 26.Kaplan N., Moore I.K., Segal E. The DNA-encoded nucleosome organization of a eukaryotic genome. Nature. 2009;458:362–366. doi: 10.1038/nature07667. [DOI] [PMC free article] [PubMed] [Google Scholar]
- 27.Poirier M.G., Bussiek M., Widom J. Spontaneous access to DNA target sites in folded chromatin fibers. J. Mol. Biol. 2008;379:772–786. doi: 10.1016/j.jmb.2008.04.025. [DOI] [PMC free article] [PubMed] [Google Scholar]
- 28.Ali Azam T., Iwata A., Ishihama A. Growth phase-dependent variation in protein composition of the Escherichia coli nucleoid. J. Bacteriol. 1999;181:6361–6370. doi: 10.1128/jb.181.20.6361-6370.1999. [DOI] [PMC free article] [PubMed] [Google Scholar]
- 29.Tafvizi A., Mirny L.A., van Oijen A.M. Dancing on DNA: kinetic aspects of search processes on DNA. ChemPhysChem. 2011;12:1481–1489. doi: 10.1002/cphc.201100112. [DOI] [PMC free article] [PubMed] [Google Scholar]
- 30.Flyvbjerg H., Keatch S.A., Dryden D.T. Strong physical constraints on sequence-specific target location by proteins on DNA molecules. Nucleic Acids Res. 2006;34:2550–2557. doi: 10.1093/nar/gkl271. [DOI] [PMC free article] [PubMed] [Google Scholar]
- 31.Sabo P.J., Kuehn M.S., Stamatoyannopoulos J.A. Genome-scale mapping of DNase I sensitivity in vivo using tiling DNA microarrays. Nat. Methods. 2006;3:511–518. doi: 10.1038/nmeth890. [DOI] [PubMed] [Google Scholar]
- 32.Zhou H.X. A model for the mediation of processivity of DNA-targeting proteins by nonspecific binding: dependence on DNA length and presence of obstacles. Biophys. J. 2005;88:1608–1615. doi: 10.1529/biophysj.104.052688. [DOI] [PMC free article] [PubMed] [Google Scholar]
- 33.Gorman J., Plys A.J., Greene E.C. Visualizing one-dimensional diffusion of eukaryotic DNA repair factors along a chromatin lattice. Nat. Struct. Mol. Biol. 2010;17:932–938. doi: 10.1038/nsmb.1858. [DOI] [PMC free article] [PubMed] [Google Scholar]
- 34.Hedglin M., O’Brien P.J. Hopping enables a DNA repair glycosylase to search both strands and bypass a bound protein. ACS Chem. Biol. 2010;5:427–436. doi: 10.1021/cb1000185. [DOI] [PMC free article] [PubMed] [Google Scholar]
- 35.Kampmann M. Obstacle bypass in protein motion along DNA by two-dimensional rather than one-dimensional sliding. J. Biol. Chem. 2004;279:38715–38720. doi: 10.1074/jbc.M404504200. [DOI] [PubMed] [Google Scholar]
- 36.Givaty O., Levy Y. Protein sliding along DNA: dynamics and structural characterization. J. Mol. Biol. 2009;385:1087–1097. doi: 10.1016/j.jmb.2008.11.016. [DOI] [PubMed] [Google Scholar]
- 37.Zandarashvili L., Vuzman D., Iwahara J. Asymmetrical roles of zinc fingers in dynamic DNA-scanning process by the inducible transcription factor Egr-1. Proc. Natl. Acad. Sci. USA. 2012;109:E1724–E1732. doi: 10.1073/pnas.1121500109. [DOI] [PMC free article] [PubMed] [Google Scholar]
- 38.Terakawa T., Kenzaki H., Takada S. p53 searches on DNA by rotation-uncoupled sliding at C-terminal tails and restricted hopping of core domains. J. Am. Chem. Soc. 2012;134:14555–14562. doi: 10.1021/ja305369u. [DOI] [PubMed] [Google Scholar]
- 39.Mor A., Ziv G., Levy Y. Simulations of proteins with inhomogeneous degrees of freedom: the effect of thermostats. J. Comput. Chem. 2008;29:1992–1998. doi: 10.1002/jcc.20951. [DOI] [PubMed] [Google Scholar]
- 40.Vuzman D., Levy Y. DNA search efficiency is modulated by charge composition and distribution in the intrinsically disordered tail. Proc. Natl. Acad. Sci. USA. 2010;107:21004–21009. doi: 10.1073/pnas.1011775107. [DOI] [PMC free article] [PubMed] [Google Scholar]
- 41.Vuzman D., Azia A., Levy Y. Searching DNA via a “Monkey Bar” mechanism: the significance of disordered tails. J. Mol. Biol. 2010;396:674–684. doi: 10.1016/j.jmb.2009.11.056. [DOI] [PubMed] [Google Scholar]
- 42.Vuzman D., Polonsky M., Levy Y. Facilitated DNA search by multidomain transcription factors: cross talk via a flexible linker. Biophys. J. 2010;99:1202–1211. doi: 10.1016/j.bpj.2010.06.007. [DOI] [PMC free article] [PubMed] [Google Scholar]
- 43.Khazanov N., Levy Y. Sliding of p53 along DNA can be modulated by its oligomeric state and by cross-talks between its constituent domains. J. Mol. Biol. 2011;408:335–355. doi: 10.1016/j.jmb.2011.01.059. [DOI] [PubMed] [Google Scholar]
- 44.Sheinman M., Kafri Y. The effects of intersegmental transfers on target location by proteins. Phys. Biol. 2009;6:016003. doi: 10.1088/1478-3975/6/1/016003. [DOI] [PubMed] [Google Scholar]
- 45.Halford S.E., Marko J.F. How do site-specific DNA-binding proteins find their targets? Nucleic Acids Res. 2004;32:3040–3052. doi: 10.1093/nar/gkh624. [DOI] [PMC free article] [PubMed] [Google Scholar]
- 46.Halford S.E. An end to 40 years of mistakes in DNA-protein association kinetics? Biochem. Soc. Trans. 2009;37:343–348. doi: 10.1042/BST0370343. [DOI] [PubMed] [Google Scholar]
- 47.Schonhoft J.D., Stivers J.T. Timing facilitated site transfer of an enzyme on DNA. Nat. Chem. Biol. 2012;8:205–210. doi: 10.1038/nchembio.764. [DOI] [PMC free article] [PubMed] [Google Scholar]
- 48.Bonnet I., Biebricher A., Desbiolles P. Sliding and jumping of single EcoRV restriction enzymes on non-cognate DNA. Nucleic Acids Res. 2008;36:4118–4127. doi: 10.1093/nar/gkn376. [DOI] [PMC free article] [PubMed] [Google Scholar]
- 49.Jeltsch A., Alves J., Pingoud A. Pausing of the restriction endonuclease EcoRI during linear diffusion on DNA. Biochemistry. 1994;33:10215–10219. doi: 10.1021/bi00200a001. [DOI] [PubMed] [Google Scholar]
- 50.Pluciennik A., Modrich P. Protein roadblocks and helix discontinuities are barriers to the initiation of mismatch repair. Proc. Natl. Acad. Sci. USA. 2007;104:12709–12713. doi: 10.1073/pnas.0705129104. [DOI] [PMC free article] [PubMed] [Google Scholar]
- 51.Mirny L., Slutsky M., Kosmrlj A. How a protein searches for its site on DNA: the mechanism of facilitated diffusion. J. Phys. A: Math. Theor. 2009;42:434013. [Google Scholar]
Associated Data
This section collects any data citations, data availability statements, or supplementary materials included in this article.