

Abstract
SHG angular intensity pattern (SHG-AIP) of healthy and proteolysed muscle tissues are simulated and imaged here for the first time to our knowledge. The role of the spatial distribution of second-order nonlinear emitters on SHG-AIP is highlighted. SHG-AIP with two symmetrical spots is found to be a signature of healthy muscle whereas SHG-AIP with one centered spot in pathological mdx muscle is found to be a signature of myofibrillar disorder. We also show that SHG-AIP provides information on the three-dimensional structural organization of myofibrils in physiological and proteolysed muscle. Our results open an avenue for future studies aimed at unraveling more complex physiological and pathological fibrillar tissues organization.
Introduction
Second harmonic generation (SHG) imaging microscopy (SHIM) has emerged as a powerful and noninvasive technique for the study of fibrillar tissue possessing a second-order nonlinear susceptibility χ(2) (1,2). SHIM takes advantage of a nonlinear and coherent frequency-doubling optical effect that is inherent to very few biomolecules, i.e., collagen, myosin, and tubulin, which are packed in a noncentrosymmetric polycrystalline lattice. In SHIM experiments of biological tissue, phase-matching between ω and 2ω waves cannot be fulfilled mainly due to 1), optical dispersion; 2), Gouy effect; and 3), optical scattering. The main consequence is that coherence between harmonic waves is lost and that SHG intensity is reduced (3).
It is widely accepted that macroscopic organization of fibrils is a key factor influencing both intensity and angular emission of SHG signal that is often emitted in the forward direction but also in the backward one for selective periodic organization of nonlinear sources as demonstrated from different biological tissues (3–13). Theory of SHG emission anisotropy was first described in inorganic materials as second harmonic scattering (14–17). Freund and co-workers (14,15) showed that selective spatial modulation of χ(2) can act as a nonlinear diffraction grating resulting in better coherence between harmonic waves leading to constructive interferences and to high SHG intensity in specific directions (14). Freund (14) was the first to apply this theory to describe diffraction of harmonic optical radiation by collagen tissue. He showed that high SHG intensity can be obtained in directions fulfilling the condition (14)
| (1) |
where kω and k2ω are, respectively, the wave vectors of fundamental and harmonic waves and Q is the wave vector associated to the spatial modulation of χ(2). This equation, obtained for plane waves, has been described as the nonlinear optical analog of x-ray diffraction, or Bragg’s law (14). More recently, this theory has been extended to the high focusing limit (18,19). Tian et al. (20) theoretically demonstrated that collagen fibrils diameter, packing density, and interfibrils structure have a strong influence on SHG emission angle. In the case of a highly focused beam, we will show that direction of diffracted harmonic waves is determined by the following extension of Eq. 1
| (2) |
Here ξ is a coefficient that represents the effective reduction (ξ < 1) of kω due to Gouy effect (21–23).
In SHIM experiments, SHG signal is usually integrated through the numerical aperture (NA) of the collecting optic resulting in a loss of second harmonic generation angular intensity pattern (SHG-AIP) and of most of the information relative to fibrillar organization. In this work, we will first extend previous theoretical models (18–20,22) to calculate SHG-AIP in muscle tissue taking into account the finite size of myofibrils, their polarity, and the inhomogeneity of their distributions. We will next show that with small modification of the experimental setup, it is possible to obtain SHG intensity of healthy and proteolysed muscle tissues as a function of the forward angle of emission so as to deduce the forward SHG-AIP for each pixel of a scanned image. We find that healthy muscle with well-aligned myofibrils is characterized by a unique SHG-AIP signature that is well predicted by the theoretical simulation. We also find that proteolysed muscle has more varied SHG-AIPs which reveal more complex myofibrillar organization. In this work, which is to our knowledge the first report showing experimental SHG-AIPs of muscle tissue, we demonstrate that SHG-AIP technique provides extra hints to map, at suboptical resolution, the three-dimensional (3D) myofibrillar organization in both healthy and pathological conditions.
Materials and Methods
Sample preparation
Muscle tissues were obtained from gastrocnemius of either adult Xenopus laevis (from the national breeding facility of Xenopus animals in Rennes, France) or 6-month-old mouse. For Xenopus, nine mature male animals were anesthetized by immersion for 10–15 min in 2% phenoxyethanol (Sigma-Aldrich, St. Louis, MO) and divided into two groups. The dissected gastrocnemius muscles were tied to rigid plastic rods after gentle stretching to 130% of resting length during pre- and post-fixation protocols. Muscles of the control group were immediately incubated in Mark’s modified Ringer (MMR) solution containing 4% paraformaldehyde (PFA) fixative, where the muscles of the proteolysed group experienced either 3 h (mild proteolysis) or 6 h post-mortem spontaneous proteolysis in MMR solution at room temperature (18–22°C) and then were incubated in 4% PFA-MMR fixative.
For mouse, gastrocnemius muscles of six wild-type (BL10) and six mdx (mouse model of Duchenne muscular dystrophy) animals provided by Pr. Y. Cherel (ENV, ONIRIS, Nantes, France) were dissected in phosphate-buffered saline (PBS). They were immediately fixed with 4% PFA-PBS at slack length. For both Xenopus and mouse, muscles were kept overnight at 4°C in the fixative and washed several times in the appropriate buffer saline. The immediate fixative procedure was previously shown to prevent spontaneous muscle proteolysis (24). Dissected pieces (200–400 μm thickness) of muscle fibers were mounted in a POC-R2 tissue culture chamber system (PeCon, Erbach, Germany) in MMR or PBS and stabilized between two coverslips. Myofibrils were isolated according to previously described protocol. Briefly, prefixed muscles were cut into few-mm-wide strips and washed several times in ice-cold MMR solution. Muscle strips were then transferred in ice-cold rigor solution containing 50 mM KCl, 2 mM MgCl2, 10 mM imidazole-HCl, 2 mM EGTA-KOH, pH 7.4, 0.5 mM DTT, and 0.1 mM PMSF. Samples were homogenized in this solution for 15 s with an Ultra-Turrax T25 homogenizer at medium speed (IKA Works, Wilmington, NC). The pellet was collected by centrifugation at 4000 x g, for 10 min at 4°C, and washed in the same ice-cold solution. This operation was repeated three times. A quantity of 100 μL of the suspended sample was laid between two coverslips in the POC-R2 tissue culture chamber containing MMR.
SHG imaging system
SHG images were acquired with the PIXEL system (facility of GIS EUROPIA, University of Rennes 1, Rennes, France; http://pixel.univ-rennes1.fr/). The SHG imaging system consists of a confocal TCS SP2 scanning head (Leica Microsystems, Mannheim, Germany) mounted on a DMIRE2 inverted microscope (Leica Microsystems) and equipped with a MAITAI femtosecond laser (Spectra Physics, Santa Clara, CA). A high NA water immersion objective (LUMFL 60 W × 1.1 NA; Olympus, Tokyo, Japan) was used for applying 10–20 mW of 940-nm excitation at the sample. The SHG signal was collected in the forward direction using a water immersion condenser (S1, NA = 0.9–1.4; Leica Microsystems). BG39 bandpass and 470-nm infrared (IR) filters (10-nm full width at half-maximum, FWHM) were placed before the photomultiplier tube. All specimens were positioned on the fixed x,y stage of the microscope with polarization of the incident laser beam along the y direction. To obtain the SHG-AIP of each scanned image, the aperture diaphragm was removed from the condenser and replaced by a movable dark screen with a pinhole (Fig. 1). A motorized xy stage was used to move the pinhole over the entire field of the aperture diaphragm. SHG images of the same field of view were obtained for P × P positions of the pinhole to map the entire field of the condenser aperture. Centering of the pinhole corresponding to θ = 0°, with an accuracy estimated to ±1°, was made before each experiment. Open source ImageJ software (National Institutes of Health, Bethesda, MD; http://rsb.info.nih.gov/ij/) was used to compute the average intensity within a particular region of interest (ROI) for the P × P images. The software MATLAB (The MathWorks, Natick, MA) was used to plot the corresponding experimental SHG-AIP.
Figure 1.
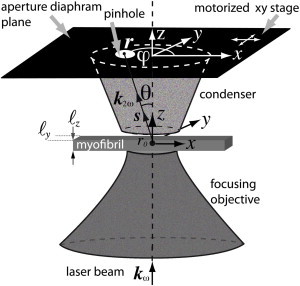
Schematic of the experiment. Excitation IR laser beam is propagating in the z direction and is focused at x = y = z = 0. A pinhole is inserted in the plane of the aperture diaphragm to select a particular angle of SHG light emission. Forward SHG-AIP is obtained after acquisition of an image for each position of the pinhole that is moved by a motorized stage over the entire field of the aperture diaphragm (θ ∼ 42.6°, NA = 0.9).
SHG pattern quantification and ROC analysis
The sarcomeric SHG intensity pattern (SHG-IP), as previously reported in Recher et al. (25), and the SHG-AIP were quantified from muscle fibers of 12 animals (six BL10, six mdx). For each animal, five random fields (60 × 60 μm) were selected. For each field, paired SHG-IP and SHG-AIP analysis was performed from eight-homogeneously distributed ROIs in the entire field. For SHG-IP, ROIs are full lines along myofibrils. For SHG-AIP, the ROI size is 7.5 × 60 μm. Student’s t-test (using the software Excel, Microsoft, Redmond, WA), and receiver operating characteristic (ROC) curve and area under the curve (AUC) analysis were performed as previously reported by Plotnikov et al. (26) using SIGMAPLOT (Systat Software, San Jose, CA).
Theoretical Modeling
A thorough theoretical study of SHG emission from fibrillar collagen has been done recently and it has been shown that both distribution of fibrils inside the fiber and focusing conditions are key factors influencing SHG emission angle (19,20). It is also known that shape and size of the biological tissue can also affect SHG signal. For example, when size of the sample is of the order of the optical wavelength, optical diffraction is significant and needs to be taken into account in the calculation of the SHG intensity. To correctly interpret experimental SHG-AIPs of muscle tissue, we have thus extended previous theoretical models (18–20,22) taking into account polarity, size, and distribution of myofibrils.
Laser beam with incident-wave vector kω is chosen to propagate along the z direction and is focused with a high NA objective on a myofibril (Fig. 1). Assuming that the excitation volume is 3D Gaussian at the vicinity of the focus, SHG intensity that is radiated in direction r(r,θ,φ) is given in the far-field approximation, by (18,22,27)
| (3) |
where summation is made over all nonlinear sources r0. Beam waist measurements wxy and wz are obtained from the two-photon excitation point spread function (PSF). ξ = 1 − (kω zr)−1 is a coefficient whose value is driven by the Rayleigh range zr = πnωw2xyλω−1. The value ξ represents the reduction (ξ < 1) of the effective axial propagation vector kω caused by the phase anomaly or Gouy shift (21–23). M(r0) is a modulation function that is introduced to take into account the spatial modulation of χ(2)(r0). It is defined as χ(2)(r0) = M(r0)χ(2), where χ(2) is the uniform nonlinear susceptibility tensor. is a projection operator that represents the angular dependence of the radiation of each nonlinear dipole. I is the unity tensor, s is the unitary vector along k2ω, and Eω is the electric field strength at the center point of the focused beam. To obtain simple analytical expressions, we consider that the myofibril is rectangular with size ℓy and ℓz, respectively, along the y and z directions (Fig. 1). In these conditions, M(r0) is a periodical function in the x direction with a period Lx equal to the sarcomere width and is a uniform function in y and z directions such that M(r0) is factorizable,
| (4) |
where My = Mz = 1 within the myofibril and My = Mz = 0 elsewhere; Mx = +1 or −1 in the A-band region of each sarcomere and Mx = 0 elsewhere. The sign inversion takes into account the myosin thick filament polarity inversion at the center of each sarcomere. As the myofibril has a finite transversal size, we can repeat it in y and z directions with spatial periods equal to Ly and Lz, respectively. To have no influence on the result of the SHG intensity, Ly and Lz have to be chosen much larger than the laser focus spot that is the active volume to produce the SHG signal. Doing so, we can expand each coefficient Mη (η = x, y, z) in Fourier series (22) as
| (5) |
with wave-vector component Gηn and Fourier coefficient cηn of order n given by
| (6) |
After straightforward calculation, using standard properties of Fourier transform, Eq. 3 results in
| (7) |
with
| (8) |
Fourier coefficients cηn are (22)
| (9) |
for n ≠ 0 and cxn = 0, cyn = ℓyLy−1, and czn = ℓzLz−1 for n = 0. The value ℓx is the width of the A-band region of each sarcomere. We also consider that thick filaments of each A-band are centered and perfectly aligned within each sarcomere. The effect of the antiparallel overlapping of myosin tails at the center of each sarcomere (M-band) is also neglected. The values Δx, Δy, and Δz are coefficients that are introduced to take into account a possible displacement of the center of the sarcomere with respect to the focus spot in the x, y, and z directions, respectively. This result can be generalized to an identical adjacent bundle of myofibrils with possible different displacements Δη (η = x, y, z) relative to the center of the focus spot. In that case, g(θ,φ) is replaced by in Eq. 7 where summation has to be done over all myofibrils f. The value gf(θ,φ) is still given by Eq. 8, replacing cηn by cfηn and Gηn by Gfηn for each myofibril f. Finally, the total SHG intensity collected by the condenser is obtained by angular integration of Eq. 7 over the condenser aperture
| (10) |
with dΩ = sinθdθdφ the differential solid angle in spherical coordinates r, θ, φ. It is worth noting that if there is a dominant term in each sum of Eq. 8 corresponding to a unique G, g(θ,φ) is maximum if k2ω = 2ξkω + G. That corresponds to Eq. 2 with G = Q.
The software MATLAB (The MathWorks) was used for the simulation of the radiated SHG intensity I2ω(r). Choice of spatial periods Lx, Ly, and Lz in the Fourier development series is done such that
where wη = wxy and wη = wz for η = x or y and η = z, respectively. The condition to ensure that this ratio is <0.5% gives Lη ≥ 1.81 × wη according to standard properties of the cumulative distribution function of the Gaussian distribution (28). It is worth noting that the SHG signal is only defined by the specific organization of myofibrils within a small focusing volume (1.81)3 × w2xy × wz = 3.3 μm3 of the order of the PSF. We have checked that the result of the theoretical simulation does not depend on the choice of Lη as long as the above condition is satisfied. For simplicity, we choose Ly = Lz = 15 μm that are greater than the size of the bundle of myofibrils used in the simulation both in the y and z directions. Lx = 3 μm corresponds to the experimental average sarcomere width and also satisfies the previous condition. The number of Fourier coefficients is set to 40 such that is >99% of its limiting value. For all simulations, ℓy = ℓz = 1 μm, ℓx = 1.6 μm, and refractive indices at fundamental and harmonic frequencies are taken equal to nω = n2ω = 1.33 (22). The values wxy and wz were estimated from the two-photon excitation PSF obtained from 0.17-μm-diameter fluorescent micro beads (PS-Speck Microscope Point Source Kit No. P7220; Molecular Probes, Eugene, OR). Lateral and axial FWHM were found to be FWHMx,y = 0.4 μm and FWHMz = 2 μm at 940 nm. The measurements wxy = 0.48 μm and wz = 2.4 μm were deduced from these values using (2,22) . We have checked experimentally that P(θ,φ), whose value is driven by the polarization of the incident IR laser beam, is a parameter that does not change the shape of the SHG-AIP (see Fig. S1 in the Supporting Material). It will therefore not be taken into account in the simulation.
Theoretical SHG-AIPs of sarcomeres from N×N adjacent myofibrils with different relative positions are shown in Fig. 2 as a function of N for both healthy (Fig. 2, A and B) and proteolysed muscles (Fig. 2, C–G). Only one sarcomeric A-band is shown for each myofibril, and the polarity inversion of myosin molecules at the center of the sarcomere is indicated with a different color (red, +1; blue, −1). Based on our previous studies (22,25), we consider that adjacent sarcomeric A-bands of the N×N adjacent myofibrils are well aligned in healthy muscles (Fig. 2, A and B) and misaligned in proteolysed muscles (Fig. 2, C–G).
Figure 2.
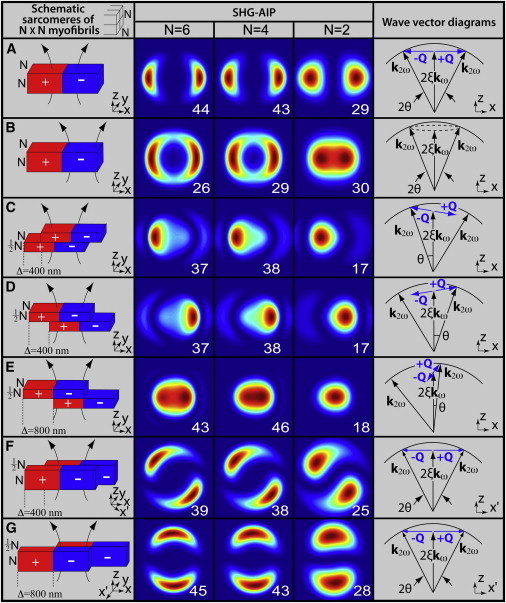
Theoretical SHG-AIPs and wave-vector diagrams for sarcomeres of N×N adjacent myofibrils. The schematic diagram, its corresponding SHG-AIP, and wave-vector diagram are shown (from left to right) for each simulation as indicated by column titles. Each sarcomere consists of a centered A-band formed by thick filaments with polarity transition of myosin molecules (indicated with red (+1) and blue (−1)). All thick filaments are supposed to be centered and well aligned in each sarcomere. The focusing region is shown in each schematic diagram. Each SHG-AIP is represented in the xy plane with a full scale corresponding to −40° +40° in x and y directions with normalized increasing intensity ranging from 0 (blue) to 1 (red). Note that the value (relative units) of the SHG intensity corresponding to integration over the entire image is also shown in each SHG-AIP. (A) Case of a laser beam at the center of all aligned sarcomeric A-bands. (B) Case of a laser beam at the center of the hemi-sarcomere. (C–E) Case of misaligned myofibrils in the xz plane. Wave-vector modulation Q rotates from x to z direction for increasing values of Δ. (F and G) Case of misaligned myofibrils in the xy plane. Wave-vector modulation Q is along the x′ direction and rotates from x to (−y) direction for increasing values of Δ. For all simulations, myofibrils have identical thickness ℓy = ℓz = 1 μm, Lx = 3 μm, Ly = Lz = 15 μm, and size of A-band is ℓx = 1.6 μm (22). Angle θ that is shown in each wave-vector diagram indicates the direction of maximum SHG intensity.
For healthy muscle, when the laser beam is at the center of the sarcomere (Fig. 2 A) where A-bands thick filaments show polarity inversion, SHG-AIP exhibits two spots of equal intensity aligned along the main fiber axis and symmetrically located from z = 0, as previously reported (22). Maximum SHG intensity is obtained for θ = 26°, θ = 25.6°, and θ = 23° for N = 6, N = 4, and N = 2, respectively. Such anisotropy of emission can be explained as follows. If we consider that the SHG signal is built in the x direction over the elementary distance 1.81 × wxy, polarity inversion occurring over such a distance induces a spatial modulation of the nonlinear susceptibility with a dominant modulation wave-vector component
which can be roughly approximated by
Qx is close to
the necessary modulation wave vector achieving Eq. 2. This result is schematized by the wave-vector diagram in the last column of Fig. 2 A. For N = 6, the angle of emission θ = 26° of maximum SHG intensity is close to the Gouy angle cos−1 ξ = 27.1°, demonstrating that Eq. 2 is achieved in that case. The slight decrease of θ for decreasing value of N is due to additional contribution of the modulation wave vector with the z component (Qz) owing to optical diffraction. When the laser beam is at the center of the hemi-A-band where polarity is uniform (Fig. 2 B), SHG-AIP presents an annular shape with two highlighted spots. Distance between these spots decreases with N, and SHG-AIP is almost one centered spot for N = 2. For N = 4 and N = 6, integrated SHG intensity (shown in each SHG-AIP thumbnail) is lower than in Fig. 2 A, indicating that Eq. 2 is not satisfied in that case as Q = 0.
SHG-AIPs of proteolysed muscle are also shown in Fig. 2 for different cases of myofibrillar misalignments. For misaligned myofibrils in the xz plane (Fig. 2, C–E), SHG-AIP has asymmetric spots with different intensities. For increasing value of misalignment Δ = 2Δx, the spot with the strongest intensity moves toward the center whereas the other moves away. SHG-AIP becomes one centered spot for Δ = 800 nm. We found that (data not shown) theoretical SHG-AIP is sensitive to myofibrillar misalignment below the optical resolution (<200 nm). For N = 4 and N = 6, despite the apparent centrosymmetry along the z direction due to polarity inversion, integrated SHG intensity is similar to that of Fig. 2 A, suggesting that Eq. 2 remains satisfied. Indeed, when Δ is nonzero, a z component (Qz) of the modulation-wave vector Q is induced. In consequence, Q rotates from x to z when Δ varies from 0 to 800 nm. As illustrated in the wave-vector diagrams, Eq. 2 is better satisfied for the spot that is close to the center. For Δ = 800 nm,
which is approximately
the necessary modulation wave vector achieving Eq. 2 in that case. For misaligned myofibrils in the xy plane (Fig. 2, F and G), SHG-AIP exhibits two spots of equal intensity. Direction of the two spots rotates from x to y direction when Δ increases from 0 (Fig. 2, A) to 800 nm (Fig. 2, G). In the latter case, the dominant modulation wave vector Q is along the y direction and the SHG-AIP is similar to that of Fig. 2 A with a rotation of 90°. Integrated SHG intensity is also unchanged, suggesting that Eq. 2 remains satisfied as illustrated in the wave-vector diagrams.
The main results of the theoretical analysis can be summarized as follows:
-
1.
For healthy muscle tissue, SHG-AIP signature is two symmetrical spots along the myofibril main axis. High SHG intensity is obtained at the center of the sarcomere because Eq. 2 is satisfied due to polarity inversion.
-
2.
For proteolysed muscle tissue, despite the apparent centrosymmetry induced by the myofibrillar misalignment, integrated SHG intensity over the SHG-AIP is comparable to that of healthy muscle tissue for a laser beam at the center of the sarcomere, suggesting that Eq. 2 remains satisfied.
-
3.
The shape of the SHG-AIP is also determined by direction and amplitude of the myofibrillar misalignment.
These theoretical simulations provide a framework to analyze experimental SHG-AIP results obtained from healthy and proteolysed Xenopus and mouse muscles, as follows.
Experimental Results
For healthy muscles, SHG images and experimental SHG-AIPs are shown in Fig. 3 for thick tissue (Fig. 3 A), bundle of myofibrils (Fig. 3 B), and isolated myofibril (Fig. 3 C). SHG intensity patterns exhibit the usual regular bright single-band SHG intensity pattern (SHG-IP) mapping the periodical sarcomeric distribution of myosin thick filaments both in thick tissue (Fig. 3 A) and bundle of myofibrils (Fig. 3 B) as previously reported in Recher et al. (24). For thick tissue, transversal views (Fig. 3 A) show that all sarcomeres are well registered at Z lines (xz section, bottom) and individual myofibrils cannot be resolved (yz section, right). SHG-AIPs of thick muscle tissue, bundle of myofibrils, and isolated myofibrils from the entire field always exhibit two distinguishable spots emitted along the myofibril main axis (Fig. 3 D, A0, B0, and C0) corresponding to the contribution of all imaged sarcomeric A-bands. However, SHG-AIPs are different between the center of the sarcomere (including the M line region of the sarcomere) and the hemi-filaments (crossed-bridge regions of myosin thick filaments) as illustrated for myofibrils (compare thumbnails B1, C1 and B2, C2 of Fig. 3 D). This result agrees well with the simulation corresponding to a laser beam focused either at the center of the sarcomere (Fig. 2 A) or at the center of the hemi-A-band (Fig. 2 B). Half-angles between the two spots in thumbnails B0, B1, and C1 of Fig. 3 D are ∼25° ± 1, which is close to the theoretical value 25.5° considering N = 4 (Fig. 2 A). When the laser beam is focused at the center of the hemi-sarcomere, SHG-AIP is either quite annular for bundle of myofibrils (Fig. 3 D, B2) or is a centered spot for isolated myofibril (Fig. 3 D, C2) which is well predicted by the theoretical simulation of Fig. 2 B considering N = 4 and N = 2, respectively.
Figure 3.

Experimental SHG-AIPs from healthy Xenopus gastrocnemius muscle. SHG image from (A) thick muscular tissue with transversal xz (bottom) and yz (right) sections, (B) bundle of myofibrils, and (C) single myofibril. (D) Corresponding SHG-AIPs. Note that each thumbnail is labeled by the letter of the corresponding figure followed by a number localizing the ROI in the figure. Thumbnails A0, B0, and C0 represent SHG-AIPs of the entire SHG image. Thumbnails B1 and C1 represent the average SHG-AIP from the center of all A-bands of myofibril bundles (B) and a single myofibril (C), respectively. Thumbnails B2 and C2 represent the average SHG-AIP from the remaining part of all sarcomeres of myofibril bundles (B) and a single myofibril (C), respectively. Full angular width of SHG-AIP in both x and y directions is 66° for panel A and 72° for panels B and C. (SHG-AIPs are in arbitrary units with increasing intensity from blue to red.) Scale bars are 10 μm for panel A and 2 μm for panels B and C.
For spontaneous post-mortem highly proteolysed muscle tissue, SHG images and experimental SHG-AIPs are shown in Fig. 4. SHG intensity profiles (Fig. 4 A) are characterized by a bright sarcomeric double-band SHG-IP along the direction of the myofibril main axis in agreement with our previous results (25). Transversal views (Fig. 4 A) show disorganized myofibrils with misaligned sarcomeres (xz section, bottom) such that individual myofibrils can be resolved (yz section, right). SHG-AIPs measured from the entire field and from large ROIs of the SHG image (n = 40 ROIs from 10 xy fields) are all one centered spot as illustrated in Fig. 4 B (A0–A2). As expected for such disorganized tissue, SHG-AIPs from localized ROIs (within the large ROIs) exhibit much more variability, suggesting that the centering of SHG-AIPs obtained from large ROIs is the result of the average of SHG-AIPs from several localized ROIs. It appears that mapping the spatial 3D myofibrillar organization from SHG-AIPs is complex from such highly proteolysed tissue. Nevertheless, for selective ROIs, SHG-AIPs (Fig. 4 B, A3–A6) can be easily explained based on the theoretical analysis. For example, we found that myofibril displacement is either along the x direction for ROIs 3 and 4 (compare Fig. 4 B, A3 and A4 with Fig. 2, C and D) or along the y direction for ROIs 5 and 6 (compare Fig. 4 B, A5 and A6 with Fig. 2, F and G). In contrast to highly proteolysed tissue, mild proteolysed muscle tissue provides a better understanding of the local 3D organization of myofibrils because a good correlation between experimental and theoretical SHG-AIPs can be easily obtained in that case, as illustrated in Fig. S2.
Figure 4.

Experimental SHG-AIPs from proteolysed Xenopus gastrocnemius muscle. SHG image from (A) thick slice of muscular tissue with transversal xz (bottom) and yz (right) sections and (B) corresponding SHG-AIPs. Note that each thumbnail is labeled by the letter of the corresponding figure followed by a number localizing the ROI in the figure. Note also that ROIs A0–A2 are large ROIs and A3–A6 are small ROIs. Full angular width of SHG-AIPs in both x and y directions is 66°. (SHG-AIPs are in arbitrary units with increasing intensity from blue to red.) Scale bar is 10 μm.
We then used SHG-AIP to characterize muscle proteolysis from the mouse model of Duchenne muscular dystrophy (mdx). Muscular dystrophies are a group of genetic diseases characterized by muscle weakness. The pathogenesis of Duchenne muscular dystrophy is frequently studied in the dystrophic mdx mouse model (29) and is characterized by muscle proteolysis and necrosis triggered by intracellular elevation of free calcium and oxidative stress (30–32). Experimental SHG images and SHG-AIPs of mdx mouse muscles are shown in Fig. 5. SHG image is characterized by a predominant bright single-band sarcomeric SHG-IP and less frequent Vernier-like sarcomere irregularities, as previously described by Friedrich et al. (33). Based on the intensity profile analysis method (4), we have estimated that sarcomere irregularities correspond to double-band sarcomeric SHG-IP and their percentage significantly increases from 5% ±2 (n = 30 random fields) in control BL10 to 16% ±3 (n = 30 random fields, p < 0.001, Student’s t-test) in mdx muscles. Single-band SHG-IP was found to reliably segregate BL10 from mdx muscles (ROC AUC 0.82, 95% confidence interval from 0.71 to 0.92, p-value < 0.001) as shown in Fig. 5 D. In mdx muscles, SHG-AIPs measured from large ROIs are illustrated in Fig. 5 A (ROIs 1–3). These large ROIs are chosen in regions with either single-band (ROI 1) or double-band (ROIs 2 and 3) sarcomeric SHG-IP. SHG-AIPs exhibit, as expected, either two spots or one centered spot (Fig. 5 B). SHG-AIP quantification was undertaken in the same random fields as for SHG-IP. Predominant SHG-AIP pattern was found to be two spots (78% ±5, p < 0.001, Student’s t-test) in BL10 muscles and one spot in mdx muscles (85% ±4, p < 0.001, Student’s t-test). Two spots or one-spot SHG-AIP was found to reliably segregate BL10 from mdx muscles (ROC AUC 0.97, 95% confidence interval from 0.93 to 1, p-value < 0.001) as shown in Fig. 5 D. Moreover, the ROC analysis curve suggested that the SHG-AIP method is more sensitive than the SHG-IP method to segregate BL10 from mdx muscles.
Figure 5.
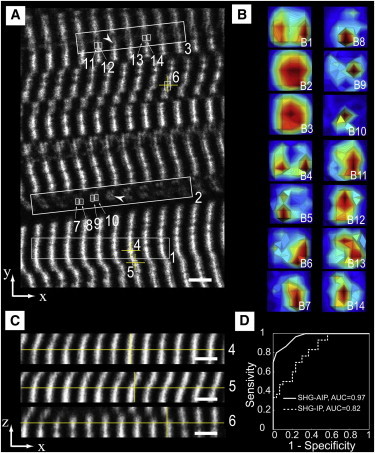
Experimental SHG-AIPs from mdx mouse muscle and ROC curve analysis. (A) SHG image from a thick slice of muscular tissue. Note that ROIs 1–3 are large ROIs and 4–14 are small ROIs. The sarcomeric SHG intensity pattern feature of ROIs 1, 4–6 is single-band and that of ROIs 2, 3, 7–14 is double-band. Note also that ROIs 7–10 and ROIs 11–14 correspond to two different myofibrils (arrowheads). (B) Corresponding SHG-AIPs. Note that each thumbnail is labeled by the letter of the corresponding figure followed by a number localizing the ROI in the figure. Note also that thumbnails B7–B10 suggest complex myofibrillar displacement, whereas thumbnails B11–B14 suggest a simpler myofibrillar displacement found mainly along the x direction. Full angular width of SHG-AIP in both x and y directions is 60°. (SHG-AIPs are in arbitrary units with increasing intensity from blue to red.) (C) Transversal xz views. Each xz view is obtained at the center (yellow cross) of the corresponding ROI (labeled with the same number) in panel A. (D) Discrimination of control BL10 and dystrophic mdx muscles using receiver operating characteristic (ROC) curve and area under curve (AUC) analysis. (Continuous curve) Percentage of ROIs with two spots SHG-AIP in each random field analyzed. (Dotted curve) Percentage of ROIs with single-band sarcomeric SHG-IP in the same random fields. Note that AUC for each curve is indicated in the figure. The 95% confidence intervals are 0.93–1 and 0.71–0.92, respectively, for SHG-AIP and SHG-IP ROC AUC. Data are from 12 animals (six BL10 and six mdx), 30 random fields (60 × 60 μm) in each group. Eight homogeneously distributed ROIs in the entire field were analyzed (see Materials and Methods). Scale bar is 5 μm.
Compared to large ROIs, SHG-AIPs from small ROIs exhibit more heterogeneity even in regions with single-band SHG-IP. In these latter, mdx skeletal muscle tissue appears to be strongly deformed. This distortion induces localized myofibrillar misalignment either along x or −x directions as observed in the xz sections (Fig. 5 C). Corresponding SHG-AIPs (Fig. 5 B) are asymmetrical spots emitted in a direction that is opposite to the myofibrillar misalignment, in agreement with the results reported in Fig. S2. SHG-AIPs from two different myofibrils (arrowheads in Fig. 5 A) with double-band sarcomeric SHG-IP were also analyzed to determine their local displacement. SHG-AIPs (Fig. 5 B) suggest that myofibrillar displacement is mainly along the x direction for one myofibril (ROIs A11–A14) and is more complex for the other (ROIs A7–A10). From the above results, we conclude that SHG-AIP is a powerful tool to determine the local 3D myofibrillar disorganization of pathological muscular tissue.
Discussion
In this report, we have shown that myosin thick filament polarity inversion occurring at the center of the sarcomere is responsible for scattering of harmonic light in muscular tissue. Directions of scattering are determined by the local 3D organization of a few myofibrils in the focusing volume. We have calculated SHG-AIP in muscle tissue to gain insight into the organization of myofibrils both in physiological and nonphysiological conditions. We have also reported, to our knowledge for the first time, experimental SHG-AIPs in muscle tissue obtained by modification of the experimental setup. We found that experimental SHG-AIP of healthy muscle is characterized by two symmetrical spots emitted along the myofibril main axis in agreement with the theoretical simulation. Moreover, the variability of SHG-AIP observed for proteolysed muscle tissue makes evident that the SHG-AIP technique is very sensitive in probing the local 3D myofibrillar displacements.
Theoretical simulation is based on a simplified structural model of myofibrils that is sufficient to explain the observed experimental results. In this model, myofibrils have a rectangular shape and thick filaments are supposed to be well aligned and centered in each sarcomere. The M-band at the center of each sarcomere and the sarcoplasmic reticulum are also neglected as their volume is small compared to the one of the PSF. It is taken into account that these parameters modify the overall SHG intensity but not the shape of the SHG-AIP, which is controlled by the modulation wave vector Q associated with myofibrillar displacement. Modulus of Q is also defined by the size of the PSF. It ranges from ∼π/wxy(= 6.5 μm−1) for healthy muscle with polarity transition only along the x direction to ∼π/wz(= 1.3 μm−1) for proteolysed muscle with polarity transition only along the z direction. Theoretical simulation shows that SHG intensity is built only over a small excitation volume (1.81)3 × w2xy × wz of ∼3 μm3 in our experimental conditions. Therefore, SHG-AIP provides structural information within this volume that corresponds to 4–8 myofibrils of 1-μm average diameter (34). We found this simple model sufficient to explain the observed experimental results. As the SHG process is a result of constructive interferences between harmonic waves, we show that high SHG intensity can be obtained in biological tissue only for nonzero wave vectors Q as expressed by Eq. 2. For the particular case of myosin muscle tissue, we also showed that polarity transition occurring at the center of the A-band drastically affects Q values and therefore SHG-AIPs.
For healthy tissue, polarity transition at the center of the sarcomere results in a better constructive interference process and an overintensity (Fig. 2 A and Fig. 3 A) compared to the center of the hemi-sarcomere (Fig. 2 B and Fig. 3 A) where polarity is homogeneous as previously reported in Rouède et al. (22). In contrast to thick tissue, integrated SHG intensity for isolated myofibrils is lower at the center of the sarcomere when compared to the center of the hemi-sarcomere both in the experimental results (Fig. 3 C) and in the simulation (Fig. 2, A and B, N = 2). For N = 1, integrated SHG intensity is 11 at the center of the sarcomere and 14 at the center of the hemi-sarcomere (data not shown). This implies that sarcomeric SHG-IP is double-band in healthy myofibril and therefore this pattern cannot be a marker of proteolysis in isolated myofibrils, in contrast to our previous suggestion in Recher et al. (24).
The overintensity observed at the center of the hemi-sarcomere for isolated myofibril is explained as follows: SHG-AIP is more centered for N = 2 (and N = 1) than for N = 4 or 6. Consequently, at low θ-value, constructive and destructive interferences between harmonic photons, respectively, are generated at the center of the hemi-sarcomere and at the center of the sarcomere as previously explained in Rouède et al. (22). As a result, higher SHG intensity is obtained at the center of the hemi-sarcomere than at the center of the sarcomere for N = 1 or 2.
We have previously shown that sarcomeric SHG-IP analysis enables discrimination between healthy and proteolysed muscle tissue (25). This method classifies sarcomeric SHG-IP as single-band or double-band, respectively, for healthy and proteolysed muscle tissues. In this study, ROC curve analysis suggests that SHG-AIP (ROC AUC = 0.97) and SHG-IP (ROC AUC = 0.82) are very sensitive methods to discriminate between healthy and diseased mdx muscles. In a previous study, evaluation of muscle damage based on a single-sarcomere pattern parameter alone—either a fraction of non-hyper-contracted sarcomeres or their mean length—was found insufficient (ROC AUC = 0.75) for clear discrimination of mild or moderate mdx muscle from control sample (26). In that study, combination of three sarcomere pattern parameters was necessary to achieve sensitivity (ROC AUC = 1) greater than that of the SHG-AIP method described herein. From this study, we conclude that SHG-AIP with two symmetrical spots is a signature of healthy myofibrils whereas SHG-AIP with one centered spot in mdx muscle is a signature of myofibrillar disorder. Therefore, SHG-AIP analysis could be a useful tool to map myofibrillar alignment in muscle tissues during development, maturation, and regeneration and gain access to their biological cues.
The pathogenesis of Duchenne muscular dystrophy is characterized by muscle proteolysis and necrosis triggered by intracellular elevation of free calcium and oxidative stress (30–32). The increase of double-band sarcomeric SHG-IP that we observed in mdx mouse is in agreement with our previous report showing that oxidative stress and muscle proteolysis affect sarcomeric SHG-IP (24,25,35). The myofibrillar misalignment revealed by SHG-AIP also reflects this proteolysis even in myofibrils that are presumed to be healthy considering sarcomeric SHG-IP analysis. However, the consequence of this myofibrillar misalignment on the E-C coupling awaits further studies. We anticipate that SHG-AIP will be a useful tool to probe structural modification affecting the E-C coupling. This latter is the mechanism that links transverse tubule (T-tubule) depolarization to Ca2+ release from the sarcoplasmic reticulum that triggers, in turn, muscle contraction. T-tubules are orderly invaginations of surface membrane along the Z-line regions, with regular spacing (∼2 μm) along myofibrils. This widely distributed, highly organized T-tubule system is essential for rapid electric excitation and coordinated contraction of each contractile unit throughout the entire cytoplasm. Alteration of this T-tubule system and E-C coupling by myofibrillar displacements is expected to reduce muscle contraction.
In heart diseases such as heart failure and ischemia, myofibril disorganization and T-tubule disorganization or loss have been linked to decreased contractility (36,37). In skeletal muscle, mutations in sarcomeric proteins are known to cause ∼20 different diseases; however, the pathophysiology of the gene defects remains remarkably obscure (38). Structural myofibrillar disorganization is observed in several human skeletal muscle diseases including Duchenne muscular dystrophy (39). Genetic studies from mouse have shown that mutation of the cytoskeleton intermediate-filament desmin gene results in myofibrillar misalignment, reduced muscle tension, compromised endurance performance, and more susceptibility to damage due to eccentric exercise (40,41). We anticipate that SHG-AIP will be of paramount importance to study, in thick tissue, the spatial correlation between myofibrillar disorganization and E-C disruption occurring in physiological adaptation and in disease.
Conclusion
In this work, we report second harmonic scattering of light by muscular tissue. We show that angular emission of SHG light is driven by the local 3D myofibrillar organization in the excitation volume. Compared to the SHG intensity pattern, we also show that SHG-AIP provides extra hints to map, at suboptical resolution, the local 3D myofibrillar organization of both healthy and pathological muscle tissue.
Acknowledgments
This work was supported by Région Bretagne, Rennes Métropole, Conseil Général d’Ille-et-Villaine, Centre de Recherche, d’Innovation et de Transfer de Technologie Santé Bretagne, and Ministère de l’Enseignement Supérieur et de la Recherche.
Supporting Material
References
- 1.Campagnola P.J., Loew L.M. Second-harmonic imaging microscopy for visualizing biomolecular arrays in cells, tissues and organisms. Nat. Biotechnol. 2003;21:1356–1360. doi: 10.1038/nbt894. [DOI] [PubMed] [Google Scholar]
- 2.Zipfel W.R., Williams R.M., Webb W.W. Nonlinear magic: multiphoton microscopy in the biosciences. Nat. Biotechnol. 2003;21:1369–1377. doi: 10.1038/nbt899. [DOI] [PubMed] [Google Scholar]
- 3.Lacomb R., Nadiarnykh O., Campagnola P.J. Phase matching considerations in second harmonic generation from tissues: effects on emission directionality, conversion efficiency and observed morphology. Opt. Commun. 2008;281:1823–1832. doi: 10.1016/j.optcom.2007.10.040. [DOI] [PMC free article] [PubMed] [Google Scholar]
- 4.Han M., Giese G., Bille J.F. Second harmonic generation imaging of collagen fibrils in cornea and sclera. Opt. Express. 2005;13:5791–5797. doi: 10.1364/opex.13.005791. [DOI] [PubMed] [Google Scholar]
- 5.Williams R.M., Zipfel W.R., Webb W.W. Interpreting second-harmonic generation images of collagen I fibrils. Biophys. J. 2005;88:1377–1386. doi: 10.1529/biophysj.104.047308. [DOI] [PMC free article] [PubMed] [Google Scholar]
- 6.Theodossiou T.A., Thrasivoulou C., Becker D.L. Second harmonic generation confocal microscopy of collagen type I from rat tendon cryosections. Biophys. J. 2006;91:4665–4677. doi: 10.1529/biophysj.106.093740. [DOI] [PMC free article] [PubMed] [Google Scholar]
- 7.Pfeffer C.P., Olsen B.R., Légaré F. Second harmonic generation imaging of fascia within thick tissue block. Opt. Express. 2007;15:7296–7302. doi: 10.1364/oe.15.007296. [DOI] [PubMed] [Google Scholar]
- 8.Légaré F., Pfeffer C., Olsen B.R. The role of backscattering in SHG tissue imaging. Biophys. J. 2007;93:1312–1320. doi: 10.1529/biophysj.106.100586. [DOI] [PMC free article] [PubMed] [Google Scholar]
- 9.Fu Y., Wang H., Cheng J.X. Second harmonic and sum frequency generation imaging of fibrous astroglial filaments in ex vivo spinal tissues. Biophys. J. 2007;92:3251–3259. doi: 10.1529/biophysj.106.089011. [DOI] [PMC free article] [PubMed] [Google Scholar]
- 10.Wang B.-G., Eitner A., Halbhuber K.J. High-resolution two-photon excitation microscopy of ocular tissues in porcine eye. Lasers Surg. Med. 2008;40:247–256. doi: 10.1002/lsm.20628. [DOI] [PubMed] [Google Scholar]
- 11.Han X., Burke R.M., Brown E.B. Second harmonic properties of tumor collagen: determining the structural relationship between reactive stroma and healthy stroma. Opt. Express. 2008;16:1846–1859. doi: 10.1364/oe.16.001846. [DOI] [PubMed] [Google Scholar]
- 12.Hsueh C.-M., Lo W., Dong C.Y. Structural characterization of edematous corneas by forward and backward second harmonic generation imaging. Biophys. J. 2009;97:1198–1205. doi: 10.1016/j.bpj.2009.05.040. [DOI] [PMC free article] [PubMed] [Google Scholar]
- 13.Campagnola P.J., Dong C.-Y. Second harmonic generation microscopy: principles and applications to disease diagnosis. Laser Photonics Rev. 2011;5:13–26. [Google Scholar]
- 14.Freund I. Nonlinear diffraction. Phys. Rev. Lett. 1968;21:1404–1406. [Google Scholar]
- 15.Freund I., Deutsch M., Sprecher A. Connective tissue polarity. Optical second-harmonic microscopy, crossed-beam summation, and small-angle scattering in rat-tail tendon. Biophys. J. 1986;50:693–712. doi: 10.1016/S0006-3495(86)83510-X. [DOI] [PMC free article] [PubMed] [Google Scholar]
- 16.Dolino G., Lajzerow J., Vallade M. Second-harmonic light scattering by domains in ferroelectric triglycine sulfate. Phys. Rev. B. 1970;2:2194. [Google Scholar]
- 17.Rouède D., Le Grand Y., Scherf C. Study of antiparallel pyroelectric twins in KLiSO4 by second-harmonic scattering. Opt. Commun. 2000;178:225–232. [Google Scholar]
- 18.Mertz J., Moreaux L. Second-harmonic generation by focused excitation of inhomogeneously distributed scatterers. Opt. Commun. 2001;196:325–330. [Google Scholar]
- 19.Tian L., Qu J.L., Deng X.Y. Microscopic second-harmonic generation emission direction in fibrillous collagen type I by quasi-phase-matching theory. J. Appl. Phys. 2010;108:054701. [Google Scholar]
- 20.Tian L., Wei H.J., Deng X. Backward emission angle of microscopic second-harmonic generation from crystallized type I collagen fiber. J. Biomed. Opt. 2011;16:075001. doi: 10.1117/1.3596174. [DOI] [PubMed] [Google Scholar]
- 21.Mertz J. Roberts; Greenwood Village, CO: 2010. Introduction to Optical Microscopy. [Google Scholar]
- 22.Rouède D., Recher G., Tiaho F. Modeling of supramolecular centrosymmetry effect on sarcomeric SHG intensity pattern of skeletal muscles. Biophys. J. 2011;101:494–503. doi: 10.1016/j.bpj.2011.05.065. [DOI] [PMC free article] [PubMed] [Google Scholar]
- 23.Gouy L.G. On a new property of light waves [Sur une propriété nouvelle des ondes lumineuses] C. Roy. Acad. Sci. Paris. 1890;110:1251–1253. [Google Scholar]
- 24.Recher G., Rouède D., Tiaho F. Double-band sarcomeric SHG pattern induced by adult skeletal muscles alteration during myofibrils preparation. J. Microsc. 2011;241:207–211. doi: 10.1111/j.1365-2818.2010.03425.x. [DOI] [PubMed] [Google Scholar]
- 25.Recher G., Rouède D., Tiaho F. Three distinct sarcomeric patterns of skeletal muscle revealed by SHG and TPEF microscopy. Opt. Express. 2009;17:19763–19777. doi: 10.1364/OE.17.019763. [DOI] [PubMed] [Google Scholar]
- 26.Plotnikov S.V., Kenny A.M., Mohler W.A. Measurement of muscle disease by quantitative second-harmonic generation imaging. J. Biomed. Opt. 2008;13:044018. doi: 10.1117/1.2967536. [DOI] [PubMed] [Google Scholar]
- 27.Mertz J. Nonlinear microscopy. C. Roy. Acad. Sci., Ser. IV Phys. Astrophys. 2001;2:1153–1160. [Google Scholar]
- 28.Bendat J.S. John Wiley and Sons; Hoboken, NJ: 2010. Random Data: Analysis and Measurement Procedures. [Google Scholar]
- 29.Bulfield G., Siller W.G., Moore K.J. X chromosome-linked muscular dystrophy (mdx) in the mouse. Proc. Natl. Acad. Sci. USA. 1984;81:1189–1192. doi: 10.1073/pnas.81.4.1189. [DOI] [PMC free article] [PubMed] [Google Scholar]
- 30.Turner P.R., Westwood T., Steinhardt R.A. Increased protein degradation results from elevated free calcium levels found in muscle from mdx mice. Nature. 1988;335:735–738. doi: 10.1038/335735a0. [DOI] [PubMed] [Google Scholar]
- 31.Franco A., Jr., Lansman J.B. Calcium entry through stretch-inactivated ion channels in mdx myotubes. Nature. 1990;344:670–673. doi: 10.1038/344670a0. [DOI] [PubMed] [Google Scholar]
- 32.Tidball J.G., Wehling-Henricks M. The role of free radicals in the pathophysiology of muscular dystrophy. J. Appl. Physiol. 2007;102:1677–1686. doi: 10.1152/japplphysiol.01145.2006. [DOI] [PubMed] [Google Scholar]
- 33.Friedrich O., Both M., Garbe C. Microarchitecture is severely compromised but motor protein function is preserved in dystrophic mdx skeletal muscle. Biophys. J. 2010;98:606–616. doi: 10.1016/j.bpj.2009.11.005. [DOI] [PMC free article] [PubMed] [Google Scholar]
- 34.Colomo F., Piroddi N., Tesi C. Active and passive forces of isolated myofibrils from cardiac and fast skeletal muscle of the frog. J. Physiol. 1997;500:535–548. doi: 10.1113/jphysiol.1997.sp022039. [DOI] [PMC free article] [PubMed] [Google Scholar]
- 35.Recher G., Rouède D., Tiaho F. Skeletal muscle sarcomeric SHG patterns photo-conversion by femtosecond infrared laser. Biomed. Opt. Express. 2011;2:374–384. doi: 10.1364/BOE.2.000374. [DOI] [PMC free article] [PubMed] [Google Scholar]
- 36.Song L.S., Sobie E.A., Cheng H. Orphaned ryanodine receptors in the failing heart. Proc. Natl. Acad. Sci. USA. 2006;103:4305–4310. doi: 10.1073/pnas.0509324103. [DOI] [PMC free article] [PubMed] [Google Scholar]
- 37.Lyon A.R., MacLeod K.T., Gorelik J. Loss of T-tubules and other changes to surface topography in ventricular myocytes from failing human and rat heart. Proc. Natl. Acad. Sci. USA. 2009;106:6854–6859. doi: 10.1073/pnas.0809777106. [DOI] [PMC free article] [PubMed] [Google Scholar]
- 38.Laing N.G., Nowak K.J. When contractile proteins go bad: the sarcomere and skeletal muscle disease. Bioessays. 2005;27:809–822. doi: 10.1002/bies.20269. [DOI] [PubMed] [Google Scholar]
- 39.Dubowitz V., Sewry C.A. 3rd Ed. Elsevier; London: 2007. Muscle Biopsy: A Practical Approach. [Google Scholar]
- 40.Lovering R.M., O’Neill A., Bloch R.J. Physiology, structure, and susceptibility to injury of skeletal muscle in mice lacking keratin 19-based and desmin-based intermediate filaments. Am. J. Physiol. Cell Physiol. 2011;300:C803–C813. doi: 10.1152/ajpcell.00394.2010. [DOI] [PMC free article] [PubMed] [Google Scholar]
- 41.Li Z., Mericskay M., Paulin D. Desmin is essential for the tensile strength and integrity of myofibrils but not for myogenic commitment, differentiation, and fusion of skeletal muscle. J. Cell Biol. 1997;139:129–144. doi: 10.1083/jcb.139.1.129. [DOI] [PMC free article] [PubMed] [Google Scholar]
Associated Data
This section collects any data citations, data availability statements, or supplementary materials included in this article.