

Abstract
Panax quinquefolius L (P. quinquefolius L) samples grown in the United States and China were analyzed with high performance liquid chromatography–mass spectrometry (HPLC–MS). Prior to classification, the two-way data sets were subjected to pretreatment including baseline correction and retention time (RT) alignment. Principal component analysis (PCA) and projected difference resolution (PDR) metrics were used to evaluate the data quality and the pretreatment effects. A fuzzy rule-building expert system (FuRES) classifier was used to classify the P. quinquefolius L samples grown in the United States and China with the optimized partial least-squares (o-PLS) classifier as the positively biased control method. A classification rate as high as 98 ± 3% with FuRES was obtained after baseline correction and RT alignment, which is equivalent to the result obtained by using the positively biased o-PLS control method (98 ± 3%). RT alignment improved the classification rates for both FuRES and o-PLS classifiers (18% improvement for the FuRES classification rate and 10% improvement for the o-PLS classification rate with baseline correction). From the rule obtained to classify the P. quinquefolius L samples grown in the United States and China, peaks were identified that can be prospective biomarkers for differentiating samples from different growth regions. HPLC–MS with chemometric analysis has the potential to be used as an authentication method for P. quinquefolius L grown in China and the United States.
Ginseng has been widely used as an important medicinal herb or a dietary supplement in the Far East for a few thousand years and has gained more recognition in the West in the last few decades.1 All species in the genus Panax contain common constituents including ginseng saponins (ginsenosides), polysaccharides, polyynes, flavonoids, volatile oils, polyacetylenic alcohols, and fatty acids, among which ginsenosides are considered the major bioactive ingredients for their therapeutic effects.1–4
As one of the main species in the Panax genus, Panax quinquefolius L (P. quinquefolius L, American ginseng) has been reported to have the functions of reducing stress, lowering high blood sugar, modulating the immune system, improving working memory, and preventing cancer, etc.5–8 Nevertheless, the same P. quinquefolius L species cultivated in different geographical locations can result in differences in chemical compositions especially for the medicinal active ginsenosides although the differences within the species (differences ranging from 4% to 10% of a total ginsenosides content in P. quinquefolius L roots2) are much smaller than those among species in the same Panax genus.9,10 The differences within the same P. quinquefolius L species cultivated in different geographical locations can cause differences in medicinal efficacy, but the differentiation of cultivation regions as part of the quality control process is more difficult than the differentiation among different species of the Panax genus because of the great similarity in chemical constituents among different cultivars. Several reports have been available in the literature focusing on the differentiation among species of the same Panax genus, different cultivars or different ages of the same species by employing DNA sequencing,11 high performance liquid chromatography (HPLC) with either a UV detector or a mass spectrometer detector,12,13 infrared spectroscopy,14–16 Raman spectroscopy,14,17 NMR,18,19 etc. Among all the analytical methods for the analysis of ginseng, HPLC coupled with a mass spectrometer (HPLC–MS) is a powerful technique used for this purpose. HPLC–MS has been demonstrated as very effective and versatile not only for the structure identification and quantification of the ginsenosides, but also can yield a profile that is rich in information for profiling.13,20–28
If a suitable analytical method is carefully chosen, a chemical fingerprint that profiles the chemical composition of a botanical product such as ginseng can be developed. As an alternative to conventional methods that use active ingredients such as ginsenosides as biomarkers,19 chemical fingerprinting is frequently used in quality control, authentication, and differentiation of ginseng products with the help of chemometric methods such as pattern recognition, spectral correlative chromatograms, similarity estimation, and multivariate resolution.25,29
Chemometrics has shown superb utility in obtaining information from complex data sets. It is especially useful in the differentiation and classification of samples that give complicated chromatographic and spectral fingerprints, which is usually an overwhelming task to distinguish by visual examination.30,31 Of the chemometric pattern recognition techniques, the fuzzy rule-building expert system (FuRES) has shown utility and robustness in differentiation and classification of samples for many applications.32–37 Because the differences among ginseng samples cultivated in different geographical locations are smaller with respect to the chemical profiles as compared with those among different species of Panax genus, classification and prediction of ginseng sample types from the same species from different origins presents a formidable problem.38,39 To date, only one report has been published focusing on the differentiation of P. quinquefolius L samples grown in the United States and China.10 This report illustrated the chromatographic differences between growing locations, but it never quantitatively evaluated the classification.
In the present study, classifiers were constructed to discriminate P. quinquefolius L samples grown in different regions of China and the United States. Using HPLC–MS as the two-way data collection method to obtain the chromatographic and spectral fingerprints of each sample, FuRES was used to predict cultivation locations of these two classes of ginseng samples. Data preprocessing techniques such as baseline correction and retention time (RT) alignment were necessary because baseline and RT shift affected the classification accuracy.31
EXPERIMENTAL SECTION
1. Samples, Reagents, and Sample Pretreatment
P. quinquefolius L samples grown in China (12 samples) and in the United States (12 samples) were used. The information of age, size, and specific locations in each country was not completely available and was believed to vary (see the Supporting Information).
HPLC-grade acetonitrile (EMD Chemicals Inc., Gibbstown, NJ) and HPLC-grade methanol (PHARMCO-AAPER, Brookfield, CT, US) were used for the mobile phase components and the extracting solvent, respectively. Deionized water (18 MΩ) for sample preparation and as one component of the mobile phase was obtained using a water purification system (Nanopure Diamond Barnstead, Thermo Scientific).
Ginseng root samples were ground into fine powder and extracted with methanol–water (60:40, volume ratio) assisted by sonication. The extracted samples were centrifuged and then the supernatant was filtered by using 13-mm (pore size of 0.45 μm) polyvinylidene fluoride (PVDF) syringe filters (General Separation Technologies, Inc., US).
2. Instrumentation
An Agilent 1100 HPLC equipped with a SUPELCOSIL RP LC-C18 column (25 cm × 4.6 mm × 5 μm) was used for separation. A Thermo Finnigan PolarisQ mass spectrometer modified with a Thermo Finnigan Deca XP electrospray ionization (ESI) source and ion optics was used to couple with the HPLC for the online mass spectra collection, as described previously.40 Data was collected using the XCalibur development kit (XDK) provided by Thermo and was custom-modified in Visual Basic 6.0 (Redmond, WA, USA).
3. HPLC-MS Data Collection Conditions
The mobile phase was composed of (A) water and (B) acetonitrile. Gradient elution was used as detailed in the Supporting Information. The column temperature was controlled at 35 °C.
For the mass spectra collection, a mass range extension (MRE) program was written to eject ions at a qz value of 0.45 to double the mass scan range. The mass spectra were collected in negative ion mode with voltage of −4.5 kV. The capillary temperature was set to 350 °C, and the electron-multiplier was set to 1.375 kV.
4. Data Pretreatment
4.1. Baseline Correction
In this work, the baseline of the total ion current (TIC) chromatograms of all 24 samples was corrected with this in-house algorithm described in the Theory section of the Supporting Information with an error threshold of 0.41 One hundred spectra at the end of each chromatogram where there was no analytical signal were chosen to build the basis set that comprised 50 orthogonal components.
4.2. RT Alignment
RT variation among runs is a factor influencing classification rates because in this work two-way (TIC chromatograms and mass spectra) data sets were used for the classification instead of peak tables. RTs were aligned with an in-house program that uses a polynomial to adjust the retention times so that the correlation with the mean spectrum is maximized. The correlation is applied to the two-way image so distinct mass peaks assist in the alignment process. The alignment algorithm uses a dendrogram based on Euclidean distance to define nearest neighbors of the two-way images. Each pair of neighbors is aligned to their average two-way object. Once this alignment is achieved, the algorithm iteratively aligns the objects to the averages of the aligned objects calculated at each branch of the dendogram until the root of the tree is obtained. In other words the training objects will ultimately be aligned to a global average. This global average is stored, and then, each prediction object is aligned to this global average.
An object is aligned with respect to retention time to the average object using a polynomial mapping of retention times (i.e., a fourth-order polynomial was used). The mapping function stretches or compresses the retention times. For each new retention time, the mass peaks are calculated using the “pchip” interpolation, an option of the MATLAB “interp1” function. Lastly, the Euclidean correlation of the two-way object to the average two-way object is calculated. The correlation is maximized by optimizing the polynomial coefficients using a nonlinear simplex (MATLAB function “fminsearch”).
5. Classification by the FuRES Classifier with Optimized-PLS as the Control Method
After the pretreatment of the data sets, FuRES and o-PLS models were constructed using identical data for model building. The model-building and prediction data were selected using three Latin partitions that were bootstrapped 10 times.42 The prediction results across the three partitions were pooled and then averaged across the 10 bootstraps.
RESULTS AND DISCUSSION
1. Optimization of Data Collection Methods
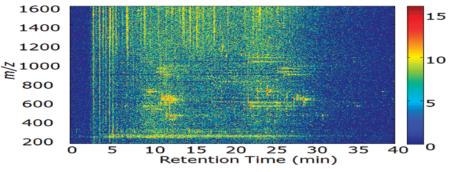
In this work, the purpose was to quantitatively discriminate US grown P. quinquefolius L samples from Chinese grown P. quinquefolius L samples using HPLC-MS data. The HPLC run time was optimized to 40 min while the separation of components served well for the classification. The separation of components can be seen in a two-way data image (the TIC chromatogram and mass spectra that is displayed in the Supporting Information). In this figure, a complex and rich pattern of peaks can be seen.
2. Pretreatment Effects of Data
Baseline drift can adversely affect pattern recognition. The comparison between the TIC chromatograms before and after baseline correction treatment is given in Figure 1. From this figure, it can be seen that the background was attenuated but not completely removed. The reason the baseline is nonzero results from the selection of a zero error threshold for the regularization. When the nonzero background residuals are integrated to furnish the TIC, the outcome will result in a constant baseline. However, the drift from the solvent program was leveled while the peak intensity and shapes were preserved.
Figure 1.
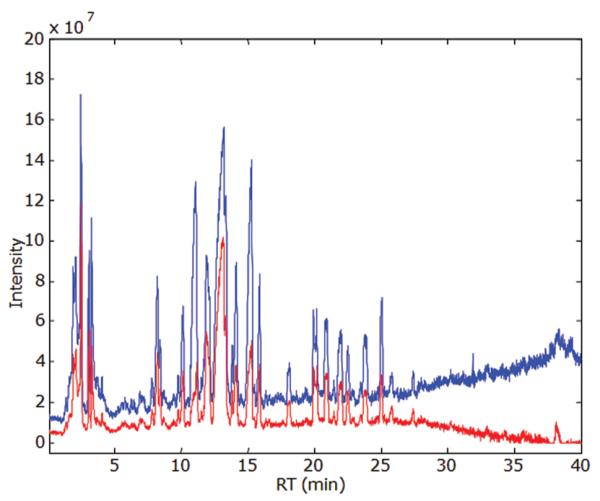
Demonstration of baseline correction effect. Blue is before baseline correction; red is after baseline correction. The TIC of sample WSQ2 (AM) is calculated from the baseline corrected two-way image.
RT alignment of TIC chromatograms is essential for cases when two-way profiles are directly compared or for comparison of one-way ion chromatograms. When the retention times of the LC peaks shift, similar samples will be separated in the data space making classification more difficult. RT drift can be caused by column degeneration, column contamination, fluctuation in the mobile phase, and/or any other environmental factors such as temperature changes.
The chromatograms were aligned using the two-way data to exploit all the information available from the mass spectral domain. The TIC chromatograms of all 24 samples are plotted to demonstrate the effect of RT alignment in Figure 2. In Figure 2A, RT drift of the chromatograms among different runs is apparent. In Figure 2B, the alignment has corrected the RT drift. A consequence of this unbiased alignment procedures is the similarity among chromatograms will increase which may reduce the projected difference resolution (PDR) values among the classes.31,36,37,43,44 The RT alignment improved the classification rate significantly as discussed in the section of classification results.
Figure 2.

Reconstructed total ion current chromatograms with baseline correction before (A) and after (B) RT alignment. RT from 0.5 to 28 min was used for classification.
3. Principal Component Analysis (PCA) Results
PCA scores of the data objects with baseline correction before and after RT alignment are given in Figure 3. The ellipses are the 95% confidence intervals around the mean of each class. The relative and the absolute variances of the PCs are given as the numbers in the parentheses. Although the object scores are still overlapped, the alignment improved the separation of the two classes. However, only two dimensions (PCs) are given here; there is a possibility that the clusters may be resolved in the higher dimensional data space as will be discussed in the FuRES and o-PLS Classification Results section.
Figure 3.
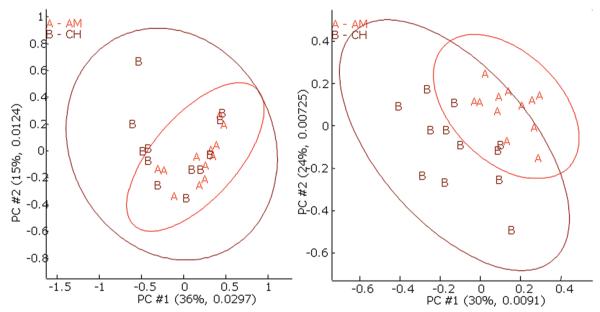
PCA score plots of samples before (left) and after (right) RT alignment with baseline correction. Note: The ellipses show 95% confidence intervals. The first two principal components span 51% of the variance before RT alignment and 54% of the variance after RT alignment. The second number in the parentheses denotes the absolute variance.
4. PDR Results
A PDR value is analogous to chromatographic resolution in that a value of 1.5 or higher is considered to be the criterion for two classes to be baseline-resolved in a multidimensional data space. The minimum PDR value represents the worst separation between two classes. The minimum resolutions of the ginseng data after baseline correction with 10 bootstraps with and without RT alignment were 0.89 ± 0.03 and 0.52 ± 0.03, respectively, which demonstrates a significant improvement. Although the minimum PDR value did not exceed 1.5, the FuRES models would yield accurate classification as will be seen later. A value of 1.5 indicates the class distributions are resolved along a vector defined by the differences between the data averages of a pair of classes. For PDR, this difference vector may not be optimal for resolving data from some classes.
5. FuRES and o-PLS Classification Results
Randomly selected subsets of the two-way data objects were used to build 30 FuRES models and 30 o-PLS models in a matched fashion so that each method was evaluated with the same data. The models were constructed from three Latin partitions and ten bootstraps. For each bootstrap, the Latin partition divides the data into a training set and a prediction set, so that each two-way object was used only once for prediction and the same class distributions are maintained between training and prediction sets. Principal component transformation was used to compress the model building data size to 16 × 16 for building classifiers. The prediction data set was compressed by projection onto the same principal components that were calculated from the training data set and a data size of 8 × 16 was obtained. Each evaluation took about 30–40 min of CPU time.
The average prediction rates before and after RT alignment, with and without baseline correction, which are reported with 95% confidence intervals for the ten bootstrapped Latin partitions, are given in Table 1.
Table 1.
Classification Rates with 95% Confidence Intervals by FuRES and o-PLS Classifiers with No Alignment (−RT) and RT Aligned (+RT) and without Baseline Correction (−BC) and with Baseline Correction (+BC)a
| −RT, −BC | +RT, −BC | −RT, +BC | +RT, +BC | |
|---|---|---|---|---|
| FuRES | 86 ± 6% | 99 ± 1% | 80 ± 4% | 98 ± 3% |
| o-PLS | 94 ± 5% | 99.6 ± 0.9% | 88 ± 3% | 98 ± 3% |
| FuRESa | 89 ± 3% | 95 ± 2% | 87 ± 5% | 96 ± 1% |
| o-PLSa | 93 ± 2% | 97 ± 2% | 94 ± 5% | 96 ± 3% |
Alignments that were applied to the calibration set, and the prediction data were fit to the mean of the aligned training data.
From Table 1, one can see that RT alignment improved the classification accuracy. RT alignment improved the classification rates significantly both with baseline correction (80 ± 4–98 ± 3% for FuRES and 88 ± 3–98 ± 3% for o-PLS) and without baseline correction (86 ± 6–99 ± 1% for FuRES and 94 ± 4–99.6 ± 0.9% for o-PLS) with both the FuRES and o-PLS classifiers. Baseline correction decreased the classification rates of the two ginseng classes when the retention times were aligned afterward. The classification results are given without and with baseline correction as follows: 99 ± 1%, 98 ± 3% for FuRES and 99.6 ± 0.9%, 98 ± 3% for o-PLS. A similar decrease in classification performance was also obtained for the data without RT alignment (86 ± 6, 80 ± 4% for FuRES and 94 ± 5, 88 ± 3% for o-PLS). Another evaluation was conducted with the alignment applied to each calibration set of data, and then fitting the prediction data to the mean of the aligned calibration set. The results obtained by using the latter alignment are reported in the two lower rows in Table 1. Similar classifications rates corresponding to the scenarios described above were obtained. Because the decreases in prediction accuracy that arose from the baseline correction algorithm were not statistically significant, this preprocessing method was maintained to remove background components from the data.
o-PLS was used as the positively biased control method in this work. In a partial least-squares model, the number of latent variable for prediction is fixed. However, in an o-PLS model, the number of latent variables is selected that yields the best prediction results with respect to minimizing the root-mean-square prediction error.31,35,37 Because the classes are defined this measure is positively biased and presents the best case for prediction. It is a suitable reference method for comparing other algorithms. If FuRES can achieve similar classification rates as o-PLS then it is an effective classifier.
After data pretreatment, the classification rates from FuRES and o-PLS as listed in the first two rows in Table 1 were both 98 ± 3%, and a matched sample comparison of the results achieved a t-test of −0.56 with a p-value of 59%, indicating no significant difference between these two methods at a 95% confidence level. The samples in each category were very diverse with respect to suppliers, sublocations, shape, and size, which could result in variation among samples from the same class so that the classes are less precisely defined. It is reasonable to expect that if the samples were from a smaller area in each country and with the same age and were similar in size, the classification would be less challenging than the current one. However, even with the above-mentioned difficulties, the classification was successful as exhibited by the high classification rate of 98 ± 3%.
6. FuRES Model
The FuRES classification tree obtained from the entire data set after background correction and RT alignment is given in Figure 4. In a FuRES classification tree, the classification entropy is denoted as H. The numbers refer to the rule used for classification at each branch of the tree. Nc is the number of training objects at each leaf. The FuRES classification tree demonstrates perfect classification of P. quinquefolius L samples grown in China and the United States. Only one rule was needed to classify two classes.
Figure 4.

FuRES classification tree with the two-way 3-dimensional classification rule illustrated for the two classes of ginseng samples: (upper left) peaks with positive weight coefficients; (upper right) peaks with negative weight coefficients. The color bar indicates the weight coefficient values of peaks in the two-way rule.
The rules obtained from FuRES are linear discriminants so they are amenable to interpretation and resemble the two-way data objects. In Figure 4, a two-way surface of the FuRES discriminant that comprises positive and negative peaks is displayed. The ten largest magnitude peaks are listed in descending sequence from the two-way rule in Table 2.
Table 2.
Ten Largest Magnitude Peaks in the Two-Way FuRES Rule
| order | weight coefficient | RT (min) | m/z | mean/Stda |
|---|---|---|---|---|
| no. 1 | −0.220 | 14.9 | 1031 | −11.4 |
| no. 2 | 0.085 | 12.6 | 574.3 | 4.7 |
| no. 3 | −0.079 | 7.9 | 595.3 | −6.1 |
| no. 4 | 0.060 | 10.8 | 955.5 | 3.2 |
| no. 5 | 0.051 | 20.2 | 553.3 | 4.2 |
| no. 6 | 0.048 | 20.2 | 1077.8 | 3.8 |
| no. 7 | 0.038 | 22.6 | 574.3 | 6.7 |
| no. 8 | −0.037 | 13.8 | 1031 | −8.8 |
| no. 9 | −0.032 | 13.0 | 1163.3 | −7.0 |
| no. 10 | 0.028 | 10.9 | 926.1 | 3.2 |
Note: Std is the standard deviation of a peak among 30 BLP models. Mean is the average of the peak weight coefficient obtained from the 30 BLP models.
Because the MRE program was not working successfully in the tandem mode, collision induced dissociation (CID) profiles of the major ginsenosides in the two-way rule could not be obtained. Fortunately, most ginsenosides found in P. quinquefolius L have been identified in the literature. Therefore, the ions listed in Table 2 can be putatively assigned according to previous findings. The identification of an ion with m/z of 1031 is likely to be ginsenoside malonyl-Rd because this ginsenoside occurs in P. quinquefolius L with a molar mass of 1032 u. The identification of an ion with m/z of 955.5 could be ginsenoside Ro (or Ro isomer).23 The ion with m/z of 1077.8 is putatively ginsenoside Rc although ginsenosides Rb2 and Rb3 have the same molecular mass. Ginsenoside Rc has high polarity and will elute earlier than the other isobaric ginsenosides Rb2 and Rb3 while the latter two sometimes are very hard to separate because of their similar polarities.
In the raw extracted ion current chromatogram (not shown), two peaks have m/z of 1077.8 and the first one at RT of 20.2 min played a major role in the two-way rule. The second peak was very wide and it might be ginsenosides Rb2 and Rb3 with poor resolution. The ion with m/z of 1163.3 could be mRb2 or mRc. Two peaks with m/z of 1163.3 were displayed in the extracted ion current chromatogram at RT 13.0 min and RT 13.8 min. The peak that played a role in the two-way rule was at RT 13 min. Therefore, it was very likely to be ginsenoside mRc because of its higher polarity than mRb2.
Doubly charged species of the decarboxylated derivatives of ginsenoside malonyl-Rb1 and its isomer (molar mass: 1194.6 u) gave an ion with m/z of 574.3.23 When the negatively charged malonyl-Rb1 or its isomer loses CO2, an ion with m/z of 1149.6 is produced.45 The acetyl-ginsenoside with ion of m/z of 1149.6 is not readily found in white ginseng (naturally dried without heat treatment). The doubly charged species of this acetylginsenoside has m/z of 574.3.
The extracted ion chromatogram in the Supporting Information displays prominent peaks in the multivariate FuRES rule. The second and the seventh largest peaks in the rule were m/z 574.3 at RT 12.6 and 22.6 min. Similarly, the ion with m/z of 553.8 could be the doubly charged species of ginsenoside Rb1 with molecular mass of 1108.6 because ion m/z 553.8 appeared together with ion with m/z of 1107.6. (Data is not given.)10,23 Ions with m/z of 926.1 and 595.3 could not be assigned.
Although some peaks in the two-way rule have large mean weight coefficients, they are not reported because their mean/Std values (signal-to-noise ratios (SNRs)) are less than 3, which means these discriminant peaks are not as significant as those with larger SNRs. The peaks in the two-way FuRES rule reported in Table 2 have both large absolute mean weight coefficients and SNR values greater than 3.
These ten peaks in Table 2 were used to evaluate the classification accuracy while all parameters and processing remained the same as those leading to the results in the first two rows in Table 1 (with baseline correction and RT alignment before feature selection). The 10 bootstrapped 3 Latin-partition evaluation yielded accuracies of 99 ± 1% by using the FuRES classifier and 99.6 ± 0.9% by using o-PLS with a t-test value of 0.43 and a p-value of 68%, indicating no significant difference between these two methods. The PDR value after baseline correction and RT alignment was improved from 0.47 ± 0.03 to 0.94 ± 0.05. These results are comparable to those obtained with the complete two-way data sets.
When these ten key peaks identified in the FuRES rule were removed from the data, the prediction accuracy decreased to 81 ± 5% for FuRES and 89 ± 5% for o-PLS. The PDR values also decreased to 0.499 ± 0.009 after RT alignment, which was significantly less than that obtained from the complete data set. The first ten largest-magnitude peaks were larger than many other peaks in the two-way rule; however, these other peaks also appear in the rule because they convey discriminating information from the information rich LC–MS measurements. When the first ten largest-magnitude peaks were eliminated from the data set, other discriminating ions remained in the data that could be exploited by FuRES for effective classification.
When the two most prominent peaks (14.9 min, m/z 1031 and 12.6 min, m/z 574.3) in Table 2 were used for feature selection, the PDR value was 0.92 ± 0.01 and the prediction accuracies were 96 ± 3% and 97 ± 2%, respectively, for FuRES and o-PLS classification. The matched sample t-test for FuRES classifier and the o-PLS classifier gave a value of −0.61 and a p-value of 55%, showing no significant difference between these two methods. When the third most prominent peak was added to the evaluation, the classification rate did not exhibit a statistical improvement.
The PCA score plot using these two selected features for the data is given in the Supporting Information. The first and second PCs span 69% of the variation of the data set.
The visual observation of mass spectra is consistent with the above result. From enlarged mass spectra displayed in the Supporting Information of the ginseng samples grown in the United States and China, it can be seen obviously the mass spectral values of these two key peaks played an important roles in the two-way classification. For example, the peak ratios of m/z 574.3 to peak m/z 1031 are significantly different between the two classes. The intensity ratio of peak m/z 574.3 to peak m/z 1031 grown in China is about 2.8:1 for the 12 samples and that in the samples grown in the United States is about 1.1:1 for the 12 samples. Because m/z 574.3 was likely the doubly charged species of the decarboxylated derivative of ginsenoside malonyl-Rb1 or its isomer, the total amount of ions with m/z 574.3, m/z of 1149.6, and m/z 1193.6 needs to be considered when the detection condition is different from the current one. This feature has the potential to be used for the visual preliminary differentiation of these two classes of samples.
CONCLUSIONS
P. quinquefolius L samples grown in the United States and China were classified by combining the HPLC–MS and chemometric processing. The FuRES classifier gave a 98 ± 3% classification rate which was statistically equivalent to that obtained from the positively biased o-PLS reference method.
Some data pretreatment techniques such as baseline correction and RT alignment are necessary when baseline shift and/or RT shift occur during data acquisition. Both baseline correction and RT alignment were applied before the data sets were subjected to classification. The classification rate by using the FuRES classifier was not improved by baseline correction without RT alignment; when both baseline correction and RT alignment were applied, the classification rate for the FuRES classifier was improved by 18% compared to using only baseline correction as a preprocessing method.
One FuRES rule was constructed for the two classes. Prediction accuracies were obtained by using the two largest peaks and ten largest peaks in the rule to select features from the data to assess the informing power of these peaks. In addition, removal of the ten discriminatory peaks from the data detrimentally affected the classification performance.
It is interesting to note that the ratio of intensities of ions at m/z of 574.3 and 1031, which correspond to the first two prominent peaks of the two-way FuRES rule, was significantly different between the two classes. The ratio of intensities of ions at m/z of 574.3 and 1031 was 1.1:1 for the samples grown in the United States and that for the samples grown in China was 2.8:1. By selecting only two peaks from the two-way rule data these two ions, a prediction rate of 96.3 ± 0.9% with the FuRES classifier was obtained, which is comparable to that of 98 ± 3% obtained by using the complete data set.
It is reasonable to propose that the two-way HPLC–MS data of P. quinquefolius L grown in different geographical locations can be assessed using this ratio; when the ionization conditions change, ions with m/z of 1149.6 and m/z 1193.6 may need to be taken into consideration because m/z 1193.6 is the precursor of m/z 1149.6 and 574.3 is the doubly charged species related to m/z 1149.6. This work has the potential to be used as an authentication method for P. quinquefolius L samples grown in different geographical locations. The future work related to this project will focus on the classification of P. quinquefolius L samples and Panax ginseng samples with different ages and from different cultivation sublocations with the proposed technique.
Supplementary Material
ACKNOWLEDGMENTS
Weiying Lu, Mengliang Zhang, Zhanfeng Xu, and Zhengfang Wang are thanked for their help and suggestions. Food Composition Laboratory, Beltsville Human Nutrition Research Center, Agricultural Research Service, U.S. Department of Agriculture, is thanked for providing the ginseng samples. G.P.J. acknowledges financial support from NSF grant CHE 0745590.
Footnotes
ASSOCIATED CONTENT Supporting Information More information on theory, experimental details, and results as well as supporting Table 1 and Figures 1–5. This material is available free of charge via the Internet at http://pubs.acs.org.
Notes The authors declare no competing financial interest.
REFERENCES
- (1).Attele AS, Wu JA, Yuan CS. Biochem. Pharmacol. 1999;58:1685–1693. doi: 10.1016/s0006-2952(99)00212-9. [DOI] [PubMed] [Google Scholar]
- (2).Jia L, Zhao YQ. Curr. Med. Chem. 2009;16:2475–2484. doi: 10.2174/092986709788682146. [DOI] [PMC free article] [PubMed] [Google Scholar]
- (3).Chen P, Harrington PB. J. AOAC Int. 2011;94:90–99. [PMC free article] [PubMed] [Google Scholar]
- (4).Chen P, Luthria D, Harrington PB, Harnly JM. J. AOAC Int. 2011;94:1411–1421. doi: 10.5740/jaoacint.10-291. [DOI] [PMC free article] [PubMed] [Google Scholar]
- (5).Scholey A, Ossoukhova A, Owen L, Ibarra A, Pipingas A, He K, Roller M, Stough C. Psychopharmacology. 2010;212:345–356. doi: 10.1007/s00213-010-1964-y. [DOI] [PMC free article] [PubMed] [Google Scholar]
- (6).Barton DL, Soori GS, Bauer BA, Sloan JA, Johnson PA, Figueras C, Duane S, Mattar B, Liu HS, Atherton PJ, Christensen B, Loprinzi CL. Support. Care Cancer. 2010;18:179–187. doi: 10.1007/s00520-009-0642-2. [DOI] [PMC free article] [PubMed] [Google Scholar]
- (7).Yuan CS, Wang CZ, Wicks SM, Qi LW. J. Ginseng Res. 2010;34:160–167. doi: 10.5142/jgr.2010.34.3.160. [DOI] [PMC free article] [PubMed] [Google Scholar]
- (8).Wang AB, Wang CZ, Wu JA, Osinski J, Yuan CS. Phytochem. Anal. 2005;16:272–277. doi: 10.1002/pca.838. [DOI] [PubMed] [Google Scholar]
- (9).Li TSC, Mazza G, Cottrell AC, Gao L. J. Agric. Food Chem. 1996;44:717–720. [Google Scholar]
- (10).Sun JH, Chen P. Anal. Bioanal. Chem. 2011;399:1877–1889. doi: 10.1007/s00216-010-4586-7. [DOI] [PubMed] [Google Scholar]
- (11).Kim OT, Bang KH, In DS, Lee JW, Kim YC, Shin YS, Hyun DY, Lee SS, Cha SW, Seong NS. Plant Biotechnol. Rep. 2007;1:163–167. [Google Scholar]
- (12).Chan TWD, But PPH, Cheng SW, Kwok IMY, Lau FW, Xu HX. Anal. Chem. 2000;72:1281–1287. doi: 10.1021/ac990819z. [DOI] [PubMed] [Google Scholar]
- (13).Leung KSY, Chan K, Bensoussan A, Munroe MJ. Phytochem. Anal. 2007;18:146–150. doi: 10.1002/pca.962. [DOI] [PubMed] [Google Scholar]
- (14).Woo YA, Kim HJ, Chung H. Analyst. 1999;124:1223–1226. [Google Scholar]
- (15).Yap KYL, Chan SY, Lim CS. J. Biomed. Sci. 2007;14:265–273. doi: 10.1007/s11373-006-9133-3. [DOI] [PubMed] [Google Scholar]
- (16).Lu GH, Zhou Q, Sun SQ, Leung KSY, Zhang H, Zhao ZZ. J. Mol. Struct. 2008;883:91–98. [Google Scholar]
- (17).Edwards HGM, Munshi T, Page K. Anal. Bioanal. Chem. 2007;389:2203–2215. doi: 10.1007/s00216-007-1605-4. [DOI] [PubMed] [Google Scholar]
- (18).Kang J, Lee S, Kang S, Kwon HN, Park JH, Kwon SW, Park S. Arch. Pharm. Res. 2008;31:330–336. doi: 10.1007/s12272-001-1160-2. [DOI] [PubMed] [Google Scholar]
- (19).Lee EJ, Shaykhutdinov R, Weljie AM, Vogel HJ, Facchini PJ, Park SU, Kim YK, Yang TJ. J. Agric. Food Chem. 2009;57:7513–7522. doi: 10.1021/jf901675y. [DOI] [PubMed] [Google Scholar]
- (20).Li WK, Gu CG, Zhang HJ, Awang DVC, Fitzloff JF, Fong HHS, van Breemen RB. Anal. Chem. 2000;72:5417–5422. doi: 10.1021/ac000650l. [DOI] [PubMed] [Google Scholar]
- (21).Sherma JJ. AOAC Int. 2003;86:873–881. [PubMed] [Google Scholar]
- (22).Ligor T, Ludwiczuk A, Wolski T, Buszewski B. Anal. Bioanal. Chem. 2005;383:1098–1105. doi: 10.1007/s00216-005-0120-8. [DOI] [PubMed] [Google Scholar]
- (23).Ma X, Xiao HB, Liang XM. Chromatographia. 2006;64:31–36. [Google Scholar]
- (24).Gray MJ, Chang D, Zhang Y, Liu JX, Bensoussan A. Biomed. Chromatogr. 2010;24:91–103. doi: 10.1002/bmc.1287. [DOI] [PubMed] [Google Scholar]
- (25).Liang YZ, Xie PS, Chau F. J. Sep. Sci. 2010;33:410–421. doi: 10.1002/jssc.200900653. [DOI] [PubMed] [Google Scholar]
- (26).Wang XM, Sakuma T, Asafu-Adjaye E, Shiu GK. Anal. Chem. 1999;71:1579–1584. doi: 10.1021/ac980890p. [DOI] [PubMed] [Google Scholar]
- (27).Gafner S, Bergeron C, McCollom MM, Cooper LM, McPhail KL, Gerwick WH, Angerhofer CK. J. Agric. Food Chem. 2004;52:1546–1550. doi: 10.1021/jf0307503. [DOI] [PubMed] [Google Scholar]
- (28).Ma XQ, Xiao HB, Liang XM. Chin. J. Anal. Chem. 2006;34:1273–1277. [Google Scholar]
- (29).Liang YZ, Xie PS, Chan KJ. Chromatogr. B–Anal. Technol. Biomed. Life Sci. 2004;812:53–70. doi: 10.1016/j.jchromb.2004.08.041. [DOI] [PubMed] [Google Scholar]
- (30).Lu Y, Harrington PB. Anal. Bioanal. Chem. 2010;397:2959–2966. doi: 10.1007/s00216-010-3840-3. [DOI] [PubMed] [Google Scholar]
- (31).Sun X, Zimmermann CM, Jackson GP, Bunker CE, Harrington PB. Talanta. 2011;83:1260–1268. doi: 10.1016/j.talanta.2010.05.063. [DOI] [PubMed] [Google Scholar]
- (32).Harrington PB. J. Chemom. 1991;5:467–486. [Google Scholar]
- (33).Bota GM, Harrington PB. Talanta. 2006;68:629–635. doi: 10.1016/j.talanta.2005.05.001. [DOI] [PubMed] [Google Scholar]
- (34).Harrington PD, Vieira NE, Chen P, Espinoza J, Nien JK, Romero R, Yergey AL. Chemom. Intell. Lab. Syst. 2006;82:283–293. [Google Scholar]
- (35).Lu Y, Harrington PB. Anal. Chem. 2007;79:6752–6759. doi: 10.1021/ac0707028. [DOI] [PubMed] [Google Scholar]
- (36).Rearden P, Harrington PB, Karnes JJ, Bunker CE. Anal. Chem. 2007;79:1485–1491. doi: 10.1021/ac060527f. [DOI] [PubMed] [Google Scholar]
- (37).Harrington PD, Kister J, Artaud J, Dupuy N. Anal. Chem. 2009;81:7160–7169. doi: 10.1021/ac900538n. [DOI] [PubMed] [Google Scholar]
- (38).Smith RG, Caswell D, Carriere A, Zielke B. Can. J. Botany–Rev. Can. Botanique. 1996;74:1616–1620. [Google Scholar]
- (39).Qu CL, Bai YP, Jin XQ, Wang YT, Zhang K, You JY, Zhang HQ. Food Chem. 2009;115:340–346. [Google Scholar]
- (40).Jackson GP, Laskay UA, Collin OL, Hylanda JJ, Nichol B, Pasilis SP, Duckworth DC. J. Am. Soc. Mass Spectrom. 2007;18:2017–2025. doi: 10.1016/j.jasms.2007.08.014. [DOI] [PubMed] [Google Scholar]
- (41).Xu Z, Sun X, Harrington P. d. B. Anal. Chem. 2011;83:7464–7471. doi: 10.1021/ac2016745. [DOI] [PubMed] [Google Scholar]
- (42).Harrington PB. Trends Anal. Chem. 2006;25:1112–1124. [Google Scholar]
- (43).Chen P, Lu Y, Harrington PB. Anal. Chem. 2008;80:7218–7225. doi: 10.1021/ac8004549. [DOI] [PubMed] [Google Scholar]
- (44).Lu Y, Chen P, Harrington PB. Anal. Bioanal. Chem. 2009;394:2061–2067. doi: 10.1007/s00216-009-2786-9. [DOI] [PubMed] [Google Scholar]
- (45).Simmonds MSJ, Kite GC, Howes MJR, Leon CJ. Rapid Commun. Mass Spectrom. 2003;17:238–244. doi: 10.1002/rcm.899. [DOI] [PubMed] [Google Scholar]
Associated Data
This section collects any data citations, data availability statements, or supplementary materials included in this article.