

Abstract
Alzheimer disease (AD) is the most common type of dementia and will become increasingly prevalent with the growing elderly population. Despite established clinical diagnostic tools, the workup for dementia among primary caregivers can be complicated and specialist referral may not be readily available. A host of AD diagnostic tests has been proposed to aid in diagnosis, including functional neuroimaging such as positron emission tomography (PET). We review the basis for FDG-PET and PiB-PET, as well as available operating statistics. From this we advise scenarios for use of PET in primary settings and referral centers, approach to its interpretation, and outline a clinical prediction model based on findings.
I. Background
Dementia is a common disorder among the elderly, becomes more prevalent with advancing age, is typically medically refractory, reduces life expectancy, and diminishes quality of life for patients and their caregivers. Worldwide 600 million people are over the age of 60 and that number is expected to double by 2025 (UN, 2003). Of those over age 60, approximately 26 million people have dementia of any type (Wimo et al., 2007), and as the population ages, this is projected increase to 80 million by the year 2040 (ADI, 2006). The costs of care are staggering, with a current annual worldwide health cost estimated at $300 billion (Wimo et al., 2007).
Despite the high prevalence of dementia among the elderly, the diagnostic workup can be complicated, time consuming, and difficult to interpret, particularly in the primary care setting. In this manuscript, we will review the biologic basis of positron emission technology (PET) in the diagnostic workup of Alzheimer disease (AD) and its symptomatic prodrome, mild cognitive impairment (MCI), as well as outline current recommendations for use PET, and identify its main limitations to improve appropriate selection of patients.
A. Neurobiology of Alzheimer Disease
Abnormal accumulation of beta-amyloid (Aβ) peptide is widely believed to be the underlying mechanism of pathologic and clinical changes seen in AD (Cummings, 2004). Changes typically begin in the transentorhinal and entorhinal cortex as well as the hippocampus (Delacourte et al., 1999), and thus earliest impairments occur with episodic memory deficits. Despite extensive neuropathologic changes, some patients may remain asymptomatic in a prodromal state of AD (Dubois et al., 2007). Alternatively, some patients develop cognitive complaints and have objective cognitive impairment but no functional decline in level of activities of daily living, and these are classified as MCI (Petersen et al., 2001). As disease progresses, other brain structures become involved, initially temporal cortex and later parietal and frontal association cortices, and finally primary motor and sensory cortices and the neocortex (Delacourte et al., 1999). Symptomatically, patients progress from episodic memory loss to additional, progressive deficits in visuospatial and semantic abilities, mood and behavioral disorders, and an eventual vegetative state.
B. Epidemiology of Alzheimer Disease
Alzheimer disease (AD) is the most common type of dementia, representing 60–70% of all patients with dementia. The prevalence increases with age from approximately 3–5% for those under 75, 15–18% for those age 75–84 years, and 45% for those older than 85 years (Alzheimer's Association, 2008; Gurland et al., 1999; Hebert et al., 2003; Mayeux, 2003b). In the US alone, an estimated 5.2 million have AD in 2008 and this may increase to 13.2 million by 2050 (Alzheimer's Association, 2008). Sporadic AD represents 98% of all AD cases and is likely due to a complex interaction of environmental, vascular, and genetic risk factors (Mayeux, 2003a; Tang et al., 1998).
The epidemiologic data for patients at risk for late onset AD are equally daunting. In the US alone, 25 million persons are over the age of 65 (18 million aged 65–74 years, 12 million aged 75–84 years, and 4 million aged 85 years and over) (He et al., 2005). Before developing AD, many patients may transition through amnestic MCI (Petersen et al., 2001), or memory complaints with commensurate objective neuropsychological test deficits, but without appreciable impact in general cognition or daily independent function.
MCI portends to a significantly increased annual risk of conversion to AD compared to others in their age group (Manly et al., 2008; Petersen et al., 2001). In a multiethnic urban American population, amnestic MCI (including single or multiple domain impairment) is prevalent in 3.8% of nondemented elderly aged 65ȓ75 and in 6.3% of those over 75 years of age (Manly et al., 2005). Overall, most studies suggest that MCI patients have an annual conversion rate (i.e., progression) to AD of approximately 10–15% per year (Morris et al., 2001; Petersen et al., 1999). Recently, age-stratified data from our center have suggested that of normal elderly individuals, the annual conversion rate from normal cognition to amnestic MCI is 1.1% of those aged 65–69 years, 2.1% aged 70–74, 2.2% aged 75–79, and 3.4% aged 80 years and above. Moreover, among those with amnestic MCI, the annual conversion rate to AD is 3.2% of those aged 65–69, 4.5% aged 70–74, 9.7% aged 75–79, and 11.1% aged 80 years and above (Manly et al., 2008).
C. [18F]2-Fluoro-2-Deoxy-d-Glucose
Positron emission tomography (PET) enables imaging of biological activity, and thus can identify abnormal biological activity in a host of diseases. Regional differences in brain glucose metabolism using PET have been explored in dementia, and [18F]2-fluoro-2-deoxy-d-glucose (FDG-PET) has become the most widely investigated radioligand since the first descriptions of cerebral metabolism in dementia over two decades ago (Benson et al., 1981; Farkas et al., 1982; Friedland et al., 1983; Phelps et al., 1982). Glucose hypometabolism identified in FDG-PET is thought to represent two findings: (1) local decreases in synaptic activity or synaptic dysfunction in neurons affected by Alzheimer type pathological changes and (2) decreased synaptic activity in regions receiving projections from these primary, diseased neurons (Friedland et al., 1985; Hoffman et al., 2000; Matsuda, 2007; McGeer et al., 1986a,b, 1990a,b; Mielke et al., 1996). Thus, abnormalities in regional cerebral metabolism are thought to reflect the pattern of neuropathologic development of AD with early prominent AD changes in the medial temporal cortex and its projections to cingulate and parieto-temporal association cortices (Brun and Englund, 1986); although, all of these structures may become pathologically involved with disease progression (Braak and Braak, 1991).
Similarly, patients with MCI, with many in the earliest stages of AD change, may only have glucose hypometabolism in the medial temporal cortex (de Leon et al., 2001; Nestor et al., 2003). MCI patients with additional glucose hypometabolism in the parietal association cortex may be at greater risk for subsequent conversion to AD (Chetelat et al., 2003; Mosconi et al., 2004).
Despite the relatively lengthy history of FDG-PET in dementia, its clinical utility was not fully appreciated until relatively recently. The last American Academy of Neurology Practice Parameter for the diagnosis of dementia was released in 2001, at a time prior to any reports of PET operating statistics from large studies. In that report, PET was thought to “have promise for use as an adjunct to clinical diagnosis,” but further studies were required “to establish the value that it brings to diagnosis over and above a competent clinical diagnosis.” (Knopman et al., 2001). Since then, several studies have been reported including one later that year, which included 284 patients undergoing dementia workup, with 138 having neuropathological diagnosis (Silverman et al., 2001). The authors used a typical AD pattern of parietal and temporal hypometabolism, with or without frontal involvement, with a sensitivity of 94% (91/97; 95% CI, 89–99%) and a specificity of 73% (30/41; 95% CI, 60–87%) relative to neuropathologic diagnosis (Silverman et al., 2001); other studies have found similar values of specificity and sensitivity of PET for AD, depending on comparisons with clinical or pathologic definitions of disease (Hoffman et al., 2000; Patwardhan et al., 2004).
In an attempt to clarify the sensitivity and specificity of PET, one meta-analysis of articles published through 2003 found significant faults in the generalizability of these studies overall (Patwardhan et al., 2004). Namely, the authors noted that control patients may have dissimilar medical comorbidities, and that most of the studies were performed in specialty or tertiary referral centers, and may operate quite differently when used in primary care settings. Despite these limitations their best estimate suggested the summary sensitivity of PET was 86% (95% CI: 76–93%) and summary specificity was 86% (95% CI: 72–93%) (Patwardhan et al., 2004), and subsequent individual studies have found similar results (Jagust et al., 2007). Furthermore, in each of these studies, we cannot know whether individuals with an AD PET pattern, but without either clinical or pathologic correlate, would have eventually developed clinical AD. Thus, these patients may underestimate the specificity of FDG-PET (fewer false positives).
D. Pittsburgh Compound B-PET
Recent approaches to PET imaging in dementia have attempted to obviate the examination of glucose metabolism and its inherent limitations and focus on radioligands which bind with amyloid in the brain. One of the most promising and well studied of these ligands used amyloid binding dye thioflavin-T derivative [N-methyl-11C]-2-(4′-methylaminophenyl)-6-hydroxybenzothiazole, better known as Pittsburgh Compound B (PiB)-PET, which binds to amyloid plaques and amyloid fibrils, but not neurfibrillary tangles. The first report of PiB-PET in humans suggested PiB affinity is generally inversely correlated with glucose metabolism on FDG-PET (Klunk, 2004) (e.g., regions with greater amyloid burden may be identified in regions with relative preservation of glucose metabolism); the highest degree of amyloid binding was associated with prefrontal cortex, and to a lesser degree in parietal, occipital, and temporal cortex (Klunk et al., 2004; Mintun et al., 2006). Subsequent studies have also suggested that relatively normal prefrontal glucose metabolism on FDG-PET despite high prefrontal amyloid binding on PiB-PET has led some to hypothesize additional mechanisms than just amyloid underlying neuronal dysfunction in AD (Edison et al., 2007).
PiB binding has been demonstrated to be highly prevalent among larger studies of AD patients, and to a lesser degree but with a similar pattern among MCI patients (Kemppainen et al., 2007). PiB binding may be present in as high as 22% of elderly individuals with healthy aging, and cortical PiB is significantly associated with episodic memory test performance among MCI and normal aged patients (Pike et al., 2007), and facial and word recognition in all subjects (Edison et al., 2007). One study of cognitively normal elderly and MCI subjects found no within-group relation between learning and memory testing and PiB binding (Jack et al., 2008). To date, the relatively limited number of studies preclude definitive prediction of progression from MCI or a normal state to clinical AD based on PiB-PET, but MCI patients with an AD PiB-PET pattern may be more likely to progress to AD based on one study with relatively brief follow-up (Forsberg et al., 2008).
Data regarding the sensitivity and specificity of PiB-PET in the diagnosis of AD is somewhat limited. One study found increased PiB binding in 89% of patients with clinically probable AD (Edison et al., 2007); another found 100% sensitivity, with specificity dependent upon the age of the patient, ranging from 73 to 96% (Ng et al., 2007). As with FDG-PET, the cause for the relatively low specificity (high false positives for AD) in some subjects is unclear, but could be related to several reasons. First, presymptomatic individuals could lead to false positive findings; autopsied brains of cognitively normal elderly can have pathologic AD changes in 25–67% of subjects (Crystal et al., 1988; Morris et al., 1996; Mortimer et al., 2003; MRC-CFAS, 2007). Second, PiB amyloid binding is found in other cerebral amyloidoses including cerebral amyloid angiopathy (CAA) (Lockhart et al., 2007). Although the data are limited, the CAA pattern of PiBPET signal may be distinguishable from AD; CAA may have a greater degree of occipital amyloid identified on PiB-PET than AD patients (Johnson et al., 2007).
II. Application of PET to Primary and Specialty Care Settings
Given the data from these studies outlined above, it is worth considering the application and utility of PET in clinical practice. Prior to outlining the approach to its use, the current typical sequence leading to the workup and diagnosis of dementia bears review, to contextualize the potential role of PET within the diagnostic workup.
A. Diagnostic Workup of Dementia in Primary Care
For the workup of dementia patients, current recommendations for primary care physicians are to provide cognitive screens to only those with reported or suspected cognitive decline, or in the oldest old (Brodaty et al., 1998; US Preventive Services Task Force, 2003). Without disease modifying treatment, the current ratio of benefit to harm of screening for dementia is unclear, and thus not recommended unless dementia is suspected (US Preventive Services Task Force, 2003). These practices may delay recognition relative to community screening programs (Barker et al., 2005), but expanding current screening practices may be impractical for a busy primary care physicians, already conscious of cost concerns (Geldmacher, 2002). When concern for progressive cognitive impairment is raised in the primary care setting, one of several brief cognitive screening tests for dementia is often used. The best-studied cognitive screening tool is the Folstein Mini-Mental Status Examination (MMSE) (Folstein et al., 1975; US Preventive Services Task Force, 2003), but scoring and interpretation may be somewhat dependent on education and age. If cognitive impairment is identified, other non-cognitive screening tests are recommend for the purposes of excluding uncommon causes non-degenerative cognitive decline (Knopman et al., 2001). These tests include MRI (to rule out space occupying lesions, subclinical cerebral infarcts, and other conditions) and laboratory evaluations of thyroid function, vitamin B12 level, and syphilis serology. These tests have few limitations, are reproducible, and are relatively simple to perform and interpret by nonspecialists.
Depending on individual practice, some primary care physicians may arrest the workup at this point and begin treatment. Others may refer to a specialist after screening, or even sooner—at the time of suspected cognitive impairment but prior to screening laboratory evaluation. The current structure of diagnostic workup is likely impractical for every patient with probable AD to be seen by a specialist. Although data are limited, US community primary care physicians refer 44% of their patients to specialists for diagnosis or confirmation (Fortinsky et al., 1995). In comparison, more than 80% of community primary care physicians in Germany and academic primary care physicians in Canada make specialist referrals, most often neurologists or physicians specializing in both psychiatry and neurology (Pimlott et al., 2006; Riedel-Heller et al., 1999). Potential dementia specialists include neurologists (on average, 4.5 neurologists serve 100,000 US population) (World Health Organization, 2005), gerontologists (2.4 per 100,000), and geriatric psychiatrists (0.5 per 100,000) (Wimo et al., 2007); behavioral neurologists and neuropsychiatrists comprise a small minority of general psychiatrists and neurologists. Thus, any increase in referrals to specialists would likely overwhelm the current system.
The statistical rigor and cost-effectiveness of a non-selective community-based screen using most of these diagnostic tools has not been widely reported. It has been argued that FDG-PET can be a cost saving measure for the diagnosis of AD in geriatric populations, in comparison to a conventional workup of clinical evaluation and exclusion of potential mimicking diseases (Silverman et al., 2002). However, this study considered the population of having 51% prevalent disease (Silverman et al., 2002), which would only be applicable to a highly selected, screened population within a primary caregiver's office, or would require an unselected population with all patients over 90 years of age, based on current epidemiologic estimates.
B. Diagnostic Workup of Dementia in Specialty Care Settings
In contrast to screening tests used largely for exclusionary purposes, confirmatory tests used in the diagnostic workup of patients with dementia are typically used as sensitive measures to rule in a diagnosis in a patient with moderate to highly probable disease. These tests include initial clinical evaluation, often by a specialist, with supportive testing, decided on a case by case basis, including neuropsychological testing, cerebrospinal fluid markers, and functional imaging such as FDG-PET. Each of these is costly, time consuming and requires a large amount of manpower to complete (McMahon et al., 2003). As noted elsewhere, the additional diagnostic benefit of these diagnostic tests when done in expert settings is unclear, and these tests may have greater potential diagnostic usefulness when the diagnosis is less certain, as may be the case in primary care settings (Knopman, 2001).
III. Appropriate Use of PET
Before delving into the statistics of available studies regarding PET, the use of sensitivity, specificity, and related statistical tools also bears brief review. From the Table I, Sensitivity = A/(A + C) is the probability of having a positive test result among all those with disease. The complement of sensitivity is the false negative proportion = C/(A + C). Specificity = D/(B + D) is the probability of having a negative test result among those without disease. Similarly, the complement of specificity is the false positive proportion = B/(B + D). Drawn from Table I are terms that are often cited to guide clinicians' use for practical matters, and perhaps incorrectly so: the predictive value terms. The positive predictive value = A/(A + B) is the probability of having the disease given a positive test result. Similarly, the negative predictive value = D/(C + D) is the probability of not having the disease given a negative test result. These predictive values are often applied incorrectly; their usefulness is dependent upon the prevalence of disease within a given population, which may be unknown to the clinician. Furthermore, if data are derived from case-control studies, the predictive value tools cannot be used unless an equal sampling fraction of controls is established, and this is often difficult.
TABLE I.
The 2 × 2 Table
| Disease | No disease | |
|---|---|---|
| Positive test result | A | B |
| Negative test result | C | D |
In place of these predictive value tools, some have suggested using likelihood ratio statistics (Grimes and Schulz, 2005), but these have not become as widely reported, despite their relative ease of using an appropriate table or computer program. The benefit of the likelihood ratios is that they incorporate statistics regarding all disease states and test results, without depending on prevalence. Instead, using Bayesian statistics these ratios allow the user to apply a likelihood ratio to a pretest probability (either according to known disease prevalence or clinical probability based on additional data) to derive a posttest probability. Thus, again from Table I, the Likelihood ratio for disease if test positive = sensitivity/(1-specificity) and the Likelihood ratio for disease if test negative = (1-sensitivity)/specificity. One can also consider the likelihood ratio positive to be the ratio of true positives to false positives, and the likelihood ratio negative as the ratio of false negatives to true negatives. The likelihood ratios in and of themselves have little inherent meaning but become relevant when applying them to individual patients.
Although the likelihood ratio calculations are relatively straightforward, their application can be exacted by using Bayesian statistics, but these can be perceived as cumbersome. An alternative strategy is the use of the likelihood ratio table (Fig. 1), or perhaps more simply by remembering a few important numbers (Grimes and Schulz, 2005). Here we present all three methods of practical application of likelihood ratios.
FIG. 1.
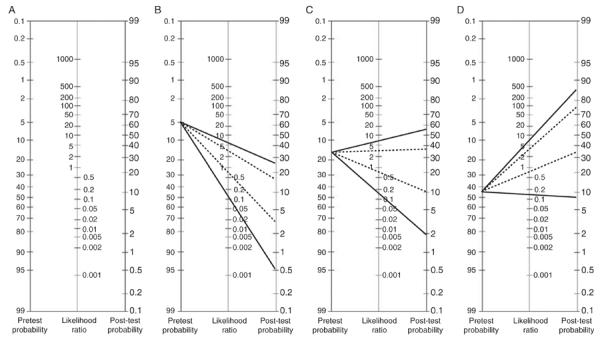
Likelihood ratio tables of FDG-PET in the diagnosis of Alzheimer's disease in several age-stratified scenarios. (A) The likelihood ratio table. (B–D) Likelihood ratio tables for age stratified elderly populations, with pretest probability using only age-based prevalence statistics (Alzheimer's Association, 2008; Gurland et al., 1999; Hebert et al., 2003; Mayeux, 2003b). (B) Age less than 75 years (3–5% AD prevalence). (C) Age 75–84 years (15–18% AD prevalence). (D) Age 85 years and above (45% AD prevalence). Solid line: FDG-PET with sensitivity = 86% and specificity = 86% (Patwardhan et al., 2004); (LR + = 6.1 LR − = 0.16). Dotted line: FDG-PET with sensitivity = 94% and specificity = 73% (Silverman et al., 2001); LR + = 3.5 and LR − = 0.08 Figure (A) reprinted with permission from Elsevier (Grimes and Schulz, 2005).
A. Using Likelihood Ratio Tables
When considering the FDG-PET meta-analysis outlined above (Patwardhan et al., 2004), which identified the composite sensitivity = 86% and specificity = 86% for AD, then the Likelihood ratio positive = 0.86/(1–0.86) the = 6.1 and the Likelihood ratio negative = (1–0.86)/0.86 = 0.16. Once these have been calculated, we then look to Fig. 1A, a typical likelihood ratio table. To use the likelihood ratio table, begin with the pretest probability at the left. Using a straightedge, tracing from the pretest probability through the likelihood ratio will derive the posttest probability. Presumably, a posttest probability will need to be sufficiently high or low to make a clinical decision. Arguably, given that tertiary referral centers may be correct in clinical AD diagnosis approximately 90%, then any posttest probability at or above this would be satisfactory; a suitable threshold value for a low likelihood posttest probability can be determined on a case by case basis but presumably should be less than 5%.
Consider an example of a 50% pretest probability, which could be prevalence of AD in a nonagenarian population (or alternatively a primary physician's clinical suspicion based on interview alone) and thus the pretest probability without further information or diagnostic tests. In this scenario, a positive FDG-PET with likelihood ratio positive = 6.1 would increase the posttest probability to about 90%, while a negative test result with likelihood ratio negative = 0.16 would decrease the posttest probability to 10%. Alternatively, we could consider a single, larger study of PET in AD as outlined above (Silverman et al., 2001) which identified sensitivity = 94% and specificity = 73%, and thus a likelihood ratio positive = 3.5 and likelihood ratio negative = 0.08. Beginning with a 50% pretest probability, our posttest probability with a positive test increases to only about 70% while a negative test decreases the probability to about 5%.
Exploring the likelihood ratio table, one can clearly see that an uncertain pretest probability is the best scenario for use of a diagnostic tool with sufficiently high likelihood ratio positive (ideally over 10) or low likelihood ratio negative (ideally 0.1 or less). Very high or low pretest probabilities will not be appreciably affected, regardless of the likelihood ratio test characteristics (Grimes and Schulz, 2005).
Finally, in the Fig. 1B–D, we have applied the likelihood ratios derived from two studies of FDG-PET statistics (Patwardhan et al., 2004; Silverman et al., 2001) to visually demonstrate the utility of applying likelihood in several different scenarios. In this figure, we derived the pretest probability in each Fig. 1B–D from age-stratified prevalence statistics of AD (Alzheimer's Association, 2008; Gurland et al., 1999; Hebert et al., 2003; Mayeux et al., 2003b) in an effort to demonstrate the utility of FDG-PET without additional screening or further workup. Clearly, the degree of certainty in diagnosis does not appreciably improve from this single test until applied to those older than 85 years of age.
B. Using a Likelihood Ratio “Mnemonic”
Should a likelihood ratio table not be immediately available, and if one chooses not to pursue the potentially difficult calculation steps outlined below, a simpler way has been suggested, requiring the user to remember a few numbers (Grimes and Schulz, 2005). Positive likelihood ratios 2, 5, and 10, approximately increase the posttest probability by 15% increments individually. That is, a likelihood ratio positive of 2 increases the posttest probability by an absolute difference of 15%, 5 by 30%, and 10 by 45%. Conversely, a likelihood ratio negative of 1/2 (0.5) decreases the posttest probability by an absolute difference of 15%, 1/5 (0.2) by 30%, and 1/10 (0.1) by 45%. Using this method considering one of the examples above, a likelihood ratio positive of 6.1 is similar to 5, which would increase a pretest probability of 50% absolutely by 30% to 80%. Similarly, a likelihood ratio negative of 0.08 is similar to 1/10 which would decrease a pretest probability of 50% absolutely by 45%, yielding a posttest probability of 5%, as estimated by the likelihood ratio tables. Overall, comparing this simplified methodology to the results above using the likelihood ratio tables, yields similar but less precise results.
C. Using Bayesian Calculations
Aside from using likelihood ratio tables or the mnemonic as suggested above, one can determine the exact posttest probabilities through a series of calculations, bearing in mind that pretest probabilities may be imprecise and based on clinical judgment. These calculations are
Calculate the pretest odds = pretest probability /(1-pretest probability)
Posttest odds = Pretest odds × likelihood ratio
Posttest probability = Posttest odds/(posttest odds +1)
Returning to the 50% pretest example using sensitivity and specificity for PET derived from the meta-analysis (Patwardhan et al., 2004), for a positive test
Pretest odds = 0.50/(1 − 0.50) = 1 (“1:1 odds”)
Posttest = 1 × 6.1 = 6.1
Posttest probability = 6.1/(6.1 + 1) = 86%
For a negative test
Posttest odds = 1 × 0.16 = 0.16
Posttest probability = 0.16/(1 + 0.16) = 14%
From this example we can see that the likelihood ratio table, menomnic, and calculations yield similar results for a test with 86% sensitivity and specificity, regarding a positive test result (posttest probability using the likelihood ratio table, 90%; mnemonic, 80%; calculation, 86%) and a negative test result (posttest probability using the likelihood ratio table, 10%; mnemonic, 5%; calculation, 14%).
D. Conclusions from Using the Likelihood Ratios for PET and AD
Based on these analyses, FDG-PET should be used only in a highly selected group of patients. Presumably, one would pursue a diagnostic workup until such a time that there is a high degree of certainty of either dementia or normal cognition. At this point FDG-PET should be reserved for patients having either (a) undergone an otherwise exhaustive diagnostic workup with a specialist in cognitive disorders or (b) partial workup with a primary care physician after having identified a cognitive disorder, but both yielding a still-uncertain diagnosis. This approach has been justified in expert centers attempting to distinguish ambiguous clinical cases of AD and frontotemporal dementia; FDG-PET changed the diagnosis in 26% of cases in which the examiner was uncertain or not completely confident in the diagnosis, versus 5% change of clinically certain cases after additional information provided by FDG-PET (Foster et al., 2007). Current reimbursement practices in the United States reflect just such application of FDG-PET, and its use is restricted to consideration of a differential diagnosis of AD versus other neurodegenerative illnesses.
At this point, available data for either FDG-PET or PiB-PET in MCI are limited and preclude accurate derivation of a likelihood ratio test statistics. Neither study is currently indicated for suspected MCI patients, either as a diagnostic tool or as a prediction tool for progression. Should future studies reveal additional data regarding specificity and sensitivity of these imaging modalities, or any other MCI/AD diagnostic tool for that matter, one can apply such data to this formula and recapitulate this argument.
IV. Summary
Despite a relatively lengthy history of FDG-PET in the evaluation of dementia, it should still be used judiciously, and only in patients with a relatively uncertain cognitive diagnosis despite initial workup and evaluation, or if the etiology of their dementia is unclear. The use of FDG-PET as a blind screening tool is not recommended; although, screening in elderly at greatest risk for dementia (age > 90) is worth considering. Newer PET radioligands such as amyloid binding tools (PiB among them) show promise as a future diagnostic tool, but are not commercially available at this time and cannot be recommended for routine use based on available data. FDG-PET, PiB-PET, and other supportive diagnostic tests may have greater roles in diagnosis and monitoring disease should be an era of disease-modifying therapies and prevention strategies for AD develop.
Footnotes
Disclosures: Neither Drs. Noble nor Scarmeas have any relevant conflicts of interest.
References
- ADI [Accessed December 11, 2006];Common questions. 2006 In http://www.alz.co.uk/alzheimers/faq.html,
- Alzheimer's Association Alzheimer's Disease Facts and Figures. 2008 [Google Scholar]
- Barker WW, Luis C, Harwood D, Loewenstein D, Bravo M, Ownby R, Duara R. The effect of a memory screening program on the early diagnosis of Alzheimer disease. Alzheimers Dis. Assoc. Disord. 2005;19(1):1–7. doi: 10.1097/01.wad.0000155380.63231.68. [DOI] [PubMed] [Google Scholar]
- Benson DF, Kuhl DE, Phelps ME, Cummings JL, Tsai SY. Positron emission computed tomography in the diagnosis of dementia. Trans. Am. Neurol. Assoc. 1981;106:68–71. [PubMed] [Google Scholar]
- Braak H, Braak E. Neuropathological stageing of Alzheimer-related changes. Acta Neuropathol. 1991;82(4):239–259. doi: 10.1007/BF00308809. [DOI] [PubMed] [Google Scholar]
- Brodaty H, Clarke J, Ganguli M, Grek A, Jorm AF, Khachaturian Z, Scherr P. Screening for cognitive impairment in general practice: Toward a consensus. Alzheimers Dis. Assoc. Disord. 1998;12(1):1–13. doi: 10.1097/00002093-199803000-00001. [DOI] [PubMed] [Google Scholar]
- Brun A, Englund E. Brain changes in dementia of Alzheimer's type relevant to new imaging diagnostic methods. Prog. Neuropsychopharmacol. Biol. Psychiatry. 1986;10(3–5):297–308. doi: 10.1016/0278-5846(86)90009-6. [DOI] [PubMed] [Google Scholar]
- Chetelat G, Desgranges B, de la Sayette V, Viader F, Eustache F, Baron JC. Mild cognitive impairment: Can FDG-PET predict who is to rapidly convert to Alzheimer's disease? Neurology. 2003;60(8):1374–1377. doi: 10.1212/01.wnl.0000055847.17752.e6. [DOI] [PubMed] [Google Scholar]
- Crystal H, Dickson D, Fuld P, Masur D, Scott R, Mehler M, Masdeu J, Kawas C, Aronson M, Wolfson L. Clinico-pathologic studies in dementia: Nondemented subjects with pathologically confirmed Alzheimer's disease. Neurology. 1988;38(11):1682–1687. doi: 10.1212/wnl.38.11.1682. [DOI] [PubMed] [Google Scholar]
- Cummings JL. Alzheimer's disease. N. Engl. J. Med. 2004;351(1):56–67. doi: 10.1056/NEJMra040223. [DOI] [PubMed] [Google Scholar]
- Delacourte A, David JP, Sergeant N, Buee L, Wattez A, Vermersch P, Ghozali F, Fallet-Bianco C, Pasquier F, Lebert F, Petit H, Di Menza C. The biochemical pathway of neurofibrillary degeneration in aging and Alzheimer's disease. Neurology. 1999;52(6):1158–1165. doi: 10.1212/wnl.52.6.1158. [DOI] [PubMed] [Google Scholar]
- de Leon MJ, Convit A, Wolf OT, Tarshish CY, DeSanti S, Rusinek H, Tsui W, Kandil E, Scherer AJ, Roche A, Imossi A, Thorn E, et al. Prediction of cognitive decline in normal elderly subjects with 2-[(18)F]fluoro-2-deoxy-d-glucose/poitron-emission tomography (FDG/PET) Proc. Natl. Acad. Sci. USA. 2001;98(19):10966–10971. doi: 10.1073/pnas.191044198. [DOI] [PMC free article] [PubMed] [Google Scholar]
- Dubois B, Feldman HH, Jacova C, Dekosky ST, Barberger-Gateau P, Cummings J, Delacourte A, Galasko D, Gauthier S, Jicha G, Meguro K, O'Brien J, et al. Research criteria for the diagnosis of Alzheimer's disease: Revising the NINCDS-ADRDA criteria. Lancet Neurol. 2007;6(8):734–746. doi: 10.1016/S1474-4422(07)70178-3. [DOI] [PubMed] [Google Scholar]
- Edison P, Archer HA, Hinz R, Hammers A, Pavese N, Tai YF, Hotton G, Cutler D, Fox N, Kennedy A, Rossor M, Brooks DJ. Amyloid, hypometabolism, and cognition in Alzheimer disease: An [11C]PIB and [18F]FDG PET study. Neurology. 2007;68(7):501–508. doi: 10.1212/01.wnl.0000244749.20056.d4. [DOI] [PubMed] [Google Scholar]
- Farkas T, Ferris SH, Wolf AP, De Leon MJ, Christman DR, Reisberg B, Alavi A, Fowler JS, George AE, Reivich M. 18F-2-deoxy-2-fluoro-d-glucose as a tracer in the positron emission tomographic study of senile dementia. Am. J. Psychiatry. 1982;139(3):352–353. doi: 10.1176/ajp.139.3.352. [DOI] [PubMed] [Google Scholar]
- Folstein MF, Folstein SE, McHugh PR. “Mini-mental state”. A practical method for grading the cognitive state of patients for the clinician. J. Psychiatr. Res. 1975;12(3):189–198. doi: 10.1016/0022-3956(75)90026-6. [DOI] [PubMed] [Google Scholar]
- Forsberg A, Engler H, Almkvist O, Blomquist G, Hagman G, Wall A, Ringheim A, Langstrom B, Nordberg A. PET imaging of amyloid deposition in patients with mild cognitive impairment. Neurobiol. Aging. 2008;29:1456–1465. doi: 10.1016/j.neurobiolaging.2007.03.029. [DOI] [PubMed] [Google Scholar]
- Fortinsky RH, Leighton A, Wasson JH. Primary care physicians' diagnostic, management, and referral practices for older persons and families affected by dementia. Res. Aging. 1995;17:124–148. [Google Scholar]
- Foster NL, Heidebrink JL, Clark CM, Jagust WJ, Arnold SE, Barbas NR, DeCarli CS, Turner RS, Koeppe RA, Higdon R, Minoshima S. FDG-PET improves accuracy in distinguishing frontotemporal dementia and Alzheimer's disease. Brain. 2007;130(Pt 10):2616–2635. doi: 10.1093/brain/awm177. [DOI] [PubMed] [Google Scholar]
- Friedland RP, Brun A, Budinger TF. Pathological and positron emission tomographic correlations in Alzheimer's disease. Lancet. 1985;1(8422):228. doi: 10.1016/s0140-6736(85)92074-4. [DOI] [PubMed] [Google Scholar]
- Friedland RP, Budinger TF, Ganz E, Yano Y, Mathis CA, Koss B, Ober BA, Huesman RH, Derenzo SE. Regional cerebral metabolic alterations in dementia of the Alzheimer type: Positron emission tomography with [18F]fluorodeoxyglucose. J. Comput. Assist. Tomogr. 1983;7(4):590–598. doi: 10.1097/00004728-198308000-00003. [DOI] [PubMed] [Google Scholar]
- Geldmacher DS. Cost-effective recognition and diagnosis of dementia. Semin. Neurol. 2002;22(1):63–70. doi: 10.1055/s-2002-33049. [DOI] [PubMed] [Google Scholar]
- Grimes DA, Schulz KF. Refining clinical diagnosis with likelihood ratios. Lancet. 2005;365(9469):1500–1505. doi: 10.1016/S0140-6736(05)66422-7. [DOI] [PubMed] [Google Scholar]
- Gurland BJ, Wilder DE, Lantigua R, Stern Y, Chen J, Killeffer EH, Mayeux R. Rates of dementia in three ethnoracial groups. Int. J. Geriatr. Psychiatry. 1999;14(6):481–493. [PubMed] [Google Scholar]
- He W, Sengupta M, Velkoff VA, DeBarros K. 65+ in the United States: 2005. U.S. Department of Health and Human Services; National Institutes of Health; National Institute on Aging; the U.S. Department of Commerce, Economics and Statistics Administration; U.S. Census Bureau; 2005. [Google Scholar]
- Hebert LE, Scherr PA, Bienias JL, Bennett DA, Evans DA. Alzheimer disease in the US population: Prevalence estimates using the 2000 census. Arch. Neurol. 2003;60(8):1119–1122. doi: 10.1001/archneur.60.8.1119. [DOI] [PubMed] [Google Scholar]
- Hoffman JM, Welsh-Bohmer KA, Hanson M, Crain B, Hulette C, Earl N, Coleman RE. FDG PET imaging in patients with pathologically verified dementia. J. Nucl. Med. 2000;41(11):1920–1928. [PubMed] [Google Scholar]
- Jack CR, Jr., Lowe VJ, Senjem ML, Weigand SD, Kemp BJ, Shiung MM, Knopman DS, Boeve BF, Klunk WE, Mathis CA, Petersen RC. 11C PiB and structural MRI provide complementary information in imaging of Alzheimer's disease and amnestic mild cognitive impairment. Brain. 2008;131(Pt 3):665–680. doi: 10.1093/brain/awm336. [DOI] [PMC free article] [PubMed] [Google Scholar]
- Jagust W, Reed B, Mungas D, Ellis W, Decarli C. What does fluorodeoxyglucose PET imaging add to a clinical diagnosis of dementia? Neurology. 2007;69(9):871–877. doi: 10.1212/01.wnl.0000269790.05105.16. [DOI] [PubMed] [Google Scholar]
- Johnson KA, Gregas M, Becker JA, Kinnecom C, Salat DH, Moran EK, Smith EE, Rosand J, Rentz DM, Klunk WE, Mathis CA, Price JC, et al. Imaging of amyloid burden and distribution in cerebral amyloid angiopathy. Ann. Neurol. 2007;62(3):229–234. doi: 10.1002/ana.21164. [DOI] [PubMed] [Google Scholar]
- Kemppainen NM, Aalto S, Wilson IA, Nagren K, Helin S, Bruck A, Oikonen V, Kailajarvi M, Scheinin M, Viitanen M, Parkkola R, Rinne JO. PET amyloid ligand [11C]PIB uptake is increased in mild cognitive impairment. Neurology. 2007;68(19):1603–1606. doi: 10.1212/01.wnl.0000260969.94695.56. [DOI] [PubMed] [Google Scholar]
- Klunk WE, Engler H, Nordberg A, Wang Y, Blomqvist G, Holt DP, Bergstrom M, Savitcheva I, Huang GF, Estrada S, Ausen B, Debnath ML, et al. Imaging brain amyloid in Alzheimer's disease with Pittsburgh Compound-B. Ann. Neurol. 2004;55(3):306–319. doi: 10.1002/ana.20009. [DOI] [PubMed] [Google Scholar]
- Knopman D. Cerebrospinal fluid beta-amyloid and tau proteins for the diagnosis of Alzheimer disease. Arch. Neurol. 2001;58(3):349–350. doi: 10.1001/archneur.58.3.349. [DOI] [PubMed] [Google Scholar]
- Knopman DS, DeKosky ST, Cummings JL, Chui H, Corey-Bloom J, Relkin N, Small GW, Miller B, Stevens JC. Practice parameter: Diagnosis of dementia (an evidence-based review). Report of the Quality Standards Subcommittee of the American Academy of Neurology. Neurology. 2001;56(9):1143–1153. doi: 10.1212/wnl.56.9.1143. [DOI] [PubMed] [Google Scholar]
- Lockhart A, Lamb JR, Osredkar T, Sue LI, Joyce JN, Ye L, Libri V, Leppert D, Beach TG. PIB is a non-specific imaging marker of amyloid-beta (Abeta) peptide-related cerebral amyloidosis. Brain. 2007;130(Pt 10):2607–2615. doi: 10.1093/brain/awm191. [DOI] [PubMed] [Google Scholar]
- Manly JJ, Bell-McGinty S, Tang MX, Schupf N, Stern Y, Mayeux R. Implementing diagnostic criteria and estimating frequency of mild cognitive impairment in an urban community. Arch. Neurol. 2005;62(11):1739–1746. doi: 10.1001/archneur.62.11.1739. [DOI] [PubMed] [Google Scholar]
- Manly JJ, Tang MX, Schupf N, Stern Y, Vonsattel JP, Mayeux R. Frequency and course of mild cognitive impairment in a multiethnic community. Ann. Neurol. 2008;63:494–506. doi: 10.1002/ana.21326. [DOI] [PMC free article] [PubMed] [Google Scholar]
- Matsuda H. The role of neuroimaging in mild cognitive impairment. Neuropathology. 2007;27(6):570–577. doi: 10.1111/j.1440-1789.2007.00794.x. [DOI] [PubMed] [Google Scholar]
- Mayeux R. Apolipoprotein E, Alzheimer disease, and African Americans. Arch. Neurol. 2003a;60(2):161–163. doi: 10.1001/archneur.60.2.161. [DOI] [PubMed] [Google Scholar]
- Mayeux R. Epidemiology of neurodegeneration. Annu. Rev. Neurosci. 2003b;26:81–104. doi: 10.1146/annurev.neuro.26.043002.094919. [DOI] [PubMed] [Google Scholar]
- McGeer PL, Kamo H, Harrop R, McGeer EG, Martin WR, Pate BD, Li DK. Comparison of PET, MRI, and CT with pathology in a proven case of Alzheimer's disease. Neurology. 1986a;36(12):1569–1574. doi: 10.1212/wnl.36.12.1569. [DOI] [PubMed] [Google Scholar]
- McGeer PL, Kamo H, Harrop R, Li DK, Tuokko H, McGeer EG, Adam MJ, Ammann W, Beattie BL, Calne DB, et al. Positron emission tomography in patients with clinically diagnosed Alzheimer's disease. CMAJ. 1986b;134(6):597–607. [PMC free article] [PubMed] [Google Scholar]
- McGeer EG, McGeer PL, Harrop R, Akiyama H, Kamo H. Correlations of regional postmortem enzyme activities with premortem local glucose metabolic rates in Alzheimer's disease. J. Neurosci. Res. 1990a;27(4):612–619. doi: 10.1002/jnr.490270422. [DOI] [PubMed] [Google Scholar]
- McGeer EG, Peppard RP, McGeer PL, Tuokko H, Crockett D, Parks R, Akiyama H, Calne DB, Beattie BL, Harrop R. 18Fluorodeoxyglucose positron emission tomography studies in presumed Alzheimer cases, including 13 serial scans. Can. J. Neurol. Sci. 1990b;17(1):1–11. doi: 10.1017/s0317167100029930. [DOI] [PubMed] [Google Scholar]
- McMahon PM, Araki SS, Sandberg EA, Neumann PJ, Gazelle GS. Cost-effectiveness of PET in the diagnosis of Alzheimer disease. Radiology. 2003;228(2):515–522. doi: 10.1148/radiol.2282020915. [DOI] [PubMed] [Google Scholar]
- Mielke R, Schroder R, Fink GR, Kessler J, Herholz K, Heiss WD. Regional cerebral glucose metabolism and postmortem pathology in Alzheimer's disease. Acta Neuropathol. 1996;91(2):174–179. doi: 10.1007/s004010050410. [DOI] [PubMed] [Google Scholar]
- Mintun MA, Larossa GN, Sheline YI, Dence CS, Lee SY, Mach RH, Klunk WE, Mathis CA, DeKosky ST, Morris JC. [11C]PIB in a nondemented population: Potential antecedent marker of Alzheimer disease. Neurology. 2006;67(3):446–452. doi: 10.1212/01.wnl.0000228230.26044.a4. [DOI] [PubMed] [Google Scholar]
- Morris JC, Storandt M, McKeel DW, Jr., Rubin EH, Price JL, Grant EA, Berg L. Cerebral amyloid deposition and diffuse plaques in “normal” aging: Evidence for presymptomatic and very mild Alzheimer's disease. Neurology. 1996;46(3):707–719. doi: 10.1212/wnl.46.3.707. [DOI] [PubMed] [Google Scholar]
- Morris JC, Storandt M, Miller JP, McKeel DW, Price JL, Rubin EH, Berg L. Mild cognitive impairment represents early-stage Alzheimer disease. Arch. Neurol. 2001;58(3):397–405. doi: 10.1001/archneur.58.3.397. [DOI] [PubMed] [Google Scholar]
- Mortimer JA, Snowdon DA, Markesbery WR. Head circumference, education and risk of dementia: Findings from the Nun Study. J. Clin. Exp. Neuropsychol. 2003;25(5):671–679. doi: 10.1076/jcen.25.5.671.14584. [DOI] [PubMed] [Google Scholar]
- Mosconi L, Perani D, Sorbi S, Herholz K, Nacmias B, Holthoff V, Salmon E, Baron JC, De Cristofaro MT, Padovani A, Borroni B, Franceschi M, et al. MCI conversion to dementia and the APOE genotype: A prediction study with FDG-PET. Neurology. 2004;63(12):2332–2340. doi: 10.1212/01.wnl.0000147469.18313.3b. [DOI] [PubMed] [Google Scholar]
- Nestor PJ, Fryer TD, Smielewski P, Hodges JR. Limbic hypometabolism in Alzheimer's disease and mild cognitive impairment. Ann. Neurol. 2003;54(3):343–351. doi: 10.1002/ana.10669. [DOI] [PubMed] [Google Scholar]
- Neuropathology Group of the Medical Research Council Cognitive Function and Ageing Study (MRC-CFAS) Pathological correlates of late-onset dementia in a multicentre, community-based population in England and Wales. Lancet. 2007;357(9251):169–175. doi: 10.1016/s0140-6736(00)03589-3. [DOI] [PubMed] [Google Scholar]
- Ng S, Villemagne VL, Berlangieri S, Lee ST, Cherk M, Gong SJ, Ackermann U, Saunder T, Tochon-Danguy H, Jones G, Smith C, O'Keefe G, et al. Visual assessment versus quantitative assessment of 11C-PIB PET and 18F-FDG PET for detection of Alzheimer's disease. J. Nucl. Med. 2007;48(4):547–552. doi: 10.2967/jnumed.106.037762. [DOI] [PubMed] [Google Scholar]
- Pathological correlates of late-onset dementia in a multicentre, community-based population in England and Wales Neuropathology Group of the Medical Research Council Cognitive Function and Ageing Study (MRC CFAS) Lancet. 2001;357(9251):169–75. doi: 10.1016/s0140-6736(00)03589-3. [DOI] [PubMed] [Google Scholar]
- Patwardhan MB, McCrorg DC, Matchar DB, Samsa GP, Rutschmann OT. Alzheimer disease: Operating characteristics of PET—A meta-analysis. Radiology. 2004;231(1):73–80. doi: 10.1148/radiol.2311021620. [DOI] [PubMed] [Google Scholar]
- Petersen RC, Smith GE, Waring SC, Ivnik RJ, Tangalos EG, Kokmen E. Mild cognitive impairment: Clinical characterization and outcome. Arch. Neurol. 1999;56(3):303–308. doi: 10.1001/archneur.56.3.303. [DOI] [PubMed] [Google Scholar]
- Petersen RC, Stevens JC, Ganguli M, Tangalos EG, Cummings JL, DeKosky ST. Practice parameter: Early detection of dementia: Mild cognitive impairment (an evidence-based review). Report of the Quality Standards Subcommittee of the American Academy of Neurology. Neurology. 2001;56(9):1133–1142. doi: 10.1212/wnl.56.9.1133. [DOI] [PubMed] [Google Scholar]
- Phelps ME, Mazziotta JC, Huang SC. Study of cerebral function with positron computed tomography. J. Cereb. Blood Flow Metab. 1982;2(2):113–162. doi: 10.1038/jcbfm.1982.14. [DOI] [PubMed] [Google Scholar]
- Pike KE, Savage G, Villemagne VL, Ng S, Moss SA, Maruff P, Mathis CA, Klunk WE, Masters CL, Rowe CC. Beta-amyloid imaging and memory in non-demented individuals: Evidence for preclinical Alzheimer's disease. Brain. 2007;130(Pt 11):2837–2844.56. doi: 10.1093/brain/awm238. [DOI] [PubMed] [Google Scholar]
- Pimlott NJ, Siegel K, Persaud M, Slaughter S, Cohen C, Hollingworth G, Cummings S, Drummond N, Dalziel W, Sylvius J, Pringle D, Eliasziw T. Management of dementia by family physicians in academic settings. Can. Fam. Physician. 2006;52(9):1108–1109. [PMC free article] [PubMed] [Google Scholar]
- Riedel-Heller SG, Schork A, Matschinger H, Angermeyer MC. The role of referrals in diagnosing dementia at the primary care level. Int. Psychogeriatr. 1999;11(3):251–262. doi: 10.1017/s1041610299005815. [DOI] [PubMed] [Google Scholar]
- Silverman DH, Gambhir SS, Huang HW, Schwimmer J, Kim S, Small GW, Chodosh J, Czernin J, Phelps ME. Evaluating early dementia with and without assessment of regional cerebral metabolism by PET: A comparison of predicted costs and benefits. J. Nucl. Med. 2002;43(2):253–266. [PubMed] [Google Scholar]
- Silverman DH, Small GW, Chang CY, Lu CS, Kung De Aburto MA, Chen W, Czernin J, Rapoport SI, Pietrini P, Alexander GE, Schapiro MB, Jagust WJ, et al. Positron emission tomography in evaluation of dementia: Regional brain metabolism and long-term outcome. JAMA. 2001;286(17):2120–2127. doi: 10.1001/jama.286.17.2120. [DOI] [PubMed] [Google Scholar]
- Tang MX, Stern Y, Marder K, Bell K, Gurland B, Lantigua R, Andrews H, Feng L, Tycko B, Mayeux R. The APOE-epsilon4 allele and the risk of Alzheimer disease among African Americans, whites, and Hispanics. JAMA. 1998;279(10):751–755. doi: 10.1001/jama.279.10.751. [DOI] [PubMed] [Google Scholar]
- UN . The United Nations Population Division. World Population Prospects: The 2002 Revision. United Nations; New York: 2003. [Google Scholar]
- US Preventive Services Task Force Screening for dementia: Recommendations and rationale. Guide to Clinical Prevention Services. Ann. Intern. Med. 2003;139:925–926. [Google Scholar]
- Wimo A, Winblad A, Jönsson A. An estimate of the total worldwide societal costs of dementia in 2005. Alzheimers Dement. J. Alzheimers Assoc. 2007;3(2):81–91. doi: 10.1016/j.jalz.2007.02.001. [DOI] [PubMed] [Google Scholar]
- World Health Organization . Mental Health Atlas. 2005. p. 471. [Google Scholar]