

Abstract
Background
There are several methods of delivering cortical brain stimulation to modulate cortical excitability and interest in their application as an adjuvant strategy in aphasia rehabilitation after stroke is growing. Epidural cortical stimulation, although more invasive than other methods, permits high frequency stimulation of high spatial specificity to targeted neuronal populations.
Aims
First, we review evidence supporting the use of epidural cortical stimulation for upper limb recovery after focal cortical injury in both animal models and human stroke survivors. These data provide the empirical and theoretical platform underlying the use of epidural cortical stimulation in aphasia. Second, we summarize evidence for the application of epidural cortical stimulation in aphasia. We describe the procedures and primary outcomes of a safety and feasibility study (Cherney, Erickson & Small, 2010), and provide previously unpublished data regarding secondary behavioral outcomes from that study.
Main Contribution
In a controlled study comparing epidural cortical stimulation plus language treatment (CS/LT) to language treatment alone (LT), eight stroke survivors with nonfluent aphasia received intensive language therapy for 6 weeks. Four of these participants also underwent surgical implantation of an epidural stimulation device which was activated only during therapy sessions. Behavioral data were collected before treatment, immediately after treatment, and at 6 and 12 weeks following the end of treatment. The effect size for the primary outcome measure, the Western Aphasia Battery Aphasia Quotient, was benchmarked as moderate from baseline to immediately post-treatment, and large from baseline to the 12-week follow-up. Similarly, effect sizes obtained at the 12-week follow-up for the Boston Naming Test, the Communicative Effectiveness Index, and for correct information units on a picture description task were greater than those obtained immediately post treatment. When effect sizes were compared for individual subject pairs on discourse measures of content and rate, effects were typically larger for the investigational subjects receiving CS/LT than for the control subjects receiving LT alone. These analyses support previous findings regarding therapeutic efficacy of CS/LT compared to LT i.e. epidural stimulation of ipsilesional premotor cortex may augment behavioral speech-language therapy, with the largest effects after completion of therapy.
Conclusions
Continued investigation of epidural cortical stimulation in combination with language training in post-stroke aphasia should proceed cautiously. Carefully planned studies that customize procedures to individual profiles are warranted. Information from research on non-invasive methods of CS/LT may also inform future studies of epidural cortical stimulation.
Aphasia rehabilitation has focused traditionally on behavioral and environmental interventions. In spite of the extensive literature that indicates that individuals with aphasia benefit from such treatment (Albert, 1998; Cherney & Robey, 2008; Holland, Fromm, DeRuyter & Stein, 1996; Robey, 1994, 1998), most patients continue to be left with residual deficits that affect their daily communication as well as their quality of life.
As we acquire new knowledge about aphasia and brain-behavior relations, novel approaches to treatment are emerging. For example, Small(2002, 2004) has advocated for a biological model of aphasia rehabilitation in which the goal of remediation is to alter brain anatomy and physiology so that language function can be restored. Importantly, the efficacy of biological interventions seems to depend on the presence of concomitant behavioral training. Whereas biological interventions can stimulate the injured brain, repair the physical damage, or make it more susceptible to the effects of training, concomitant behavioral interventions are needed to retrain the new circuitry and/or integrate new or modified circuits with existing (preserved and/or altered) ones. Thus the promise of any biological treatment appears to be as an adjuvant to the behavioral training(Dobkin, 2004).
Facilitating brain plasticity with the direct application of stimulation to the cerebral cortex is a new area of investigation that shows promise for enhancing language recovery in stroke-induced aphasia, most probably when it is combined with intense training. Cortical stimulation approaches are partly based on a model of interhemispheric competition between the injured and the intact hemisphere(Fregni & Pascual-Leone, 2007; Talelli & Rothwell, 2006). According to this model, deficits may result from at least two possible sources: (1) reduced activity or output of the injured hemisphere; and (2) excess inhibition of the injured hemisphere by the relatively preserved contralesional hemisphere. Depending on how it is applied, the cortical stimulation modulates the stroke-induced imbalance of activity between the two cerebral hemispheres. Improvements may occur by either increasing the output of recruited areas of either the injured or opposite hemisphere or decreasing the inhibitory activity of the maladaptive areas of either hemisphere. Support for this hypothesis has come from physiologic and imaging studies showing disinhibition and increased activity of the contralesional hemisphere after stroke in the motor and language domains(Bütefisch, Netz, Wessling, Seitz, & Hömberg, 2003; Rosen et al., 2000).
There are several methods of delivering cortical brain stimulation to modulate cortical excitability (Lefaucher, 2009). These include direct epidural cortical stimulation, repetitive transcranial magnetic stimulation (rTMS), and transcranial direct current stimulation (tDCS), each of which have been studied in animal models with promising resultsand subsequently applied to the rehabilitation of motor deficits after stroke(Harvey & Nudo, 2007; Talelli & Rothwell, 2006). Application of these methods to language problems after stroke is only now beginning to emerge. Nevertheless, results suggest a potential role for cortical stimulation as an adjuvant strategy in aphasia rehabilitation.
This article focuses on epidural cortical stimulation. Although more invasive than the other methods, it permits high frequency stimulation of high spatial specificity to targeted neuronal populations, potentially inducing plastic neuronal changes in specific cortical regions of interest. In addition, implanted stimulation may be more clinically useful if tolerated since it avoids the need to re-localize stimulation on a daily basis as is necessary with non-invasive stmulation (Harvey & Nudo, 2007). First, we review the evidence supporting the use of epidural cortical stimulation for upper limb recovery after focal cortical injury in both animal models and human stroke survivors. These data provide the empirical and theoretical platform underlying the use of epidural cortical stimulation in aphasia. Second, we summarize evidence related to the application of epidural cortical stimulation in aphasia. Following a description of the procedures and primary outcomes of a safety and feasibility study (Cherney, Erickson & Small, 2010), we provide previously unpublished data regarding secondary behavioral outcomes from that study. We conclude with comments regarding the future of epidural cortical stimulation as an adjuvant treatment for stroke-induced aphasia.
Preclinical Studies of Cortical Stimulation Combined with Rehabilitation Training
Table 1 summarizes key results from the literature that have demonstrated in animal studies that cortical stimulation (CS) combined with rehabilitation training (RT) enhances motor functional outcomes compared to rehabilitation alone. In a series of early studies, rats were pretrained on a skilled reaching task before receiving sensorimotor cortex lesions and implantation of chronic subdural electrodes (Adkins-Muir & Jones, 2003; Kleim et al., 2003; Teskey, Flynn, Goertzen, Monfils, & Young, 2003). Following surgery, some of the rats received subdural stimulation of the motor cortex concurrent with repetitive practice in the pretrained skilled reaching task (CS/RT) while other rats received only the repetitive rehabilitation training (RT) for a period of 10 days. In all the studies, performance on the reaching task in rats receiving CS/RT was superior to that of the rats receiving RT. Furthermore, enhanced behavioral function in the CS/RT groups also coincided with neuroanatomical and neurophysiological changes including increased dendritic density (Adkins-Muir & Jones, 2003), enlarged microstimulation-evoked motor maps (Kleim et al., 2003), and enhancement in the polysynaptic component of evoked potentials(Teskey et al., 2003) in ipsilesional cortex compared to those receiving RT alone.
Table 1.
Animal Studies of Direct Cortical Stimulation (CS) Combined with Rehabilitation Training (RT) for Upper Extremity Motor Recovery
| Study | Animal model | Cortical Stimulation Parameters | Rehabilitation Training | Behavioral Outcomes | Neuroanatomical/Neurophysiological Outcomes |
|---|---|---|---|---|---|
| Kleim et al., 2003 | Rodent Compared monopolar cathodal, bipolar cathodal, monopolar anodal, and no CS |
Subdural 50Hz 1 sec pulse | Single pellet reaching task 20minutes/day for 10 days | Both monopolar and bipolar CS enhanced motor recover – monopolar stimulation more effective | Both monopolar and bipolar CS increased area of cortex from which microstimulation movements could be evoked |
| Teskey et al., 2003 | Rodent Compared frequencies (0, 25, 50, 100, 250, and 500 Hz) |
Subdural 0,25,50, 100, 250, 500 Hz 3 sec pulse 50% MT | Pasta Matrix Task 20 minutes/day for 10 days | CS with frequencies between 50 and 250 Hz more effective Returned to preinfarct training levels for reaching success. |
Enhanced evoked potentials and lowering of the MT (25Hz and above) Larger polysynaptic potentiation between 50 and 500 Hz. |
| Adkins- Muir & Jones, 2003 | Rodent Compared frequencies (50Hz, 250 Hz, and no CS) |
Subdural 50Hz, 250 Hz no CS 3 sec pulse 50–70% MT | Montoya staircase – retrieved food pellets placed at variable distances on a “staircase” 20 minutes/day for 10 days | No sig. difference in reaching between 250 Hz and no CS. 50 Hz group had significantly greater rate of improvement in reaching | 50 Hz significant increase in surface density of dendritic processes in perilesion cortex compared to other two groups |
|
Plautz et al., 2003 Plautz & Nudo (2005) |
Nonhuman Primate Assessed feasibility of CS/RT in primates |
Subdural 50 Hz 50% MT 1 sec continuous stimulation – unlimited duration pulse train Monopolar Modified stimulus parameters – monopolar cathodal 100 μsec duration 100 Hz 50% MT |
Unimanual pellet retrieval task requiring skilled use of hand – progressed through training stages in which gradual decrease in the diameter of the wells required increasing finger dexterity. Two 35 minute sessions per day for 30 days. CS initiated 5 minutes before RT. |
Sig improvement in motor performance (success, speed, efficiency) of pellet retrieval which persisted for at least 4 months. Substantial but incomplete resolution of chronic motor performance deficits. Peak recovery level (% recovery to preinfarct level) was 88% for CS/RT and 43% for RT alone |
Large scale emergence of new hand representations in peri-infarct motor cortex, notably in cortical tissue underlying the electrode |
| Adkins et al., 2006 | Rodent Compared anodal versus cathodal stimulation |
Epidural 100Hz monopolar stimulation 50% MT | Single pellet retrieval task 60 trials per day or 15 minutes whichever occurred first for 18 days | Demonstrated efficacy of epidural CS/RT Both anodal and cathodal CS enhanced reaching performance compared to no CS group | Cathodal CS/RT group showed increased neuronal density in perilesion cortex |
| Adkins et al., 2008 | Rodent Compared effect of CS/RT on rats with moderate versus severe retrieval deficits |
Epidural 100Hz monopolar cathodal stimulation 40–50% MT | Single pellet retrieval task 60 trials per day or 15 minutes whichever occurred first for 18 days | CS/RT enhanced recovery of reaching success in the moderately but not severely impaired subgroups. | Both CS/RT groups had increased density of axodendritic synapses compared to no CS and there was a positive correlation between post rehab reaching success and synaptic density. |
| Boychuk et al., 2011 | Rodent Compared focal versus distributed CS |
Epidural monopolar 1-second, 50- Hz cathodal pulse 50% motor threshold | Single pellet skilled reaching task 15 minutes/day for 12 consecutive days | Only the distributed CS/RT enhanced motor performance with RT. | Both the focal and distributed CS/RT promoted motor map reorganization |
CS = cortical stimulation; RT = rehabilitation training; MT = motor threshold
These studies also began to determine optimal stimulation parameters by evaluating different stimulation frequencies and polarities. For example, monopolar stimulation delivers current to the cortex via a single polarity, either cathodal (negative pole) or anodal (positive pole). With monopolar stimulation the current flows into the cortex and exits the body at a remote site. In contrast, bipolar stimulation is delivered with a single electrode where current flows out from one contact on the electrode and returns via another contact on the electrode. The current then flows across the cortex locally underneath the electrode contact area with bipolar stimulation. Kleim et al. (2003) demonstrated that both monopolar and bipolar stimulation induced significant increases in peri-infarct movement representations in comparison to controls. However, monopolar stimulation was more effective at improving motor performance. Teskey et al. (2003) found that rats receiving CS/RT with frequencies between 50 and 250 Hz returned to their preinfarct training levels, while Adkin-Muir & Jones (2003) found that the greatest rate of improvement in reaching occurred with 50 Hz stimulation as compared to 250 Hz or no stimulation.
More recent studies using a rodent model of focal ischemia have utilized electrodes placed epidurally, rather subdurally, which more closely mirrors electrode placement in human trials. Importantly, Adkins and colleagues (2006) demonstrated that epidurally delivered cortical electrical stimulation produced results similar to those found with subdurally implanted electrodes. Additionally their study compared anodal and cathodal 100 HZ monopolar cortical stimulation delivered at 50% motor threshold; while both polarities improved forelimb motor movement in rats when combined with rehabilitation training, results suggested that cathodal stimulation may contribute to greater perilesional neuronal density (Adkins et al., 2006).
In a subsequent study, Adkins, Hsu & Jones (2008) demonstrated that the severity of the behavioral impairment could impact the outcomes of CS/RT. Rats were divided into severely and moderately impaired subgroups based on the initial magnitude of their reaching deficits immediately after infarction. Two weeks later, the rats received either 100Hz cathodal stimulation at 50% of movement thresholds or no stimulation (control) during rehabilitation training on a reaching task. The CS/RT enhanced recovery of reaching success in the moderately but not the severely impaired subgroups. However, both severity groups receiving cortical stimulation had increased density of axodendritic synapses compared to no cortical stimulation, and there was a positive correlation between post-rehabilitation reaching success and density of axodendritic synapses.
Another factor impacting outcomes of CS/RT relates to the distribution of electrical stimulation across the cortex. The animal studies described above have typically used more distributed arrangements of stimulation that include representations of face and proximal forelimb movements. A recent study compared a distributed versus focal arrangement of electrical contacts during CS/RT. Both electrode configurations used four identical contacts; in the distributed configuration, they were each placed in the corner of a 2 mm by 2 mm square, whereas in the focal arrangement, they were clustered in the center. The study found that only the distributed form of CS/RT enhanced motor performance in the rodents when combined with rehabilitation, even though both forms of CS/RT promoted motor map reorganization (Boychuk, Adkins, & Kleim, 2011). This finding is important because many of the human studies have delivered the stimulation to a focal region of motor cortex.
Given the promising results from using CS/RT in rodents, its use in humans seemed worth pursuing. However, prior to evaluating the use of such device-assisted cortical stimulation in humans, it was important to evaluate its feasibility in a non-human primate model of focal ischemia. Adult squirrel monkeys were selected for such a study because their nervous system shares many functional and anatomical complexities with the human nervous system (Plautz et al., 2003; Plautz & Nudo, 2005). Additionally, the motor cortex of the squirrel monkey is located in a relatively unfissured region on the exposed surface of the brain, thereby facilitating detailed functional mapping of motor outputs (Plautz & Nudo, 2005). The monkeys were trained to remove food pellets from wells of decreasing diameter, a task that required increased skilled use of digits. Functional maps of the motor representation of the preferred hand and arm in primary motor cortex were obtained. In the same surgical procedure, an ischemic infarct was produced, destroying the primary motor cortex hand representation while sparing the surrounding arm representations and premotor hand/arm representations. Several weeks later, a second surgery was performed to remap the motor cortex for lesion verification and to implant a subdural surface electrode over an intact region of peri-infarct motor cortex. Following several months of stabilization of recovery, the monkeys received 30 days of subthreshold CS/RT. Post-therapy, their behavioral performance was tracked for several months and a third cortical map was derived.
Results showed statistically significant gains in the ability of the monkeys to retrieve the food pellets from the wells with combined CS/RT, though there was not a return to preinfarct abilities (Plautz et al., 2003). Cortical mapping after the CS/RT showed newly emerged hand representations involving cortex both adjacent to the infarct and a considerable distance from it, with the greatest expansions occurring in the cortex immediately beneath the electrode patch. These results suggested that cortical stimulation can facilitate positive involvement of cortical regions that would not otherwise be involved in recovery (Plautz & Nudo, 2005). In addition to supporting the feasibility of CS/RT to improve motor deficits post-stroke, this study also showed that the intervention does not need to be limited to the immediate post-stroke period; improvements can be obtained when the intervention is provided several months after the infarct. Furthermore, post-therapy performance levels were maintained throughout a follow-up period of at least four months (Plautz et al., 2003; Plautz & Nudo, 2005).
Cortical Stimulation Combined with Rehabilitation Training for Improved Motor Function in Humans
Although human trials for regeneration and repair after stroke aim to translate results from animal studies, it is important to note the differences between animal models of stroke and the actual biological manifestations of human stroke (Nudo, 2007). For example, focal artificially-induced lesions in animal models usually spare adjacent cortex, whereas in humans, lesions are often more diffuse, and have lower survival of peri-infarct representations. Additionally, animal models do not have the comorbidities common in adults with stroke, since the experiments are typically undertaken in healthy, young to middle aged animals, and potential confounds are tightly controlled. In the natural environment, clinical stroke is often accompanied by and/or results from complex predisposing conditions such as cardiovascular disease and related obesity, diabetes, hypertension, hypercholesterolemia, and age, which can change the underlying neural substrate in the brain.
Despite these caveats, much can be learned from animal research, and there has been a progression of human research based on this work evaluating the safety, feasibility and efficacy of CS/RT for the treatment of upper extremity movement deficits following stroke in humans. For example, with regard to safety, epidural rather than subdural implantation is preferred in human studies because it has been shown to increase the activation threshold and reduce the risk of induced seizure (Bezard, Boraud, Nguyen, Velasco, Keravel, & Gross, 1999). CS/RT studies for upper extremity movement deficits following stroke in humans are summarized in Table 2. Promising results have been evident in case reports (Canavero, Bonicalzi, Intonti, Crasto, & Castellano, 2006; Kim et al., 2008), small phase 1 pilot studies (Brown, Lutsep, Cramer, & Weinand, 2003; Brown, Lutsep, Weinand, & Cramer, 2006), and larger Phase 2 studies (Levy et al, 2008; Huang et al., 2008). In the Phase 1 study (Brown et al., 2003, 2006), CS was applied at 50 Hz at 50% MT up to a maximum of 6.5 mA, using an implantable epidural electrode device with a 3 × 3 array of electrodes and an external electrode lead and external pulse generator. Two subjects were excluded after implantation due to external electrode lead complications and infection. Therefore, in the following Phase 2 study, the pulse generator was modified and internalized in a subcutaneous pocket in the chest wall, much like a pacemaker, with wire leads tunneled under the skin to the electrodes. This served to decrease the risks of device-associated adverse events and consequently no infections occurred. This device is also the same device that was used in our feasibility study evaluating epidural CS/RT in individuals with aphasia.
Table 2.
Clinical Studies of Cortical Stimulation (CS) Combined with Rehabilitation Training (RT) for Upper Extremity Motor Recovery Following Stroke
| Study | Number of subjects | Cortical Stimulation | Behavioral Treatment | Behavioral Results | Safety |
|---|---|---|---|---|---|
| Canavero et al 2006 | 1 | Extradural CS. Sequential 1-month blocks of anodal or cathodal stimulation for 8 stimulation intervals to left or right motor cortex.. Each block with different stimulating parameters: low (50Hz) and high (130 Hz) frequency cathodal and anodal stimulation |
2 hours a day, 5 days a week of standard neuro-facilitatory physiotherapy | Best benefit during left hemisphere stimulation; no benefit at hand/wrist but improved arm extensions (strength, range of motion, durability). Benefits at both high (130 Hz) and low (50 Hz) frequencies |
Transitory head dyesthesias with left hemisphere stimulation; arm pain which hindered movement and worsened gait with right hemisphere stimulation |
| Kim et al. 2008 | 1 | Epidural unipolar anodal CS Contralateral motor and premotor cortex 200 μs pulse duration at 50 Hz 1V progressively increased to 5V over 4 weeks |
2 hours a day for 4 months of active rehabilitation training | UEFM increased from 35 – 42/66; FIM score for selfcare, mobility, locomotion increased from 82 – 95/126. Improved gait with no assistance from cane or caregiver. | No adverse events |
| Brown et al., 2003 | 1 | Epidural bipolar CS (3×3 array of 3mm electrodes) Ipsilesional primary motor cortex associated with finger flexion 100 s pulse duration at 50 Hz 4.5mA |
3 hours/day 5 days/week 3 weeks. | Improved UEFM from 36 – 46; maintained for 4 weeks | No adverse effects |
| Brown et al., 2006 | 8 | Epidural bipolar CS (3×3 array of 3mm electrodes) Ipsilesional primary motor cortex associated with finger and wrist movement. 250μs pulse duration at 50 Hz 50% MT; 6.5mA |
3 hours/day 5 days/week 3 weeks. | 29 % improvement in UEFM in CS/RT compared to 9% for LT at week 1; greater decline in RT alone by 12-weeks; at 12-week follow-up, CS/RT statistically better that RT on UEFM (p=0.003) and hand function score of SIS (p=0.001). | Complication with externally wired system in 2 subjects |
| Levy et al., 2008/Huang et al., 2008 | 24 | Epidural bipolar CS (2×3 array of 3mm electrodes). Fully implanted pulse generator (IPG). Ipsilesional primary motor cortex associated with finger and wrist movement Pulse duration of 250μs at 50 Hz for 6 weeks or 101 Hz for 4 weeks depending on protocol 50% MT 6.5 mA |
6 weeks for a total of 65 hrs of treatment Protocol 1: −2.5 hours, 5 times/week for 4 weeks; then 2.5 hours, 3 times/week for 2 weeks Protocol 2: 2.5 hours, 3 times/week for 2 weeks; then 2.5 hours, 5 times/week for 4 weeks |
Greater improvements in UEFM and AMAT in CS/RT versus RT group; significant difference for UEFM at 6 month follow-up (p= 0.042). | 1 acute post-operative seizure unrelated to the device or treatment |
| Phase III Clinical Trial (Harvey & Winstein, 2009; Plow et al., 2009) | 146 | Epidural bipolar CS (2×3 array of 3mm electrodes) Fully implanted pulse generator (IPG). Ipsilesional primary motor cortex associated with finger and wrist movement 250μs pulse duration at 50Hz 50% MT 6.5mA |
2.5 hours/day 5 days/week for 4 weeks; then 3 days/week for 2 weeks |
No significant difference between CS/RT and RT groups in UEFM and AMAT | Not assessed |
CS/RT = cortical stimulation with rehabilitation training; RT = rehabilitation training; UEFM = Upper Extremity Fugl-Meyer; AMAT = Arm Motor Ability Test; SIS = Stroke Impact Scale
The phase 2 motor study evaluated two different stimulation frequencies, each administered during a different therapy protocol (Huang et al., 2008). Both protocols lasted for six weeks and provided 65 hours of rehabilitation therapy, but with differences in the application of the cortical stimulation. In the first protocol, rehabilitation training was provided to all subjects for 2.5 hours, five times a week for 4 weeks, followed by 2.5 hours three times a week for two weeks. Investigational subjects were given CS during all therapy sessions at a frequency of 50 Hz. to primary motor cortex. In the second protocol, rehabilitation therapy was provided to all subjects for 2.5 hours three times a week for 2 weeks, followed by 2.5 hours five times a week for 4 weeks. Investigational subjects were given CS during the last four weeks of therapy at a frequency of 101 Hz. Primary outcome measures were the Upper Extremity Fugl-Meyer (UEFM) and the Arm Motor Ability Test (AMAT). Overall, there was a trend for greater improvement on both outcome measures during the treatment phase, but this was not statistically significant (Levy et al., 2008; Huang et al., 2008). However, a persisting significant treatment effect was seen on the UEFM at the 24-week follow-up such that the CS/RT group maintained gains while the RT control group declined back to baseline (p = 0.041). This is similar to Brown’s (2006) study where patients receiving stimulation maintained a nearly 10 point improvement in UEFM at the 3 month follow-up while the control groups gains declined from 3.9 at one week after treatment to a 1.9 point improvement at 12 weeks (p = 0.047).
Based on the design and methodology of the successful Phase 2 study, a pivotal Phase 3 study was implemented (Harvey & Winstein, 2009). The results from 146 subjects, released in January 2008, failed to show a significant difference between the CS/RT and RT groups on the UEFM or the AMAT. Given the successful results from animal models and preliminary studies, this disappointing result has led to speculation about why no overall effect was found in the 146 participants. Several such factors have been postulated, including the fMRI methods used to locate the site of stimulation, the distribution of the current to the targeted brain regions, non-customization of stimulus parameters (e.g., dosage and frequency) to each subject’s individual cortical activation and responsiveness to stimulation, and the timing of the cortical stimulation in relation to the behavioral treatment (Plow, Carey, Nudo, & Pascual-Leone, 2009). Unpublished criticism of the study has also suggested that the stimulator may not have been sufficiently powered since only 13 subjects had a motor threshold at or below the maximum stimulation of the implanted pulse generator. In addition, cortical atrophy around the lesions may have reduced the power of the stimulation. Given that mechanisms of recovery vary depending on the type and site of lesion, the stage of recovery, and the integrity of descending pathways, epidural cortical stimulation trials may need to carefully individualize both the brain stimulation and the rehabilitation training in order to capture optimal benefits (Plow et al., 2009). These factors are important considerations not only for cortical stimulation trials for motor deficits but also for epidural cortical stimulation trials for post-stroke aphasia.
Epidural Cortical Stimulation and Aphasia
There are relatively few studies evaluating the application of epidural cortical stimulation combined with behavioral treatment for aphasia. Aphasia is briefly mentioned in a case report examining bilateral extradural motor cortex stimulation in a subject with hemiplegia following a stroke that occurred almost three years previously (Canavero et al., 2006). Multiple sequential blocks of stimulation to areas of maximal functional MRI activation were provided in combination with physical therapy. Both low frequency (50Hz) and high frequency (130Hz) stimulation, first to the left hemisphere (during four 1-month stimulation intervals) and then to the right hemisphere (during four 3-week stimulus intervals) was administered. The investigators noted that after stimulation to the left hemisphere “speech was more fluid, his train of talk lasted longer”. However, no formal comprehensive assessment of language was made. Stimulation to the healthy right hemisphere did not result in any positive changes.
This contrasts with another case report in which unipolar anodal electrodes were implanted epidurally to cover the premotor and motor cortex as well as Broca’s area (Kim et al., 2008). The subject was described as having severe dysarthria and severe aphasia resulting from a stroke that occurred 18 months previously. Improvements in motor and language performance were noted after four months of treatment involving 50 Hz CS plus rehabilitation training of two hours daily. These included improved “visual response times for picture words stimuli” from 13.7 seconds to 2.97 seconds, and increased articulatory accuracy (from 45% to 59%). With regard to the aphasia, improved recognition of common nouns was noted.
Neither of these case studies provides a detailed description of the aphasia before and after the application of the CS. Neither do they provide information about the behavioral treatment for aphasia that accompanied the CS. Nevertheless, the case reports are valuable in that they are the first published reports of extradural cortical stimulation and aphasia, and they begin to address the safety of CS over extended periods of time. In the first case report, there was some indication of transitory head dyesthesias; in the second case report, no adverse effects were noted.
We conducted the first controlled study comparing epidural CS plus language treatment (CS/LT) to language treatment alone (LT) in a small group of individuals with chronic nonfluent aphasia. While the intent of this phase 1 study was primarily safety and feasibility, preliminary notions regarding the efficacy of CS as an adjuvant treatment for nonfluent aphasia emerged (Cherney et al., 2010). The purpose of this article is to: (1) summarize the procedures and primary outcomes of the safety and feasibility study, elaborating on the details of the behavioral treatment accompanying the CS; and (2) provide previously unpublished data regarding secondary behavioral outcomes that focus on therapeutic efficacy and address the following two questions:
Does CS/LT result in language improvements that are greater than those that are achieved by LT alone?
Does CS/LT result in language improvements that are maintained, and if so, are they maintained better than those of the LT group?
Participants
Four investigational subjects who received cortical stimulation plus language therapy (CS/LT) and four control subjects who received the identical language therapy (LT) participated in this single blind randomized control trial.
Participants presented with chronic aphasia (more than 12 months post onset) following a single left-hemisphere ischemic infarction, confirmed by MRI. Eligibility criteria included the following: nonfluent aphasia (but not global aphasia) with a Western Aphasia Battery (WAB) (Kertesz,1982) Aphasia Quotient (AQ) score of 20–80; premorbidly right handed as determined by the Edinburgh Handedness Inventory (Oldfield, 1971); at least a 12th-grade education; English spoken as the primary language; visual acuity no worse than 20/100 corrected in the better eye; and auditory acuity no worse than 30 dB HL at 500, 1000, and 2000 Hz, aided in the better ear. Exclusion criteria were seizure disorders, hemorrhage, or depression as measured by the Center for Epidemiologic Studies Depression Scale (CES-D) ( Radloff, 1977; Shinar et al., 1986 ). In addition, participants who showed no activation of the left lateral premotor cortex with several language related tasks during fMRI were excluded. All participants provided written informed consent with the approval of the Institutional Review Boards of Northwestern University and the University of Chicago. The study was also approved by the US Food and Drug Administration under an Investigational Device Exemption.
The first four participants who met the inclusion criteria were randomly assigned to the investigational (CS/LT) or control groups (LT). The next four participants were required to be within 10 points on the WAB AQ of one of the already randomized participants. After being matched by aphasia severity, they were assigned to the opposite group. Table 3 shows the primary characteristics of the enrolled participants. The first four eligible randomized participants were participants 001, 002, 005 and 008. Participants are ordered in matched pairs according to the severity of aphasia, as determined by the initial Aphasia Quotient (AQ) of the WAB. Note that the baseline WAB AQ scores in Table 3 represent the average score of two pre-treatment administrations for all participants except 001, because more than 30 days had elapsed between baseline assessment and the initiation of treatment.
Table 3.
Subject Characteristics
| Subject | Baseline WAB AQ | Gender | Age | Time post-stroke (months) | Lesion Location | Lesion Size (% left hemisphere cortical volume) |
|---|---|---|---|---|---|---|
| Mild-moderate | ||||||
| 002 (CS/LT) | 82.25 | M | 51 | 194.7 | Fronto-insular | 5 |
| 016 (LT) | 79.95 | M | 42 | 12.4 | Temporal | 8 |
| Moderate | ||||||
| 015 (CS/LT) | 72.00 | M | 57 | 13.3 | Fronto-parietal | 11 |
| 005 (LT) | 59.45 | F | 56 | 12.7 | Fronto-temporal | 17 |
| Moderate-severe | ||||||
| 014 (CS/LT) | 45.85 | M | 34 | 13.7 | Temporal | 10 |
| 001 (LT) | 40.0 | M | 61 | 29.8 | Fronto-insular | 7 |
| Severe | ||||||
| 008 (CS/LT) | 34.20 | F | 60 | 40.8 | Parietal | 13 |
| 012 (LT) | 30.75 | M | 47 | 13.1 | Parieto-temporal | 15 |
For all participants except 001, baseline WAB AQ scores represent the average score of two administrations because more than 30 days had lapsed between baseline assessment and treatment initiation. Subjects are paired for severity based on the initial WAB AQ score, not the averaged baseline score.
Procedures
Participants were assessed at 4 separate time periods: (1) at entry into the study (baseline); (2) immediately after the 6-week treatment period (post-treatment); (3) 6 weeks following the end of the intervention (6-week follow-up); and 12 weeks following the end of the intervention (12-week follow-up). The speech-language pathologist (SLP) who conducted the assessments was independent of the SLP who provided the treatment and blind to the participant’s group assignment; all participants wore complete head coverings to hide possible evidence of recent surgery.
Each assessment period involved three visits on consecutive days for completion of the behavioral tests. At each assessment period, participants were evaluated using the WAB. The WAB AQ served as the primary outcome measure, with a five-point improvement from baseline to post-treatment being considered success (this value exceeds the standard error of the test). If more than 30 days passed between the initial baseline assessment and the beginning of treatment, the primary outcome measure, the WAB AQ, was readministered and the mean of the two WAB AQ scores (baseline and pre-treatment) was used for all subsequent analyses.
Secondary outcome measures included scores on the Boston Naming Test (BNT) (Kaplan, Goodglass, & Weintraub, 2001), caregiver ratings of the Communicative Effectiveness Index (CETI) (Lomas et al., 1989), and several discourse measures. Discourse tasks included descriptions of two composite pictures (Nicholas & Brookshire, 1993). One picture showed a birthday party scene in which a piece of cake had been eaten by a dog, seen hiding under the couch; the other showed an outdoor scene in which two firemen were coming to assist a man who got stuck in a tree while attempting to rescue a cat in the same tree. Participants’ responses on the picture description tasks were transcribed and scored for Correct Information Units (CIUs) according to the procedures outlined by Nicholas and Brookshire (1993). CIU analysis provides a reliable standardized rule-based scoring system that evaluates the informativeness of connected speech in adults with aphasia. In addition, a measure of rate of speech in words per minute was obtained. The picture description tasks were completed during each evaluation visit, thereby yielding three scores for CIUs and words/minute at baseline, at post-treatment, and at each of the follow-up periods. Participants were also evaluated with the NIH Stroke Scale (Goldstein, Bertels, & Davis, 1989), the Box and Block Test(Desrosiers, Bravo, Hebert, Dutil, & Mercier, 1994), and selected subtests of the Behavioral Inattention Test(Wilson, Cockburn, & Halligan, 1987).
At baseline and post-treatment, participants underwent task-dependent BOLD functional MRI at 3 Tesla, using T2* gradient echo spiral acquisition with a standard head coil(Noll, Cohen, Meyer, & Schneider, 1995). Tasks performed included (a) observation of a woman in a video producing single syllables “ta”, “pa”, “tha”, and “ka”; (b) verbal repetition of the same syllables produced by the woman in the video; and (c) reading aloud 3–5 word sentences that appeared on the screen. A volumetric T1-weighted scan (120 axial slices, 1.5 × 0.938 × 0.938 mm resolution) was acquired and averaged to provide high-resolution images on which to identify anatomical landmarks and onto which functional activation maps could be superimposed. Detailed fMRI image processing methods have been described previously (Cherney et al., 2010). Participants were considered eligible if there were common areas of activation in the ventral portion of the left precentral gyrus or sulcus (surface anatomy corresponding to Brodmann Area 6lv) between the imitation and observation tasks or between the imitation and oral reading tasks.
Participants randomized to the investigational group (CS/LT) required surgical implantation of the cortical stimulation device. Device implantation was scheduled for approximately two weeks after randomization to permit sufficient time off antithrombotic agents. In the neurosurgical operating room, an investigational epidural 2 ×3 grid electrode array, 2.6 × 2.7 cm in total area (Northstar Neuroscience Inc., Seattle, WA, USA) was implanted on the dura over the left ventral precentral gyrus at the site closest to the fMRI activation site using frameless stereotaxic neuronavigation. The electrode lead was tunneled to a sub-clavicular site and connected to an investigational implanted pulse generator (Northstar Neuroscience). A second surgical procedure was performed to remove the implanted system at the end of therapy, following the post-treatment assessment. (See Figure 1)
Figure 1.

Illustration showing the cortical electrode over left ventral precentral gyrus, the electrode lead, and the subclavicular implantable pulse generator (IPG). Note that the lead and IPG were fully internalized.
Intervention
Participants in the investigational group (CS/LT) began treatment one week after surgery for placement of the device. Control subjects (LT) began treatment approximately 2–3 weeks after randomization to parallel the timing of the initiation of treatment for the investigational group.
Both investigational (CS/LT) and control participants (LT) received three hours of language therapy per day, five days a week, for six weeks. Treatment hours were spread throughout the day, allowing frequent breaks for the participants. Investigational participants (CS/LT) also received bipolar cortical stimulation during each therapy session. The stimulator was activated daily prior to the therapy session and deactivated at the end of therapy using a hand-held telemetry device. The target stimulation level was determined prior to the first treatment session and defined as 50% of the language function threshold (i.e. the minimum amount of current required to inhibit language function during a counting task or to elicit movement of the mouth or tongue). If language function was not affected within the programmed parameter limits of the implanted pulse generator then the stimulation level was set to the lesser of the maximum stimulator current or 6.5 mA. One participant (002) received stimulation at 4.75 mA. For all other participants, it was set at 6.5 mA. The pulse repetition frequency was 50 Hz and the pulse duration was 250 microseconds (μsec) for all participants.
The language treatment protocol was designed to be 1) representative of what clinicians are doing in clinical practice in that it included practice at each of the phoneme, word, sentence and discourse levels of language; 2) appropriate for study participants with nonfluent aphasia that spanned a wide range of severities; and 3) clearly and specifically defined to ensure consistency of the intervention over time, between study participants, and across therapists.
The first hour of treatment was provided by a trained SLP and included 15 minute blocks that alternated apraxia drills and rapid cued confrontation naming. The apraxia drills (30 minutes total) emphasized repetitive production of non-meaningful sequences of syllable combinations (Dabul & Bollier, 1976). At the simplest level, participants were required to repetitively produce the same consonant-vowel (C-V) combination (e.g., bah-bah-bah). Over time the C-V combinations were varied (e.g. C1V1-C2V1; C1V1-C1V2; or C1V1-C2V2), increased in length, (e.g. C1 V1-C2V2-C3V3), and increased in complexity to include consonant blends. Participants were required to produce the combinations as fast as they could for 15 seconds at a time, while maintaining accuracy. Integral cuing was provided as needed and gradually decreased as accuracy increased.
In the rapid cued confrontation naming task (30 minutes total), participants were asked to name black-and-white line drawings selected randomly from a core of 200 pictures that included nouns, verbs and adjectives. Semantic and phonological cuing was provided by the trained SLP according to the hierarchy described by Wambaugh (2003). In one 15 minute block, only semantic cuing was provided; in a second 15 minute block, only phonological cuing was provided. The order of the cuing blocks was randomized from day to day.
The other two hours of daily treatment involved computer practice. Sessions were supervised by the trained SLP who remained in the room with the subject and assisted the participants when needed. One hour involved Oral Reading for Language in Aphasia (Cherney, 2010a, 2010b) in which subjects listened to sentences that appeared on the computer screen, pointed to the words as they were said, and then repeatedly attempted to say the sentences, first in unison with the voice on the computer, and then independently. Figure 2 shows sample screens from the ORLA program. The ORLA sentence stimuli allowed practice on a variety of grammatical structures, rather than just one specific grammatical form. There were three levels of difficulty based on length and reading level: level 1 consisted of simple 3–5 word sentences at a first-grade reading level; level 2 consisted of 8–12 words that were either single sentences or 2 short sentences at a third-grade reading level; level 3 consisted of 15–30 words, divided into 2–3 sentences, at a sixth-grade reading level. Participants with severe or moderately severe aphasia worked at level 1; those with moderate aphasia worked at level 2, while those with mild-moderate aphasia worked at level 3.
Figure 2.
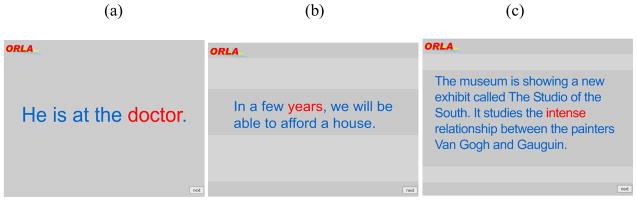
Screen images of the computer-based treatment, Oral Reading for Language in Aphasia (ORLA), showing (a) 3- to 5-word stimulus, (b) 8- to 10-word stimulus, and (c) 15- to 30-word stimulus.
In the third hour, participants used AphasiaScripts™, a software program that has been developed to facilitate script training in a realistic conversational context (Cherney, Halper, Cole & Holland, 2008; Lee, Kaye & Cherney, 2009; Mannheim, Halper & Cherney, 2009). In AphasiaScripts, an avatar programmed to produce natural speech with correct movements of the speech articulators serves as a virtual therapist or conversational partner. Script practice has three practice modes. First, the participant listened to a prerecorded script while it appeared on the screen. Second, each sentence or conversation turn was practiced repeatedly. Third, the conversation was practiced with the virtual therapist while cues were provided depending on the participant’s needs (see Figure 3). These cues included seeing the written word, hearing the therapist’s voice during choral speaking, and watching oral-motor movements of the virtual therapist. Cues were removed over time so that eventually the participant practiced the conversation with the virtual therapist, without cues, as in a real conversation (Cherney et al., 2008). Each week the participants selected two different conversational scripts from a set of 12 standard scripts. Script topics represented everyday conversational topics such as the weather, deciding on dinner plans, an exercise routine at the gym, shopping for a sweater, ordering in a restaurant, and asking getting-to-know-you questions of a new acquaintance.
Figure 3.
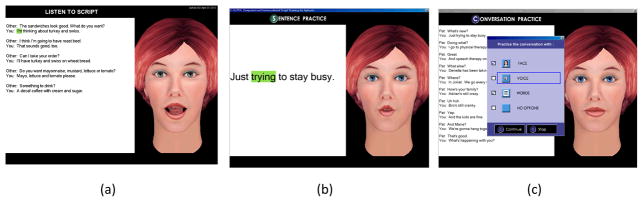
Screens from the AphasiaScripts™ software program showing: a) listening to the whole script; b) sentence practice; c) cues for conversation practice.
Data analysis
The primary endpoint of the study was safety. Safety was assessed by measuring the proportion of study subjects with any of the following outcomes: (1) death, (2) medical morbidity, including myocardial infarction, pneumonia, wound infection, or deep venous thrombosis, (3) clinically definite generalized tonic clonic seizure, or (4) decrement in neurological status, defined as a 20% decrease in performance on the neurological, cognitive, and Box and Block testing.
Additional outcome measures assessed aspects of neurobiological change and therapeutic efficacy. Neurobiological change was assessed by measuring activation changes in the syllable imitation task during fMRI in whole brain, each hemisphere, and two regions of interest, the left ventral premotor cortex including pars opercularis of the inferior frontal gyrus (important for speech production and also the site of stimulation on the left) and the left superior temporal gyrus (relevant for comprehension). Therapeutic efficacy was measured by change in language test scores, as described below.
To answer Question 1 regarding language improvements, the change in test scores during the treatment phase (from baseline to post-treatment) for the 4 participants who received CS/LT was compared with the change in test scores from baseline to post-treatment for the 4 participants receiving LT alone. These comparisons were made for the WAB AQ, the BNT, the caregiver ratings of the CETI, and the discourse measures of CIUs and words/minute. Given the relatively small number of participants, effect sizes were computed. Effect size measures the magnitude of a treatment effect and, unlike significance testing, is independent of sample size (Cohen, 1988). Cohen’s d and confidence intervals for the effect size were calculated for the change in test scores from baseline to post-treatment, using the original means and standard deviations of 2 independent groups (Dunlop, Cortina, Vaslow, & Burke, 1996). The effect sizes were benchmarked against Cohen’s definition of effect size as follows: small, d = 0.2; medium, d = 0.5; and large, d = 0.8.23
To answer Question 2 regarding maintenance, the changes in test scores from baseline to the 6-week follow-up and from baseline to the 12-week follow-up were compared to the change from baseline to post-treatment within and across groups. Effect sizes comparing CS/LT to LT were computed for the WAB AQ, the BNT, the caregiver ratings of the CETI, and the discourse measures of CIUs and words/minute. Comparison of the effect sizes for each interval provides information about the relative maintenance of skills across groups. If skills are maintained similarly, effect sizes would be expected to be stable across all intervals.
Additionally, the three discourse scores obtained at each assessment period allowed an effect size for each individual participant to be computed. Effect sizes for each subject were calculated by dividing the difference between the baseline average and the post-treatment or follow-up average by the standard deviation of the baseline (Beeson & Robey, 2006). The magnitude of the change from baseline to post-treatment and baseline to follow-up across matched pairs of participants provides an “index of durability” (Beeson and Robey, 2006, p. 167) at different time points following the end of treatment. The benchmarks of 4.0, 7.0, and 10.1 for small, medium and large effect sizes were used to aid interpretation - these benchmarks are based on a meta-analysis for lexical retrieval treatment studies (Robey and Beeson, 2005).
Results
Safety and neurobiological change have been addressed previously (Cherney et al., 2010). In summary, there were no adverse events from either the surgery or the therapy that affected the course of therapy or had a long-term impact on patient well-being. Additionally, neurological, cognitive and upper extremity motor function remained stable in all participants, as assessed with the NIH Stroke Scale, the Behavioral Inattention Test and the Box and Blocks Test.
Neurobiologically, for all eight subjects combined, decreases in whole brain activation correlated with increases in positive change on the primary outcome measure, the WAB AQ. The inverse correlation between change on the WAB-AQ from pretreatment to the 12-week follow-up and change in whole brain activation on the syllable imitation task was 0.6159. The ipsilesional left hemisphere showed decreased activation from baseline to post-treatment on all functional MRI tasks, and this decreased more in the investigational group (CS/LT) than in the control group (LT). Different participant pairs did not contribute identically to these values. In general, the participants with mild-moderate aphasia tended to show activation increases, while those with moderate and severe aphasia tended to show activation decreases. These changes differed by brain region and by functional task.
With regard to therapeutic efficacy, Table 4 shows the individual change scores from baseline that were obtained by each participant at each assessment period for the WAB AQ, the Boston Naming Test and the CETI. It also shows the means and standard deviations of the CIU and words/minute scores which were obtained on the discourse tasks by each participant at each assessment period. In the table, participants are ordered by aphasia severity, as determined by the initial WAB-AQ score, to allow for comparisons between matched pairs of investigational and control participants. Table 5 shows the group change scores (means and standard deviations) for the investigational and control groups from baseline for the WAB AQ, the Boston Naming Test, the CETI and the discourse measures.
Table 4.
Change scores from baseline to each assessment period for participants, paired for severity by initial WAB-AQ scores
| Subject | Baseline to Post-treatment | Baseline to 6-week F/Up | Baseline to 12-week F/Up | ||||||||||||
|---|---|---|---|---|---|---|---|---|---|---|---|---|---|---|---|
|
| |||||||||||||||
| WAB AQ | BNT | CETI | CIUs | WPM | WAB AQ | BNT | CETI | CIUs | WPM | WAB AQ | BNT | CETI | CIUs | WPM | |
| Mild-Moderate | |||||||||||||||
| 002 (CS/LT) | 3.45 | −4 | 35.16 | −7.34 | 12.12 | 4.25 | −1 | 40.18 | 20.33 | 5.62 | 3.75 | 2 | 49.62 | 27.33 | −2.41 |
| 016 (LT) | −0.15 | −2 | −3.44 | 23.66 | 12.14 | 2.35 | 1 | 0.94 | 8.33 | 22.15 | 2.45 | 1 | 7.31 | −3.00 | 20.08 |
| Moderate | |||||||||||||||
| 015 (CS/LT) | 7.00 | 9 | 16.22 | 44.66 | 16.28 | 2.50 | 10 | 19.56 | 33.33 | 9.22 | 7.80 | 18 | 15.18 | 44.66 | 6.67 |
| 005 (LT) | 3.95 | 12 | 21.80 | 17.33 | −13.94 | 4.95 | 12 | 33.10 | 14.33 | 13.73 | 8.25 | 11 | 21.00 | 25.66 | −4.96 |
| Moderate-Severe | |||||||||||||||
| 014 (CS/LT) | 6.45 | −9 | Missing data | 5.67 | 9.80 | 14.55 | 1 | 35.52 | 14.00 | 6.24 | 17.35 | −2 | 37.52 | 14.33 | 4.53 |
| 001 (LT) | 11.90 | 6 | −16.06 | 15.34 | 20.31 | 12.20 | 11 | −3.81 | 2.34 | 4.23 | LTF | LTF | LTF | LTF | LTF |
| Severe | |||||||||||||||
| 008 (CS/LT) | 15.00 | 10 | −0.14 | 12.00 | −1.24 | 10.60 | 11 | 23.25 | 13.66 | −2.41 | 20.30 | 15 | 20.75 | 15.00 | −4.30 |
| 012 (LT) | 2.65 | 0 | 41.31 | 1.33 | −23.28 | 2.65 | 0 | 34.94 | 6.67 | −22.74 | −0.50 | 0 | 30.81 | 8.33 | −12.63 |
WAB AQ – Western Aphasia Battery Aphasia Quotient; BNT – Boston Naming Test; CETI – Communicative Effectiveness Index; CIUs – Correct Information Units; WPM – Words per minute; LTF – Lost to followup
Table 5.
Means, Standard Deviations and Effect Size (Cohen’s d) of the Change from Baseline to Post-Treatment and Follow-Up for the Investigational Group (CS/LT) compared with the Control Group (LT)
| Measure | Investigational Group (CS/LT) Mean (SD) | Control Group (LT) Mean (SD) | Effect size Cohen’s d | 95% Confidence interval for effect size | |
|---|---|---|---|---|---|
| Lower | Upper | ||||
| WAB-AQ | |||||
| Baseline – Post Tx | 7.98 (4.94) | 4.59 (5.17) | 0.67 | −0.83 | 2.00 |
| Baseline – 6wk f/up | 7.98 (5.6) | 5.54 (4.6) | 0.48 | −0.99 | 1.81 |
| Baseline – 12wk f/up | 12.3 (7.81) | 3.55 (4.26) | 1.32 | −0.50 | 2.72 |
| BNT | |||||
| Baseline – Post Tx | 1.5 (9.47) | 4.0 (6.32) | −0.31 | −1.66 | 1.12 |
| Baseline – 6wk f/up | 5.25 (6.13) | 6.0 (6.38) | −0.12 | −1.49 | 1.28 |
| Baseline – 12wk f/up | 8.25 (9.74) | 2.0 (6.38) | 0.73 | −0.92 | 2.15 |
| CETI –CG | |||||
| Baseline – Post Tx | 17.08 (17.67) | 10.89 (25.69) | 0.27 | −1.27 | 1.73 |
| Baseline – 6wk f/up | 29.62 (9.8) | 16.28 (20.59) | 0.83 | −0.71 | 2.15 |
| Baseline – 12wk f/up | 30.78 (15.76) | 19.62 (11.69) | 0.78 | −0.88 | 2.19 |
| Discourse: Rate Words/minute | |||||
| Baseline – Post Tx | 9.24 (7.48) | −1.19 (20.7) | 0.67 | −0.83 | 2.00 |
| Baseline – 6wk f/up | 4.67 (4.97) | 4.34 (19.5) | 0.02 | −1.37 | 1.41 |
| Baseline – 12wk f/up | 1.12 (5.3) | 0.83 (17.1) | 0.03 | −1.48 | 1.52 |
| Discourse: Content CIUs | |||||
| Baseline – Post Tx | 13.8 (22.13) | 14.4 (9.42) | −0.04 | −1.42 | 1.35 |
| Baseline – 6wk f/up | 20.3 (9.19) | 7.92 (4.97) | 1.68 | −0.10 | 3.02 |
| Baseline – 12wk f/up | 25.3 (14.21) | 10.3 (14.43) | 1.05 | −0.68 | 2.45 |
Note: Large and moderate effect sizes are in bold. CS/LT = cortical stimulation with language therapy; LT = language therapy; WAB = Western Aphasia Battery; AQ = Aphasia Quotient; BNT = Boston Naming Test; CETI CG = Communicative Effectiveness Index completed by caregiver; CIUs = correct information units. Post Tx = Post-Treatment; F/up = Follow-up
Therapeutic Efficacy: Group and Individual Data
Group and individual test data for the WAB AQ, the primary outcome measure, has been reported previously (Cherney et al., 2010). Three of the four investigational participants showed a WAB-AQ change from baseline to post-treatment that was greater than that of the matched control participant (see Table 4). Investigational participants from least impaired to most impaired had increases of 3.45, 7.0, 6.45 and 15.0 points; matched control participants had changes of −0.15, 3.95, 11.9, and 2.65 points. At the 12-week follow-up, the most severe participant in the investigational group had an increase of 20.3 points. In comparison, a negative change of −0.5 was shown for the most severe participant in the control group. Although neither the investigational or control participants with mild-moderate aphasia achieved a 5-point change on the WAB-AQ, the investigational participant had greater changes at all time points (Cherney et al., 2010).
Only group data for the CETI has been reported previously. The mean change from baseline to each of the assessment periods was greater for the investigational group than for the control group at all time points (Cherney et al., 2010). Inspection of the individual participant data provided in Table 4 shows that the participant pair with mild-moderate aphasia differed the greatest in CETI change scores. At post-treatment, the CETI change score from baseline was 35.16 points for the investigational participant (002) compared to −3.44 for the control participant (016); at the 12-week follow-up, the CETI change score for the investigational participant was 49.62 compared to only 7.31 for the control participant.
For the BNT, investigational group changes (Table 5) were 1.5, 5.25 and 8.25 points at post-treatment, 6-weeks, and 12-weeks respectively. Respective control group changes were 4.0, 6.0 and 2.0 points. Inspection of individual scores (Table 4) shows that neither of the participants with mild-moderate aphasia made much change from baseline to any time point. Both participants with moderate aphasia improved from baseline to post-treatment and follow-up; the investigational subject (015) improved 18 points while the control subject improved 11 points at the 12-week follow-up. However, although matched for severity on the WAB AQ, there was a large difference in their BNT baseline scores (i.e. 35 for the investigational participant and 7 for the control participant). Conversely, the severe participants with aphasia were evenly matched at baseline on the BNT with a score of zero each. The investigational participant improved 15 points by the 12-week follow-up, while the control participant made no change and remained with a score of zero.
Performance on the picture description tasks yielded different patterns of change for informational content (CIUs) and rate (words/minute) as shown in Table 5. The mean change for the investigational group for words/minute was 9.24, 4.67 and 1.12 compared to −1.19, 4.34 and 0.83 for the control group at post-treatment, 6-weeks, and 12-weeks. Therefore, only at the post-treatment assessment, did there appear to be much difference between the two groups. In contrast, for CIUs, the mean improvement from baseline to post-treatment was similar for both groups (13.8 for investigational participants and 14.4 for control participants). However, by the 6 and 12 week follow-ups, the mean improvements demonstrated by participants in the investigational group were greater than for the control group (20.3 versus 7.92 at 6-weeks; 25.3 versus 10.3 at 12 weeks).
Therapeutic Efficacy: Effect Sizes
Regarding language improvements (Question 1), effect sizes for the treatment phase (from baseline to post-treatment) for the 4 participants who received CS/LT were computed and compared to the effect sizes from baseline to post-treatment for the 4 participants receiving LT alone. Effect sizes are shown in Table 5. Effect sizes that are positive indicate that the change by the investigational group was larger than the change by the control group. At post-treatment, moderate positive effect sizes are evident for the primary outcome measure, the WAB AQ (d=0.67) and for words/minute (d=0.67).
Regarding maintenance of language improvements (Question 2), effect sizes from baseline to the 6-week follow-up and from baseline to the 12-week follow-up for the CS/LT group were computed and compared to those of the LT group. Large positive effect sizes were obtained for the WAB AQ at the 12 week follow-up and for CIUs at both the 6 and 12 week follow-ups. Moderate positive effect sizes were obtained for the BNT at the 12 week follow-up, and for the CETI at both the 6-week and 12-week follow-ups.
It is interesting to note that for the WAB AQ, BNT, CETI, and CIU discourse measure, the effect size between baseline and 12- weeks was larger than the effect size between baseline and post-treatment. To interpret the widening difference between the groups, the raw data previously presented in Table 4 were reviewed to determine if the increasing difference in effect sizes over time resulted primarily from continued improvements in the intervention group (CS/LT) or a decline in the control group (LT). While there was some variability, for the most part, the increase in effect size at the 12-week follow-up represents continued improvements by the investigational subjects following the cessation of treatment.
Tables 6 and 7 include the effect sizes for each individual participant from baseline to post-treatment and follow-up for the measures of CIUs and words/minute. For CIUs, all effect sizes are larger for the investigational than for the control participant within the matched pair except for the baseline to post-treatment period for the participants with mild-moderate aphasia. The large effect size at all assessment periods for the investigational participant with a moderate aphasia (015) is notable. For words/minute, effect sizes for individual participants are generally small. It is interesting, though, that some effect sizes are negative indicating that the change from baseline was a decrease in rate rather than an increase in rate. This is seen consistently in both participants with severe aphasia. Additionally, for the control participant with moderate aphasia (005) and the investigational participant with mild-moderate aphasia (002), rate increases or decreases are seen at different assessment periods.
Table 6.
Effect Sizes for Correct Information Units (CIUs) Computed for Each Individual Participant
| BL to post Tx | BL to 6-week f/up | BL to 12-week f/up | |
|---|---|---|---|
| Mild-moderate | |||
| 002 (CS/LT) | −0.64 | 1.79 | 2.43 |
| 016 (LT) | 2.78 | 0.98 | −0.35 |
| Moderate | |||
| 015 (CS/LT) | 77.36 | 57.74 | 77.36 |
| 005 (LT) | 1.58 | 1.31 | 2.34 |
| Moderate-severe | |||
| 014 (CS/LT) | 2.14 | 5.29 | 5.42 |
| 001 (LT) | 1.66 | 0.25 | Lost to f/up |
| Severe | |||
| 008 (CS/LT) | 7.86 | 8.95 | 9.82 |
| 012 (LT) | 1.33 | 6.67 | 8.33 |
BL = baseline;
Effect sizes calculated by dividing the difference between the baseline average and the post-treatment or follow-up average by the standard deviation of the baseline (Beeson & Robey, 2006).
Table 7.
Effect Sizes for Word/Minute Computed for Each Individual Participant
| BL to post Tx | BL to 6-week f/up | BL to 12-week f/up | |
|---|---|---|---|
| Mild-moderate | |||
| 002 (CS/LT) | 2.69 | 1.25 | −0.53 |
| 016 (LT) | 2.01 | 3.66 | 3.32 |
| Moderate | |||
| 015 (CS/LT) | 6.39 | 3.62 | 2.62 |
| 005 (LT) | −22.81 | 22.61 | −8.17 |
| Moderate-severe | |||
| 014 (CS/LT) | 4.04 | 2.57 | 1.87 |
| 001 (LT) | 1.84 | 0.38 | Lost to f/up |
| Severe | |||
| 008 (CS/LT) | −0.13 | −0.25 | −0.44 |
| 012 (LT) | −1.06 | −1.04 | −0.58 |
BL = baseline;
Effect sizes calculated by dividing the difference between the baseline average and the post-treatment or follow-up average by the standard deviation of the baseline (Beeson & Robey, 2006).
Discussion
This article reports on findings from a safety and feasibility study that evaluated the effects of epidural CS/LT compared to LT in individuals with chronic post-stroke aphasia. Previous reports from this same study indicated that excitatory ipsilesional epidural CS is a potentially safe and feasible adjuvant intervention for individuals with chronic nonfluent aphasia from a single left hemisphere ischemic infarct that spares ventral premotor cortex (Cherney et al., 2010). In this article we have provided new data about behavioral outcomes that support previous findings regarding therapeutic efficacy of CS/LT compared to LT. The effect size for the primary outcome measure, the WAB AQ, was benchmarked as moderate from baseline to immediately post-treatment and large from baseline to the 12-week follow up. For the secondary outcomes measures, a moderate effect size was obtained for rate of speech on a picture description task immediately post-treatment. At the 12-week follow-up, effect sizes were benchmarked as large for correct information units on the picture description task and moderate for the BNT and the CETI. An analysis of effect sizes for individual subject pairs on the discourse measures revealed effect sizes that were typically larger for the investigational subject receiving CS/LT as compared to the control subject receiving LT alone.
Consistent with findings from the phase 2 motor study is the persistence of the treatment effect in the CS/LT group, with continued improvements on some measures for at least 3 months post-treatment. The mechanisms of recovery following CS are not well understood. However, the evidence suggests that enhanced neural plasticity with more robust long-term learning and reorganization of neural circuits plays a role in the improvements in language function associated with the delivery of CS/LT (Hummel et al., 2008). Future research is required to investigate the neurophysiological mechanisms underlying behavioral change, including long-term potentiation (LTP) changes in synaptic efficacy and the role of glutamate-ergic and GABA-ergic intracortical networks as mechanisms of facilitating neuronal plasticity (Hummel et al., 2008).
Limitations of this study have been discussed previously. They include the absence of a sham stimulation arm, the small sample size that precludes significance testing, and differences in participant pairs on variables that potentially may impact therapy outcome such as chronicity, age, lesion location and lesion size (Cherney et al., 2010). Nevertheless, given these suggestive findings, the next logical steps in the typical progression of clinical research investigating the efficacy of epidural cortical stimulation would include a larger study with more participants, additional behavioral and imaging measures, and a sham stimulation arm. Within a larger study, examination of subject variables that characterize good and poor responders is warranted with the intent of identifying those subjects who may be most suitable for epidural CS/LT.
However, interpretation of study results and decisions regarding future research should be made in light of the failed Phase 3 motor study. We still believe that epidural cortical stimulation combined with language therapy holds promise as an adjuvant to behavioral speech and language treatment to improve language outcome. However, continued investigation of epidural CS and language training in post-stroke aphasia should be guided by the same considerations that are given to future research with CS and motor training (Plow et al., 2009). Importantly, a series of carefully planned experimental studies that examine criteria for customizing procedures to individual profiles to optimize outcomes may best serve future investigations of epidural CS/LT. Therapeutic parameters that warrant investigation include stimulation montage (monopolar versus bipolar), electrode polarity, local versus diffuse contacts of the electrodes, and the implications of these choices for stimulation within a given region of the cortex. Additionally, information emerging from research on non-invasive methods of cortical stimulation in combination with language treatment, such as stimulation site localization and stimulus parameters, may inform future studies of epidural CS.
Acknowledgments
Preparation of this manuscript was supported by Grant 5R21DC9876 (to LRC) from the National Institute on Deafness and Other Communication Disorders. The authors acknowledge the support of Northstar Neuroscience, who funded this study. The authors note that they have not had any other financial relationship with Northstar Neuroscience, and did not receive any personal compensation from the company.
Contributor Information
Leora R. Cherney, Rehabilitation Institute of Chicago, Chicago, IL, USA
Richard L. Harvey, Rehabilitation Institute of Chicago, Chicago, IL, USA
Edna M. Babbitt, Rehabilitation Institute of Chicago, Chicago, IL, USA
Rosalind Hurwitz, Rehabilitation Institute of Chicago, Chicago, IL, USA.
Rosalind C. Kaye, Rehabilitation Institute of Chicago, Chicago, IL, USA
Jaime B. Lee, Rehabilitation Institute of Chicago, Chicago, IL, USA
Steven. L. Small, University of California, Irvine, CA, USA
References
- Adkins-Muir DL, Jones TA. Cortical electrical stimulation combined with rehabilitative training: enhanced functional recovery and dendritic plasticity following focal cortical ischemia in rats. Neurological Research. 2003;25:780–788. doi: 10.1179/016164103771953853. [DOI] [PubMed] [Google Scholar]
- Adkins DL, Campos P, Quach D, Borromeo M, Schallert K, Jones TA. Epidural cortical stimulation enhances motor function after sensorimotor cortical infarcts in rats. Experimental Neurology. 2006;200:356–370. doi: 10.1016/j.expneurol.2006.02.131. [DOI] [PubMed] [Google Scholar]
- Adkins DL, Hsu JE, Jones TA. Motor cortical stimulation promotes synaptic plasticity and behavioral improvements following sensorimotor cortex lesions. Experimental Neurology. 2008;212:14–28. doi: 10.1016/j.expneurol.2008.01.031. [DOI] [PMC free article] [PubMed] [Google Scholar]
- Albert ML. Treatment of aphasia. Archives of Neurology. 1998;55:1417–1419. doi: 10.1001/archneur.55.11.1417. [DOI] [PubMed] [Google Scholar]
- Beeson P, Robey R. Evaluating single-subject treatment research: Lessons learned from the aphasia literature. Neuropsychological Review. 2006;16:161–169. doi: 10.1007/s11065-006-9013-7. [DOI] [PMC free article] [PubMed] [Google Scholar]
- Bezard E, Boraud T, Nguyen JP, Velasco F, Keravel Y, Gross C. Cortical stimulation and epileptic seizure: a study of the potential risk in primates. Neurosurgery. 1999;45:346–350. doi: 10.1097/00006123-199908000-00030. [DOI] [PubMed] [Google Scholar]
- Boychuk JA, Adkins DL, Kleim JA. Distributed versus focal cortical stimulation to enhance motor function and motor map plasticity in a rodent model of ischemia. Neurorehabilitation and Neural Repair. 2011;25:88–97. doi: 10.1177/1545968310385126. [DOI] [PubMed] [Google Scholar]
- Brown JA, Lutsep HL, Weinand M, Cramer SC. Motor cortex stimulation for the enhancement of recovery from stroke: a prospective, multicenter safety study. Neurosurgery. 2006;58:464–473. doi: 10.1227/01.NEU.0000197100.63931.04. [DOI] [PubMed] [Google Scholar]
- Brown JA, Lutsep H, Cramer SC, Weinand M. Motor cortex stimulation for enhancement of recovery after stroke: case report. Neurological Research. 2003;25(8):815–818. doi: 10.1179/016164103771953907. [DOI] [PubMed] [Google Scholar]
- Bütefisch CM, Netz J, Wessling M, Seitz RJ, Hömberg V. Remote changes in cortical excitability after stroke. Brain. 2003;126(Pt 2):470–481. doi: 10.1093/brain/awg044. [DOI] [PubMed] [Google Scholar]
- Canavero S, Bonicalzi V, Intonti S, Crasto S, Castellano G. Effects of Bilateral Extradural Cortical Stimulation for Plegic Stroke Rehabilitation. Neuromodulation. 2006;9(1):28–33. doi: 10.1111/j.1525-1403.2006.00039.x. [DOI] [PubMed] [Google Scholar]
- Cherney LR. Oral Reading for Language in Aphasia (ORLA): Impact of Aphasia Severity on Cross-Modal Outcomes in Chronic Nonfluent Aphasia. Seminars in Speech-Language Pathology. 2010;31:42–51. doi: 10.1055/s-0029-1244952. [DOI] [PubMed] [Google Scholar]
- Cherney LR. Oral Reading for Language in Aphasia (ORLA): Evaluating the Efficacy of Computer-Delivered Therapy in Chronic Nonfluent Aphasia. Topics in Stroke Rehabilitation. 2010;17(6):423–431. doi: 10.1310/tsr1706-423. [DOI] [PubMed] [Google Scholar]
- Cherney LR, Erickson RK, Small SL. Epidural Cortical Stimulation as Adjunctive Treatment for Non-Fluent Aphasia: Preliminary Findings. Journal of Neurology, Neurosurgery, and Psychiatry. 2010;81(9):1014–1021. doi: 10.1136/jnnp.2009.184036. [DOI] [PubMed] [Google Scholar]
- Cherney LR, Halper AS, Holland AL, Cole R. Computerized Script Training for Aphasia: Preliminary Results. American Journal of Speech-Language Pathology. 2008;17:19–34. doi: 10.1044/1058-0360(2008/003). [DOI] [PMC free article] [PubMed] [Google Scholar]
- Cherney LR, Robey RR. Aphasia Treatment: Recovery, Prognosis, and Clinical Effectiveness. In: Chapey R, editor. Language Intervention Strategies in Aphasia and Related Neurogenic Communication Disorders. 5. Philadelphia: Lippincott, Williams & Wilkins; 2008. pp. 186–202. [Google Scholar]
- Cohen J. Statistical power analysis for the behavioral sciences. 2. Hillsdale, NJ: Lawrence Earlbaum Associates; 1988. [Google Scholar]
- Dabul B, Bollier B. Therapeutic approaches to apraxia. Journal of Speech and Hearing Disorders. 1976;41:268–276. doi: 10.1044/jshd.4102.268. [DOI] [PubMed] [Google Scholar]
- Desrosiers J, Bravo G, Hebert R, Dutil E, Mercier L. Validation of the Box and Block Test as a measure of dexterity of elderly people: reliability, validity, and norms studies. Archives of Physical Medicine & Rehabilitation. 1994;75:751–755. [PubMed] [Google Scholar]
- Dobkin BH. Neurobiology of rehabilitation. Annals of the New York Academy of Science. 2004;1038:148–170. doi: 10.1196/annals.1315.024. [DOI] [PMC free article] [PubMed] [Google Scholar]
- Dunlop WP, Cortina JM, Vaslow JB, Burke MJ. Meta-analysis of experiments with matched groups or repeated measures designs. Psychological Methods. 1996;1:170–177. [Google Scholar]
- Feeney DM, Gonzalez A, Law WA. Amphetamine, haloperidol, and experience interact to affect rate of recovery after motor cortex injury. Science. 1982;217:855–857. doi: 10.1126/science.7100929. [DOI] [PubMed] [Google Scholar]
- Fregni F, Pascual-Leone A. Technology Insight: noninvasive brain stimulation in neurology—perspectives on the therapeutic potential of rTMS and tDCS. Nature Clinical Practice Neurology. 2007;3:383–393. doi: 10.1038/ncpneuro0530. [DOI] [PubMed] [Google Scholar]
- Goldstein LB, Bertels C, Davis JN. Interrater reliability of the NIH stroke scale. Archives of Neurology. 1989;46:660–662. doi: 10.1001/archneur.1989.00520420080026. [DOI] [PubMed] [Google Scholar]
- Harvey RL, Nudo RJ. Cortical Brain Stimulation: A Potential Therapeutic Agent for Upper Limb Motor Recovery following Stroke. Topics in Stroke Rehabilitation. 2007;14(6):54–67. doi: 10.1310/tsr1406-54. [DOI] [PubMed] [Google Scholar]
- Harvey RL, Winstein CJ. Design for the Everest Randomized Trial of Cortical Stimulation and Rehabilitation for Arm Function Following Stroke. Neurorehabilitation and Neural Repair. 2009;23(1):32–44. doi: 10.1177/1545968308317532. [DOI] [PubMed] [Google Scholar]
- Holland AL, Fromm DS, DeRuyter F, Stein M. Treatment efficacy: Aphasia. Journal of Speech and Hearing Research. 1996;39:S27–S36. doi: 10.1044/jshr.3905.s27. [DOI] [PubMed] [Google Scholar]
- Hummel FC, Celnik P, Pascual-Leone A, Fregni F, Byblow WD, Buetefisch CM, Rothwell J, Cohen LG, Gerloff C. Controversy: Noninvasive and invasive cortical stimulation show efficacy in treating stroke patients. Brain Stimulation. 2008;1:370–382. doi: 10.1016/j.brs.2008.09.003. [DOI] [PubMed] [Google Scholar]
- Huang M, Harvey RL, Stoykov ME, Ruland S, Weinand M, Lowry D, Levy R. Cortical Stimulation for Upper Limb Recovery Following Ischemic Stroke: A Small Phase II Pilot Study of a Fully Implanted Stimulator. Topics in Stroke Rehabilitation. 2008;15(2):160–172. doi: 10.1310/tsr1502-160. [DOI] [PubMed] [Google Scholar]
- Kaplan E, Goodglass H, Weintraub S. The Boston Naming Test. Philadelphia, PA: Lippincott, Williams & Wilkins; 2001. [Google Scholar]
- Kertesz A. The Western Aphasia Battery. New York: Grune and Stratton; 1982. [Google Scholar]
- Kim HI, Shin YI, Moon SK, Chung GH, Lee MC, Kim HG. Unipolar and continuous cortical stimulation to enhance motor and language deficit in patients with chronic stroke: report of 2 cases. Surgical Neurology. 2008;69(1):77–80. doi: 10.1016/j.surneu.2006.12.055. [DOI] [PubMed] [Google Scholar]
- Kleim JA, Bruneau R, VandenBerg P, MacDonald R, Mulrooney R, Pocock D. Motor cortex stimulation enhances motor recovery and reduces peri-infarct dysfunction following ischemic insult. Neurological Research. 2003;25:789–793. doi: 10.1179/016164103771953862. [DOI] [PubMed] [Google Scholar]
- Lee JB, Kaye RC, Cherney LR. Conversational script performance in adults with non-fluent aphasia: Treatment intensity and aphasia severity. Aphasiology. 2009;23(7):885–897. [Google Scholar]
- Lefaucheur JP. Methods of therapeutic cortical stimulation. Clinical Neurophysiology. 2009;39:1–14. doi: 10.1016/j.neucli.2008.11.001. [DOI] [PubMed] [Google Scholar]
- Levy R, Ruland S, Weinand M, Lowry D, Dafer R, Bakay R. Cortical stimulation for the rehabilitation of patients with hemiparetic stroke: A multicenter feasibility study of safety and efficacy. Journal of Neurosurgery. 2008;108:707–714. doi: 10.3171/JNS/2008/108/4/0707. [DOI] [PubMed] [Google Scholar]
- Lomas J, Pickard L, Bester S, Elbard H, Finlayson A, Zoghaib C. The Communicative Effectiveness Index: Development and psychometric evaluation of a functional communication measure for adult aphasia. Journal of Speech and Hearing Disorders. 1989;54:113–124. doi: 10.1044/jshd.5401.113. [DOI] [PubMed] [Google Scholar]
- Mannheim L, Halper AS, Cherney LR. Patient-Reported Changes in Communication after Computer-Based Script Training for Aphasia. Archives of Physical Medicine and Rehabilitation. 2009;90(4):623–627. doi: 10.1016/j.apmr.2008.10.022. [DOI] [PubMed] [Google Scholar]
- Nicholas LE, Brookshire RH. A system for quantifying the informativeness and efficiency of connected speech of adults with aphasia. Journal of Speech and Hearing Research. 1993;36:338–350. doi: 10.1044/jshr.3602.338. [DOI] [PubMed] [Google Scholar]
- Noll DC, Cohen JD, Meyer CH, Schneider W. Spiral K-space MR imaging of cortical activation. Journal of Magnetic Resonance Imaging. 1995;5(1):49–56. doi: 10.1002/jmri.1880050112. [DOI] [PubMed] [Google Scholar]
- Oldfield RC. The assessment and analysis of handedness: the Edinburgh inventory. Neuropsychologia. 1971;9(1):97–113. doi: 10.1016/0028-3932(71)90067-4. [DOI] [PubMed] [Google Scholar]
- Plautz EJ, Barbay S, Frost SB, Friel KM, Dancause N, Zoubina EV, et al. Post-infarct cortical plasticity and behavioral recovery using concurrent cortical stimulation and rehabilitative training: A feasibility study in primates. Neurological Research. 2003;25:801–810. doi: 10.1179/016164103771953880. [DOI] [PubMed] [Google Scholar]
- Plautz EJ, Nudo RJ. Neural plasticity and functional recovery following cortical ischemic injury. Proceedings of the IEEE, Engineering in Medicine and Biology 27th Annual Conference; Shanghai, China. 2005. [DOI] [PubMed] [Google Scholar]
- Plow EB, Carey JR, Nudo RJ, Pascual-Leone A. Invasive cortical stimulation to promote recovery of function after stroke: A critical appraisal. Stroke. 2009;40:1926–1931. doi: 10.1161/STROKEAHA.108.540823. [DOI] [PMC free article] [PubMed] [Google Scholar]
- Radloff LS. The CES-D Scale: A self-report depression scale for research in the general population. Applied Psychological Measurement. 1977;3:385–401. [Google Scholar]
- Robey RR. The efficacy of treatment for aphasic persons: a meta-analysis. Brain and Language. 1994;47:582–608. doi: 10.1006/brln.1994.1060. [DOI] [PubMed] [Google Scholar]
- Robey RR. A meta-analysis of clinical outcomes in the treatment of aphasia. Journal of Speech Language Hearing Research. 1998;41:172–187. doi: 10.1044/jslhr.4101.172. [DOI] [PubMed] [Google Scholar]
- Rosen HJ, Petersen SE, Linenweber MR, Snyder AZ, White DA, Chapman L, Dromerick AW, Fiez JA, Corbetta MD. Neural correlates of recovery from aphasia after damage to left inferior frontal cortex. Neurology. 2000;55(12):1883–1894. doi: 10.1212/wnl.55.12.1883. [DOI] [PubMed] [Google Scholar]
- Shinar D, Gross CR, Price TR, Banko M, Bolduc PL, Robinson RG. Screening for depression in Stroke Patients: The reliability and validity of the Center for Epidemiologic Studies Depression Scale. Stroke. 1986;17:241–245. doi: 10.1161/01.str.17.2.241. [DOI] [PubMed] [Google Scholar]
- Small SL. Biological Approaches to the Treatment of Aphasia. In: Hillis A, editor. Handbook on Adult Language Disorders: Integrating Cognitive Neuropsychology, Neurology, and Rehabilitation. Philadelphia, PA: Psychology Press; 2002. pp. 397–411. [Google Scholar]
- Small SL. The Biology of Aphasia Rehabilitation: Pharmacological Perspectives. Aphasiology. 2004;18 (5/6/7):473–492. [Google Scholar]
- Talelli P, Rothwell J. Does brain stimulation after stroke have a future? Current Opinions in Neurology. 2006;19:543–550. doi: 10.1097/WCO.0b013e32801080d1. [DOI] [PubMed] [Google Scholar]
- Teskey GC, Flynn C, Goertzen CD, Monfils MH, Young NA. Cortical stimulation improves skilled forelimb use following a focal ischemic infarct in the rat. Neurological Research. 2003;25:794–800. doi: 10.1179/016164103771953871. [DOI] [PubMed] [Google Scholar]
- Wambaugh JL. A comparison of the relative effects of phonologic and semantic cuing treatments. Aphasiology. 2003;17:433–441. [Google Scholar]
- Wilson B, Cockburn J, Halligan P. Development of a behavioral test of visuospatial neglect. Archives of Physical Medicine & Rehabilitation. 1987;68:98–102. [PubMed] [Google Scholar]