Abstract
The “classical” view on wave propagation is that propagating waves are possible in both directions along the length of the basilar membrane and that they have identical properties. Results of several recently executed experiments [T. Ren, Nat. Neurosci. 2, 333–334 (2004) and W. X. He, A. L. Nuttall, and T. Ren, Hear. Res., 228, 112–122 (2007)] appear to contradict this view. In the current work measurements were made of the velocity of the guinea-pig basilar membrane (BM). Distortion products (DPs) were produced by presenting two primary tones, with frequencies below the characteristic frequency f0 of the BM location at which the BM measurements were made, with a constant frequency ratio. In each experiment the phase of the principal DP, with frequency 2f1−f2, was recorded as a function of the DP frequency. The results indicate that the DP wave going from the two-tone interaction region toward the stapes is not everywhere traveling in the reverse direction, but also in the forward direction. The extent of the region in which the forward wave occurs appears larger than is accounted for by classical theory. This property has been termed “inverted direction of wave propagation.” The results of this study confirm the wave propagation findings of other authors. The experimental data are compared to theoretical predictions for a classical three-dimensional model of the cochlea that is based on noise-response data of the same animal. Possible physical mechanisms underlying the findings are discussed.
I. INTRODUCTION
Ever since otoacoustic emissions were detected (Kemp, 1978), particular attention has been given to reverse traveling waves in the cochlea. This became more relevant when distortion product otoacoustic emissions—where more parameters are involved—were studied in detail. Many authors have held the view that the round-trip delay of such distortion products (DPs) is composed of a forward and a backward delay, and can approximately be decomposed into two almost equal parts (among others, Goodman et al., 2004; Shera and Guinan, 1999; Kalluri and Shera, 2001). Recently, findings by Ren (2004a, b) and Ren et al. (2006) have cast doubt on this opinion. For these studies measurements of DPs were made in the gerbil at several locations along the basal part of the basilar membrane. Unexpectedly, reverse traveling DP waves could not be detected over the entire basilar-membrane (BM) region between the presumed source of the DP and the stapes that these authors were able to inspect. In contrast, in part of this region a forward instead of a reverse traveling wave was found. We propose to call this phenomenon “inverted direction of wave propagation” (IDWP), and will consider it against the background of “classical” cochlear mechanics. Moreover, others have provided a new interpretation of the existing round-trip data (Ruggero, 2004; Siegel et al., 2005). A possible explanation of the findings, in terms of compression waves, was advanced (Ren, 2004a, b, 2006) but this idea has been criticized (Shera, 2006; de Boer and Nuttall, 2006a; Shera et al. 2007).
In this paper we describe a set of experiments directed at clarifying the question of wave travel of DPs in the cochlea. In particular, we want to answer the question whether or not there exists an inverted direction of wave propagation as it has been reported by Ren and associates when an experiment is performed with a different experimental technique and in a different animal model. Our basic experiment consisted of presenting two pure tones, with frequencies f1 and f2, to the cochlea of a guinea pig and measuring the DP at a fixed location L0 of the BM, whereby the frequencies f1 and f2 were varied with a constant frequency ratio. In contrast to Ren (2004a, b, 2006), we did not keep the frequencies constant while varying the position of observation, but we used a fixed observation point and varied the tone frequencies. Viewed in terms of location along the length of the basilar membrane (BM), the tone pair is moving along the BM with a constant separation—this corresponds to the constant frequency ratio because of the tacitly assumed logarithmic scaling of frequency to location. Our measurement technique is similar to the technique that we have employed to study the Allen–Fahey puzzle (Allen and Fahey, 1992, de Boer et al., 2005). The main difference is that all frequencies involved are lower than the best frequency (BF) of the location L0 at which we measure BM velocity. A further difference is that we concentrate on the phase of the DP component in the BM response instead of the amplitude.
Results of the experiments unequivocally demonstrate that between the f2 site and the stapes there exists a region where the direction of wave travel is inverted, i.e., where there is a forward and not a reverse traveling wave. As stated above, we have termed this property inverted direction of wave propagation, abbreviated: IDWP. We also show theoretical predictions on DP wave travel for a linear cochlear model based on noise-response data. Computation is performed in analogy to earlier work (de Boer et al., 2007), except that we now compare predictions and data from the same animal, and we selected tone frequencies below the BF of the measurement location L0. Prediction and data clearly diverge and IDWP, in the form of an extended range of a forward wave, is evident. This more theoretical topic is briefly expanded upon.
II. EXPERIMENTAL TECHNIQUES
We have performed our experiments in guinea pigs. The protocols of the experiments described in this paper were approved by the Committee on the Use and Care of Animals, Oregon Health & Science University. Details about experimental animals and surgical techniques have been described in several previous publications (e.g., Nuttall et al., 1991, 2004; de Boer and Nuttall, 2000). We give a shortened description here, but focus on the new aspects of our present series of experiments.
The experimental animal was deeply anesthetized, the bulla was opened and a small opening was made in the firstturn scala tympani wall of the cochlea. Glass beads (~20 µm diameter and gold coated) were dropped through this opening upon the basilar membrane (BM). The laser beam of a Doppler velocimeter (Polytec Corp. OFV 1102) was focused on one of the beads, and produced a signal representing the bead’s motion. Two miniature condenser microphones were used as loudspeakers for the two primary tones; they were embedded in a plastic coupler placed in the external ear canal of the experimental animal. Stimulus generation and data acquisition were performed by a custommade computer program based on LABVIEW© software and TDT© hardware (this is the main difference between the instrumentation of these and earlier experiments). Each of the two tones was sent to one of the loudspeakers. We ensured that the system’s intermodulation distortion was well below the cochlear DP level.
In order to obtain a database on frequency selectivity and nonlinearity of the animal under study, responses were obtained for stimuli consisting of noise signals with various bandwidths and various levels. Composite-spectrum files were constructed and served as bases for computations to be described further on. At the spectral level of 20 dB per octave the best frequencies (BFs) of the animals for this study ranged between 17 and 21 kHz. During experiments the sensitivity of the experimental animal was checked from time to time. Hearing losses at the BF due to surgery varied from 1 to 15 dB (8.4 ± 5.5 dB, mean ± SD, n=8) among animals. During data acquisition, significant deterioration of sensitivity (i.e., Compound Action Potential (CAP) threshold elevation greater than 10 dB near the BF) was not observed in this study.
Tone pairs were chosen so that both frequencies, f1 and f2, were below the frequency f0, which is the estimated BF of the measurement location L0. In that way we can consider L0 as a “station on the way” of the DP wave from its generation site to the stapes. By varying the pair of frequencies we can observe different parts of that DP wave. We limit our discussion here to the DP with frequency 2f1−f2. For the interpretation it is important that for every frequency the phase of each of the primary tones at the peak of its response is assumed to be (nearly) constant with respect to the phase at the stapes. Locally, the DP is thus also generated with (nearly) constant phase. Note that this property is another expression of “scaling symmetry” of which the projection of log frequency to location is the basic property.
In closing this section, we describe the physical signals used in this work and the process of data analysis. Stimulus signals were generated with a sample frequency of 200 kHz, the stationary parts had a duration of 100 ms and were preceded and followed by the same signals with gradual onset and offset envelopes lasting 5 ms. The full 100 ms of stimulus and response signals, signal onset and offset excluded, in total comprising 20 000 data samples, was used for data analysis. By making all frequencies integral multiples of 10 Hz we ensured that the 100 ms interval always contained an integral number of periods. The stimuli were repeated 400 times and the waveform of the response was averaged over these repetitions. Fourier transformation of the recorded waveform yielded the corresponding spectrum.
In the processing of the data we have to correct for the delay inherent in the onset period (1000 time samples, equivalent to 5.0 ms) and for the delay from transducer to stapes (in time approximately 180 (s). When we use the symbol τ for the onset delay of 5.0 ms, we have to compensate for phase delays of Θ1=2πf1τ, and Θ2=2πf2τ radians, respectively, for the two frequencies f1 and f2. This constitutes a straightforward and invariant correction. Compensation for the travel time from transducer to stapes is based on the cross-correlation spectrum from transducer to stapes as measured with a broad-band noise stimulus signal, for every animal individually, and sampled at the frequencies f1 and f2. These phase shifts were included in the phase values Θ1 and Θ2. From considering third-order nonlinear distortion as giving rise to the DP with frequency 2f1−f2 it follows that we have to compensate the observed DP response for a phase shift of 2 Θ1−Θ2.
III. A ROOM WITH A VIEW
Before turning to the actual results obtained, let us briefly discuss the ways we can look at data. Figure 1(A) shows the frequency response of the cochlea in stylized form. Amplitude and phase of the velocity of the BM are imagined to be measured at a fixed location (L0) for a sinusoidal stimulus, and are plotted as a function of frequency f. The frequency scale is chosen to be logarithmic. The amplitude (assumed to be plotted logarithmically) grows, first slowly and then more rapidly, toward a peak and rapidly decreases thereafter. The frequency corresponding to the peak will be referred to as the BF (best frequency). The stimulus is assumed to be presented at the stapes with zero phase. The response phase (plotted linearly) has a monotonic course, starting at a value close to +π/2, the lag increasing with frequency (the phase becoming more negative). Consider next the response for a fixed frequency plotted as a function of cochlear location x, i.e., the distance to the stapes measured along the length of the BM. The “cochlear pattern” as we call it, is shown in Fig. 1(B) in the location domain. The abscissa scale is linear rather than logarithmic and in this form the two graphics resemble one another very much. This is due to the property of scaling symmetry referred to in the previous section.1 In what follows we will have occasion to refer to these two representations.
FIG. 1.
Panel A: Frequency response, the response of the cochlea measured at one location (L0) as a function of (log) frequency. Panel B: Cochlear pattern, the response for one frequency (f0) as a function of location × (distance from the stapes). Solid curves: amplitude plotted logarithmically, dashed curves: phase plotted linearly.
How do these figures vary when we consider variations of parameters? Suppose we consider the frequency response at a location closer to the stapes. The response as shown by Fig. 1(A) will move to the right, the BF is higher. In contrast, when we look at the cochlear pattern and increase the frequency, the pattern of Fig. 1(B) will shift to the left. Such considerations are useful for the interpretation of various conditions.
Actual data are collected in the view of Fig. 1(A), with frequency as abscissa. It is useful to realize that a forward traveling wave has the same phase course in the two views: a phase lag that is increasing (phase becoming more negative) when we move to the right in the figure. Conversely, in a reverse traveling wave the phase lag decreases (phase is becoming less negative) when going to the right. This, again, is true in both representations. Because of the correspondence between Figs. 1(A) and 1(B) it will be easy to convert phase data as a function of frequency to data as a function of place and to draw conclusions about their nature—forward versus reverse traveling waves. This will be done later in this paper.
IV. RESULTS
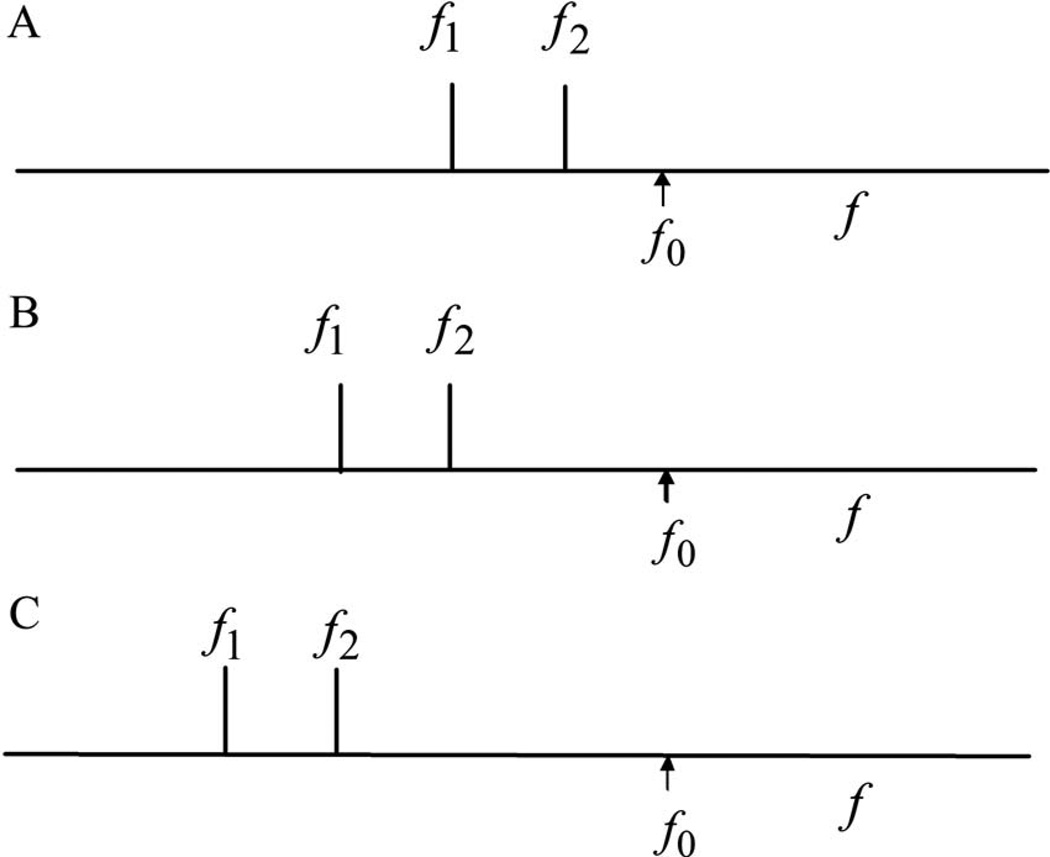
The experimental protocol is illustrated by Fig. 2. We have designated the various tone pairs by a variable that we have called istage. Panel A shows the stimulus conditions in the first presentation of the set (istage being equal to 1). The frequency f0 is the BF of the observation location L0. Actually, because the BF is not known until after (a part of) the experiment has been performed, we artificially set f0 equal to 17 kHz. The frequency ratio is R1, and is constant during one run of the experiment. The higher frequency f2 is, more or less arbitrarily, chosen to be equal to f0 /R1, the lower frequency f1 is then equal to . Panel B shows the condition for istage equal to 2. Both frequencies are reduced by the factor R1. In panel C istage is equal to 3 and both frequencies are again reduced by the factor R1. In one run we have used nine of such presentations, istage goes from 1 to 9. As argued in the previous section responses will always be plotted as functions of frequency. In every one of our experiments we have used maximally twelve runs with different values for the ratio R1. For clarity we will plot results for only a few values of R1.
FIG. 2.
Experimental protocol, frequency scale is logarithmic. Frequencies f1 and f2. Frequency ratio R1 equals f2/f1. The frequency f0 is equal to 17 kHz, close to the BF of the observation location. Panel A, istage=1: The higher frequency f2 is equal to f0/R1, the lower frequency f1 is equal to . Panel B, istage=2: Both frequencies are reduced by the factor R1. Panel C, istage=3: Both frequencies are again reduced by the factor R1. For each value of R1 nine of such conditions are used in the experiments.
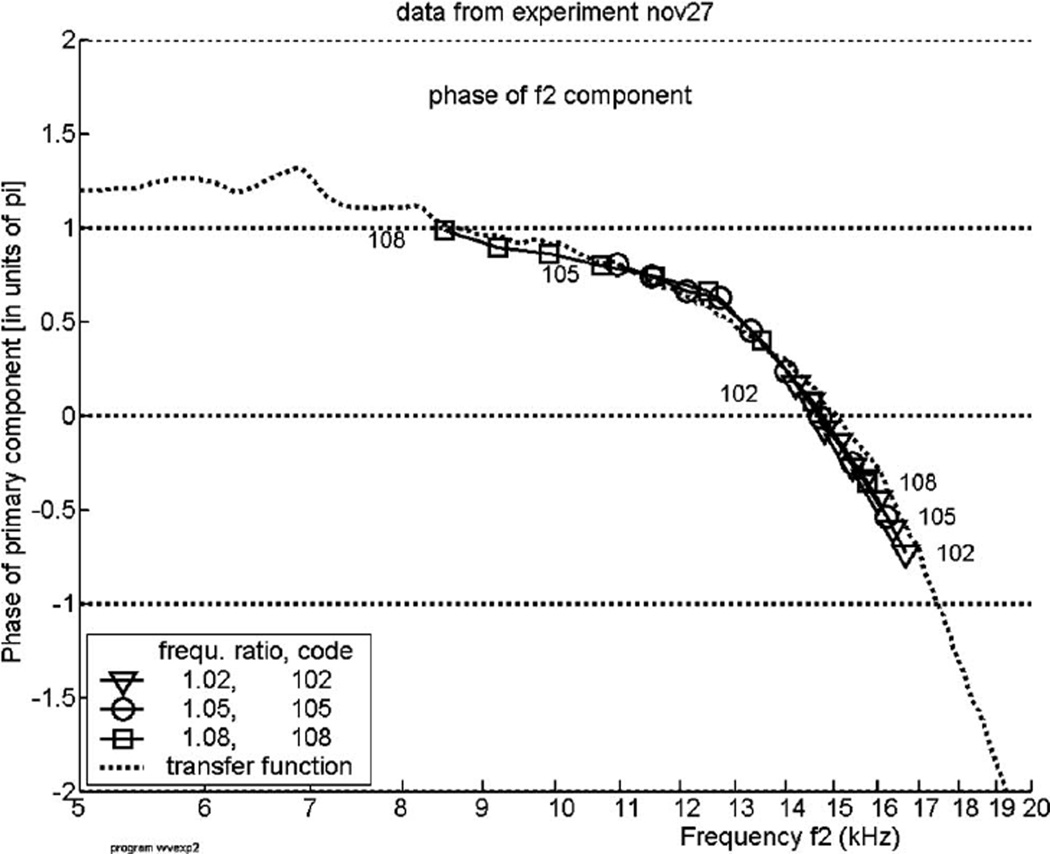
In the experiments described in this paper the primary tones were presented at a level of 70 dB sound pressure level (SPL), a relatively low level for which we could expect measurable and reliable DPs. Figure 3 shows the phase response of one of the two primary tones, the one with frequency f2, corrected for its individual phase shift Θ2 as described in Sec. II, for one experiment. The abscissa is the tone’s frequency f2. Each curve of Fig. 3 shows the phase for one value of the frequency ratio R1 and connects symbols indicating the nine “stages,” i.e., positions of the tone pair (where istage=1 corresponds to the rightmost point in each curve). For the ratio R1 we have selected three values from the set of frequency ratios employed, see the legend inside the figure. As expected, the phase curve of the primary tone demonstrates a forward traveling wave. The dotted curve shows the single-tone phase as function of frequency as it has been derived from a composite-spectrum file (see Sec. II) at the level of 80 dB per octave. The phase of the single primary tone deviates slightly from the tone phase derived from the composite-spectrum file, the difference is not consistent enough to be attributed to two-tone interaction.
FIG. 3.
The phase of the primary component with frequency f2 in the recorded spectrum, plotted against its own frequency, for animal “nov27.” Each of the curves encompasses the set of values of istage from 1 to 9, whereby begin and end are marked with a code signifying the frequency ratio f2/f1 (see legend inside figure). Only three ratios were used in this experiment. The dotted curve, marked “transfer function,” shows the phase as a function of frequency derived from the composite-spectrum file measured at the level of 80 dB per octave, for the same animal.
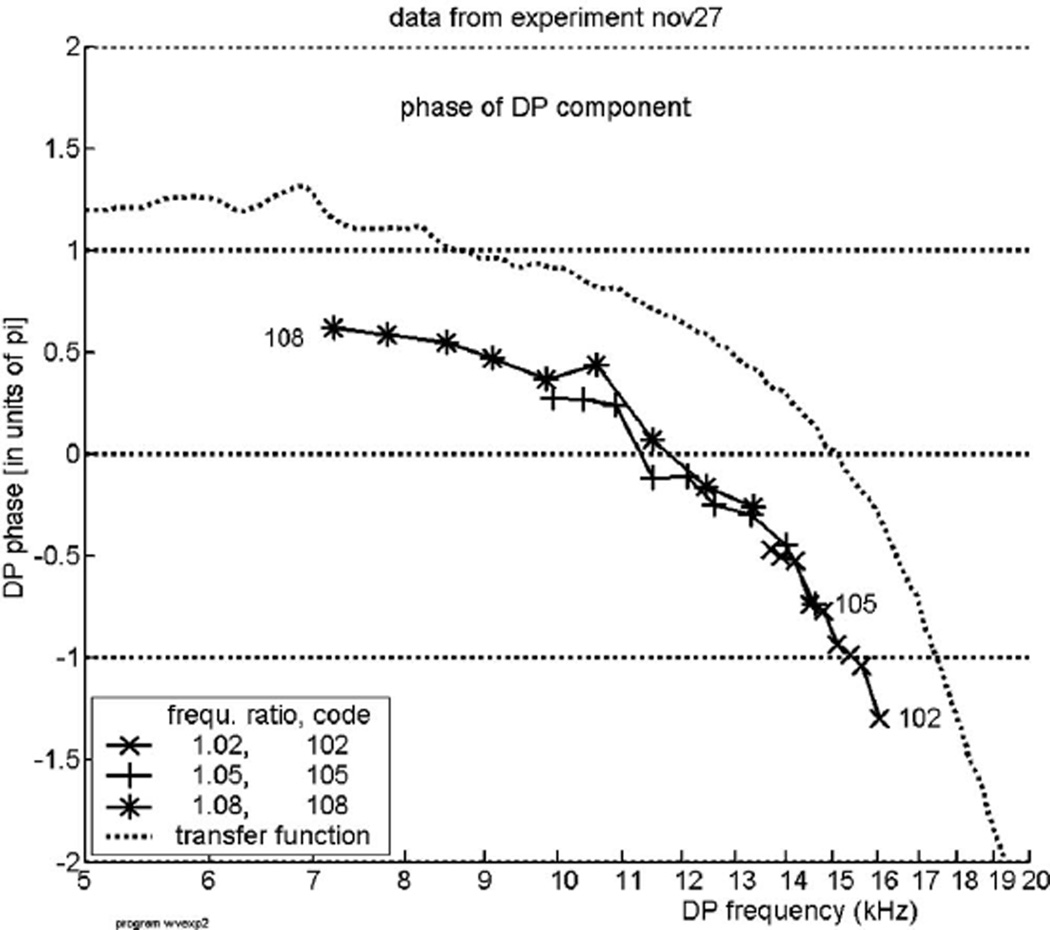
Figure 4 displays the course of the phase of the DP with frequency 2f1−f2 as a function of the DP frequency fDP, for the same experiment. The DP phase is corrected with 2Θ1 − Θ2 as described above. Each curve shows the phase for nine positions of the tone pairs; the different curves relate to different values of the frequency ratio R1, see the inside legend. This figure answers the principal question of the present paper. If the DP wave were a pure reverse traveling wave, its phase lag at location L0 would be smaller for higher than for lower frequencies and its phase function would thus have a positive slope, it would rise upwards. Obviously, this is not the case: the curves bend downwards. In terms of the x-domain representation of Fig. 1(B) (the cochlear pattern) this indicates a forward traveling wave. This result demonstrates that the DP wave—which theoretically would be starting approximately from the x2-region—is not a pure reverse traveling wave, but it appears here in the form of a forward traveling wave. We have termed this effect “inverted direction of wave propagation,” abbreviated: IDWP. We note that IDWP is similar to the effect found by Ren et al. (2006) and thus the data serve as an independent confirmation of the earlier findings. To the figure has been added as a dotted curve the nearly continuous phase response for a pure tone, as in Fig. 3. The general course is the same as that of the data but note: the curves are not parallel.
FIG. 4.
Experiment “nov27.” The phase of the DP with frequency 2f1 − f2 produced by presentation of two tones with frequencies f1 and f2, plotted against the DP frequency fDP. Tone levels: 70 dB SPL. The DP tone’s phase shows an increasing lag with increasing frequency (f2), denoting a forward traveling wave. The dotted curve, marked “transfer function,” shows the phase as a function of frequency, for the same animal, in the same way as in Fig. 3. This curve is used as a guide; it does not run parallel to the DP-data curves.
In this figure—as well as in later figures—we have plotted only data in which the peak in the spectrum at the DP frequency is more than 8 dB above the level of the surrounding components. The DP peaks generally become smaller for lower f2 and larger R1 values, and often cease to meet this criterion. When this is the case we have not included these points, and that is why in later figures we see isolated points or groups of points.
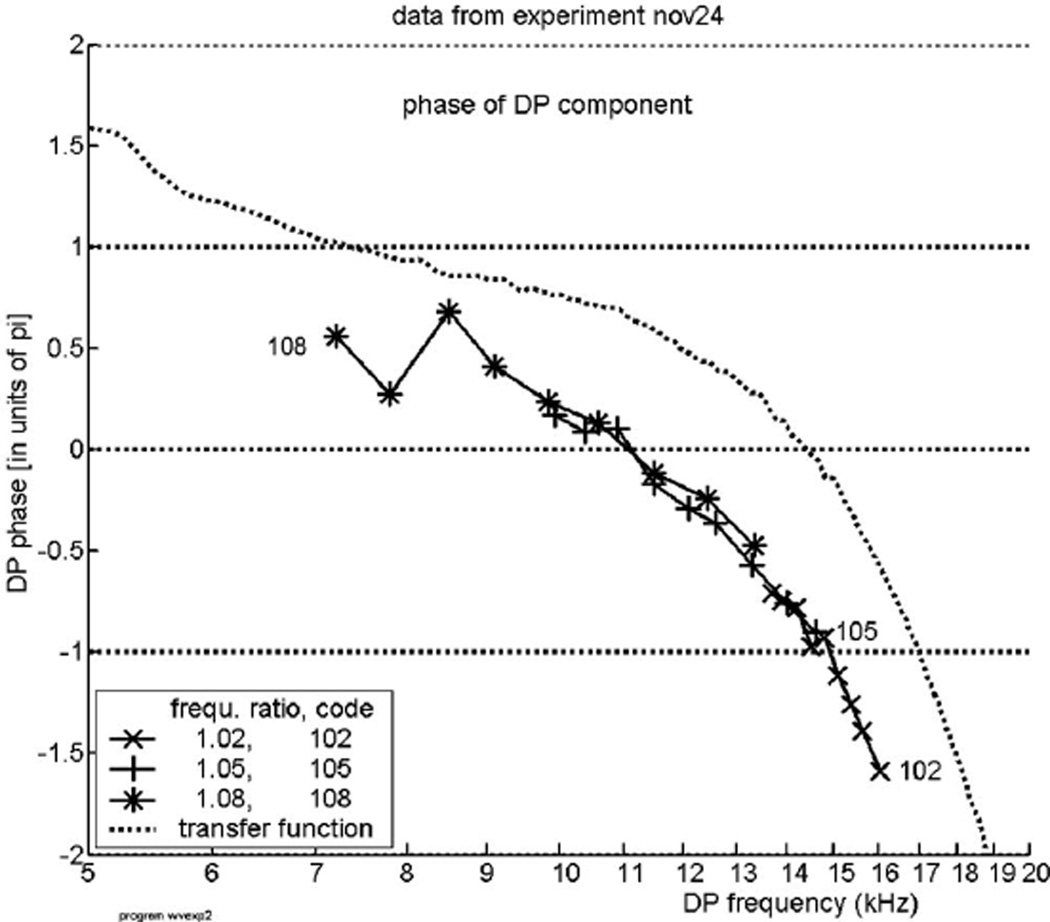
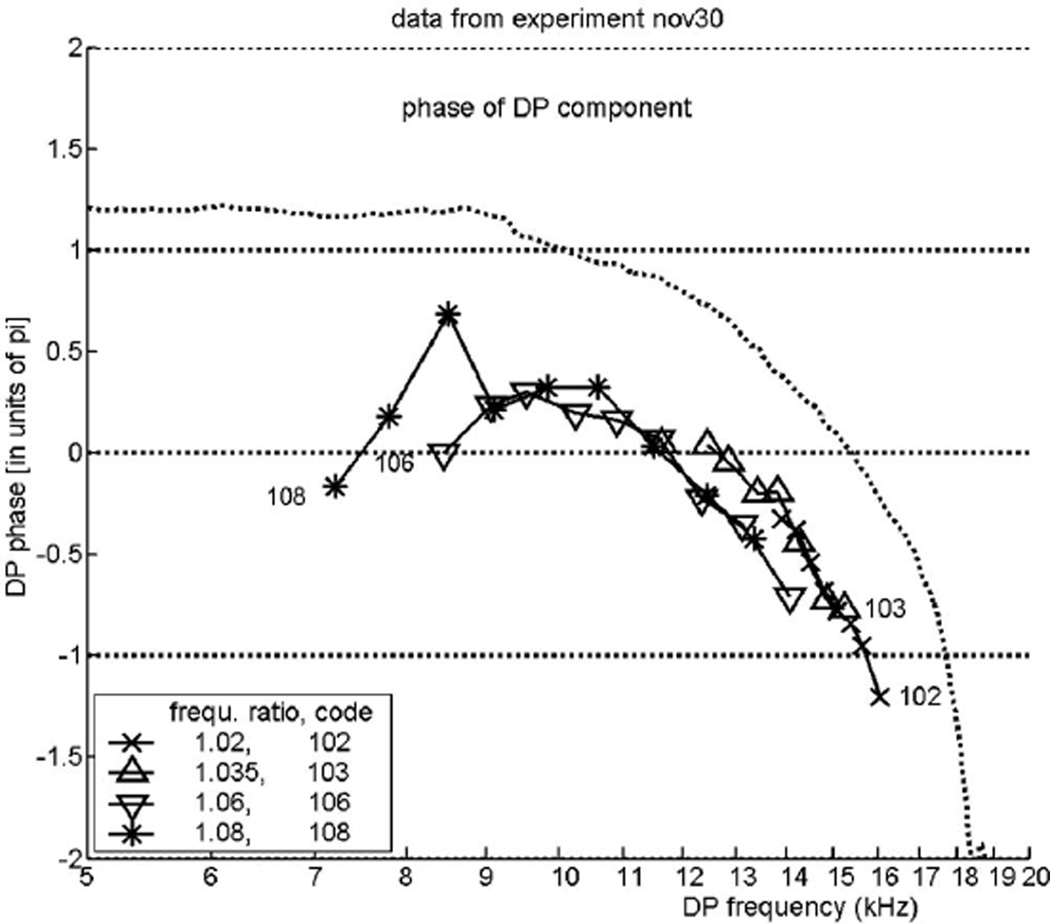
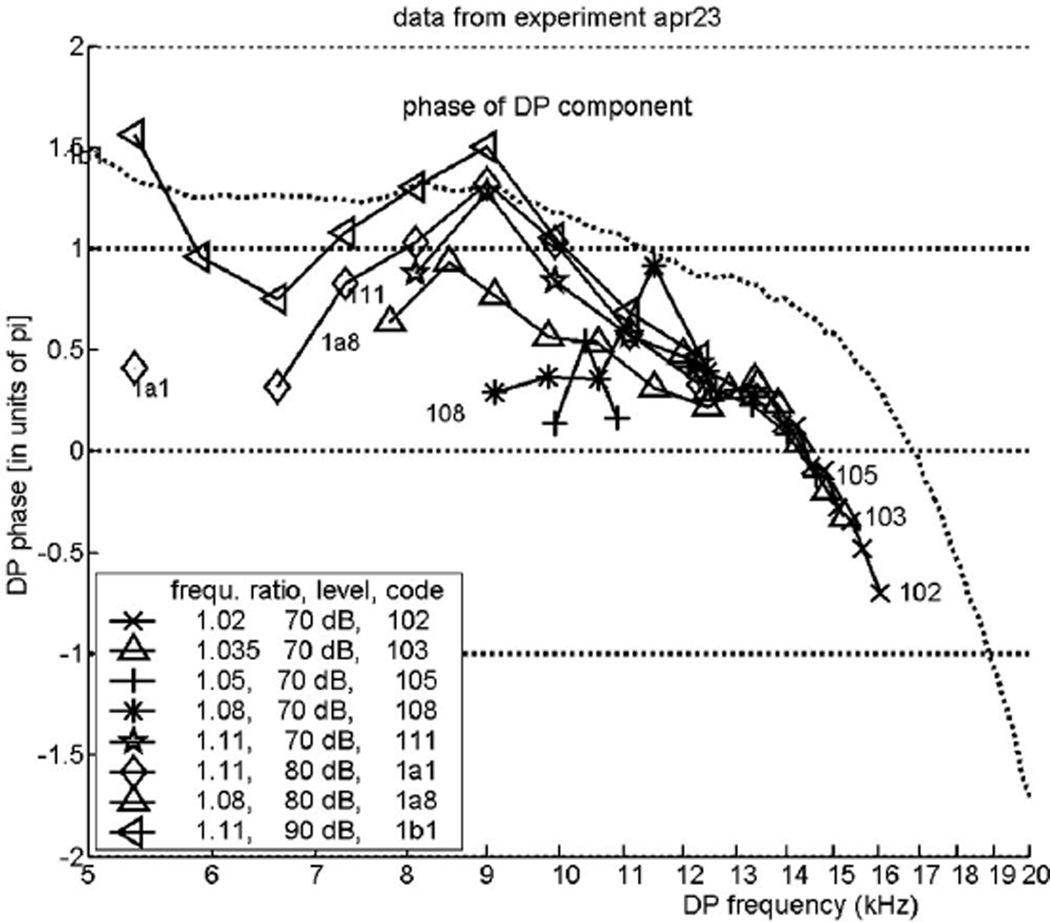
Figure 4 is for the experiment labeled “nov27.” Figures 5 and 6 show the phase of this type of DP for two other experiments, “nov24” and “nov30,” respectively. All three figures demonstrate the same basic feature, IDWP. The latter two figures also indicate the transition from a reverse traveling wave—a small positive slope on the left side of the curves—to the more pronounced negative slope of the forward traveling wave. Figure 7, finally, includes a few results obtained with stronger primary tones, where we may expect clearer evidence of that transition. However, we are unable to show exactly where the forward wave changes into a reverse traveling wave because even with the stronger stimuli the signal-to-noise ratios are too small in and below the transition region. Concurrently, deviations and errors in this region are quite large. In every one of these four figures a dotted curve derived from the same experiment has been added. These curves are slightly different but can serve as guidelines.
FIG. 5.
The same as Fig. 4, but from a different animal, experiment “nov24.”
FIG. 6.
The same as Fig. 4, but from a different animal, “nov30,” with different ratio values. In this case a hint of the transition between a reverse and a forward traveling wave is visible.
FIG. 7.
The same as Fig. 4, but from a different animal, “apr23.” In an attempt to display the transition from reverse to forward traveling wave better, a few records with stronger primary tones are included. This attempt was not very successful.
V. DISCUSSION OF EXPERIMENTAL RESULTS
In our experiments the laser beam was reflected from a gold-coated bead placed on the BM. This allowed us to use fairly weak primary tones (note that the two tones were given the same level). In contrast, in some of his early experiments (done without beads) Ren was forced to use higher levels, and doubts have risen that his results were perhaps due to those high levels. That this is not so has been proven in the most recent series of experiments in his laboratory (He et al., 2007) in which very low levels—down to 40 dB—were used. We have chosen our stimulus level in the intermediate range (basically, 70 dB) in the hope to be able to see both the reverse and forward segments of the DP wave. This hope was not fulfilled; even the use of higher levels did not help us.
In the interpretation of our results we need the assumption that at their peak points the two primary tones have the same phase if they are started at the stapes with the same phase. This condition is equivalent to the condition that the cochlea scales log frequency to location, a property that is generally accepted to be true in the basal turn. In the data of Figs. 4 and 5 the ratio of the highest to the lowest frequency is 2.8, or not more than 1.5 octaves, sufficiently small to justify this assumption.
Another subject involved in interpretation of our results is the influence of reflection at the stapes. Suppose the original reverse traveling wave starting from the x2-region undergoes substantial reflection at the stapes. Can the resulting forward traveling wave ever be larger in amplitude than the original reverse traveling wave? The answer is yes but this can only occur within (or apical to) a region where appreciable amplification for the DP frequency exists. That is, we could only expect a dominant forward traveling DP wave in the “active” region associated with the DP frequency. In practice this is the region apical to that occupied by the primary tones. Clearly, this is not what our data tell us; hence the observed forward traveling wave is not a reflected wave.
In connection with the transition from reverse to forward traveling wave one of the conclusions of Dong and Olson (2007) should be recalled. They found that, in the path from the interaction region to the stapes, there is a net reverse traveling wave. Furthermore, they detected evidence of place-fixed DPs. In their work they report a considerable degree of variability in the data (possibly due to multiple causes). We also found much variability in our data and we believe this is due to random errors. Nevertheless, the trend of the forward traveling wave is a robust feature of the DP waves in our findings. We will come back to the subject of data errors, place-fixed DPs and variability later on.
A few more general observations can be made. Consider the figures showing the DP phase for different frequency ratios. In almost all cases the curves for different frequency ratios align neatly. Why would that be so? Consider one point on the abscissa, one frequency. When the frequency ratio is increased, keeping the DP frequency the same, the effective location of the DP source moves to the left in the x domain. This shift entails only a small shift of the overall phase pattern, and thus the phase recorded at location L0 remains nearly the same. In addition, the dotted curves are not exactly parallel to the data curves, which indicates that the various forward DP waves cannot be regarded as if they originate from an invariant location.
VI. GREAT EXPECTATIONS
In a previous paper (de Boer et al., 2007) theoretical predictions for DP waves were presented. The computations were based on a “classical” model of the cochlea, a model in which the BM impedance expresses the precise relation between the BM velocity and the across-membrane pressure difference, at the same location. In that case the BM impedance is a local parameter, a driving-point impedance which has all the system-theoretical properties of driving-point impedances (Guillemin, 1957; Diependaal and Viergever, 1983). By way of the “inverse solution” the BM impedance can be derived from a given BM response function, see de Boer et al. (2007) and its references for details. For the computations in that paper one experiment, coded 19922, was selected in view of the very smooth form of the BM impedance functions, both for low and for high levels. The computations produced the theoretical course of the DP wave with frequency 2f1 − f2 in the model, as a function of the location variable x. For the purpose of that paper the frequencies f1 and f2 of the two primary tones were chosen to be above the reference frequency f0 (which simulates the BF of the measurement location L0). In that earlier work we found that 9 out of 55 experiments produced a BM impedance function that was smooth enough for the purpose of that study.
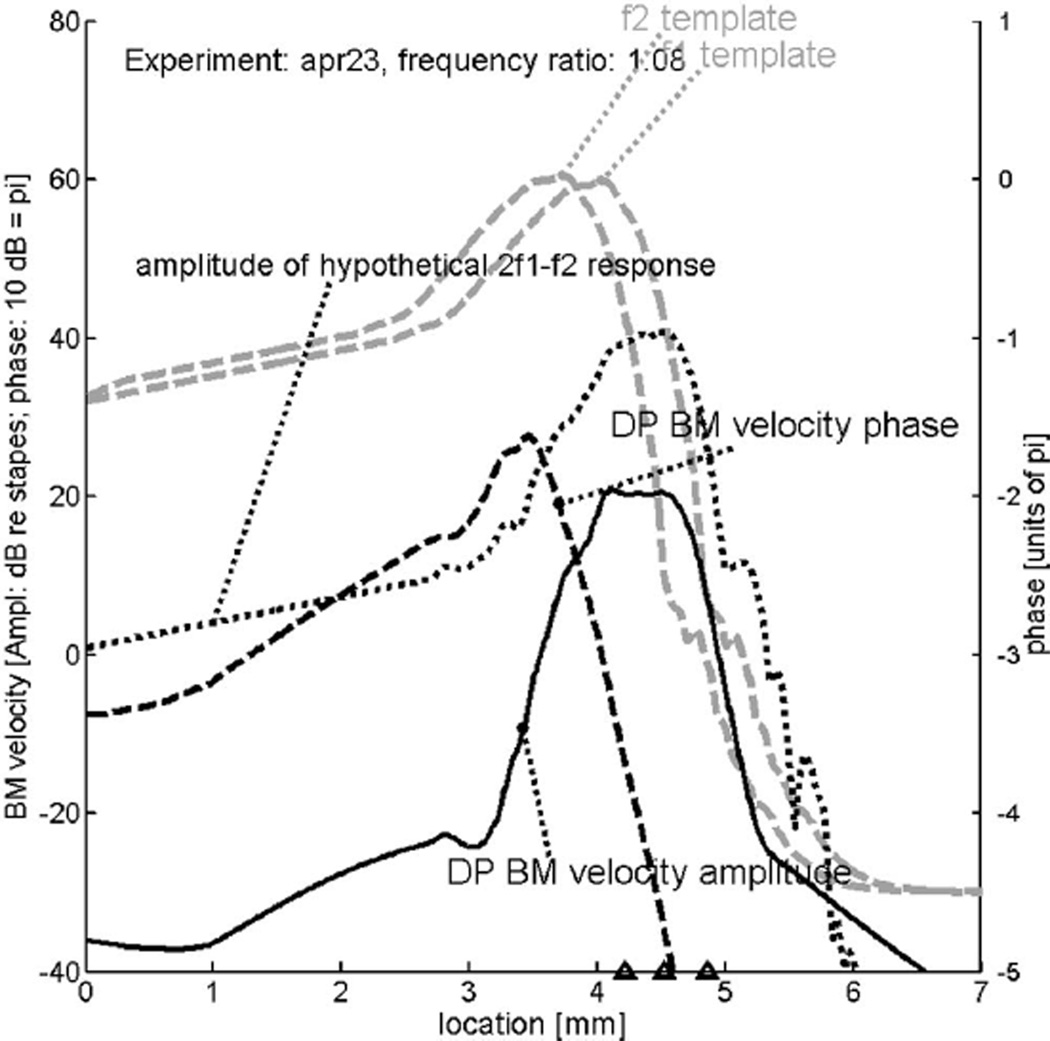
We now turn to the series of eight experiments performed for the present study. Fortunately, we found two animals of which the data can be used for a similar purpose. Accordingly, the computer program for Figs. 5–7 of that earlier paper (de Boer et al., 2007) was inspected whether it would work with primary-tone frequencies well below f0. The stimulus-response data on which the figures were based were obtained from stimulation with broadband noise, measured in the same animal. In the earlier program only the frequency range from 6.42 kHz upward was included in the projection to the x axis. To accommodate frequencies below 17 kHz better the model was modified to work upward from lower frequencies. It later turned out that this expedient was not strictly necessary; hence the earlier program was retained with only minor modifications. The abscissa in the figures to follow goes from 0 to 7 mm; the model had a length of 12 mm. The result, the theoretical DP wave derived on the basis of data from experiment ‘apr23,’ is shown by Fig. 8. Response and underlying impedance functions for this animal are not as smooth as in the earlier paper (data not shown). The thick gray dashed curves show the shapes of the cochlear amplitude patterns produced by two relatively strong tones, presented at approximately 70 dB SPL2 and having a frequency ratio equal to 1.08. This value is in the middle range of the values used in the preceding figures. The two frequencies f1 and f2 are then 14.57 and 15.74 kHz, respectively, and the DP frequency 2f1 − f2 is 13.4 kHz. The locations corresponding to these three frequencies are indicated by triangles on the bottom of the figure. The thin dotted curve in the figure, labeled “amplitude of hypothetical 2f1−f2 response,” can be seen as a reference response. It is the response that a pure tone of 13.4 kHz would produce if it were generated at the stapes. Note that its peak is somewhat sharper than those of the primary tones because the hypothetical response corresponds to a very low level (20 dB), comparable to that of DPs.
FIG. 8.
Solid and coarsely dashed curves: Predicted cochlear pattern of the distortion product (DP) with frequency 2f1 − f2 where f1 and f2 are the frequencies of the primary tones. Computed with a “classical” model of cochlear mechanics (de Boer et al., 2007) based on responses to noise signals in experiment “apr23”—with low-level BF equal to 19.23 kHz. Reflection of the reverse traveling wave at the stapes has been reduced. Actual length of the model: 12 mm. The triangles on the abscissa denote the locations corresponding to the frequencies f2, f1 and 2f1 − f2 (from left to right). The location corresponding to 17 kHz is at 3.9 mm. Gray dashed curves: cochlear response patterns produced by primary tones with frequencies of 14.57 and 15.74 kHz, respectively. The DP wave has a frequency of 13.4 kHz. Finely dotted curve: relative amplitude of a hypothetical tone with the frequency 2f1 − f2 as if it were generated at the stapes.
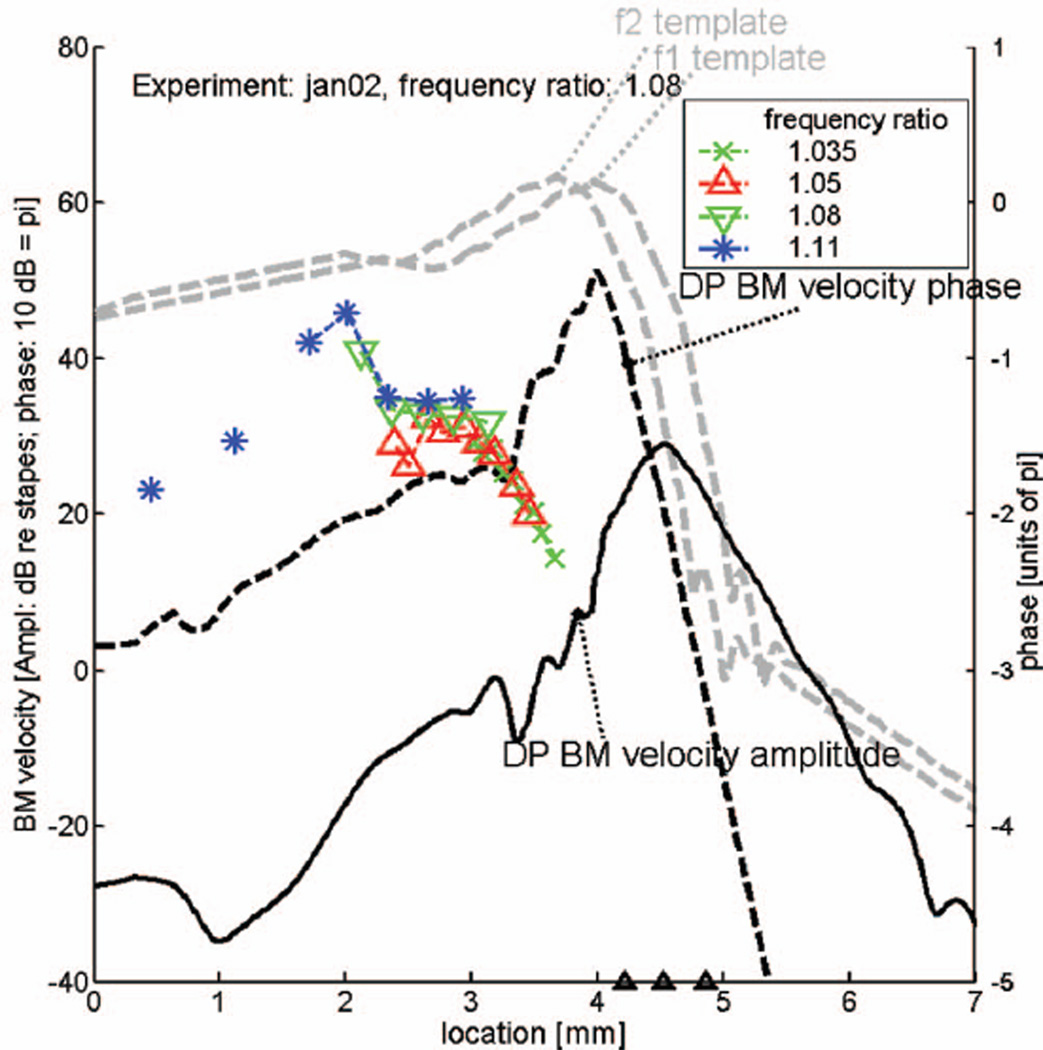
The DP wave (with frequency 2f1 − f2) is generated by nonlinear distortion in the region where the two patterns generated by the primary tones overlap. The manner in which the resulting DP wave is computed, from primary-tone excitation patterns via nonlinear distortion in OHCs to the creation of a cochlear DP wave, has been described in detail in de Boer et al. (2007). The amplitude of the DP wave, labeled “DP BM velocity amplitude,” is shown by the thick solid curve; it shows a peak at the location corresponding to its “own” frequency (13.4 kHz). The thick black dashed curve in the figure, labeled “DP BM velocity phase,” shows the computed phase pattern of the DP wave. Note that in the present paper the phase scale has been expanded with respect to the figures in our earlier paper. This DP phase curve shows what we intuitively expect the DP wave’s phase to be. On the left side of the overlap region the DP wave travels to the left—toward the stapes—and to the right of this region the DP wave travels to the right—in the direction of the helicotrema. In the center of the overlap region the computed phase is more or less constant over a small stretch. In summary, according to the theory of the classical model, a reverse traveling wave travels from the overlap region to the left (towards the stapes) and a forward traveling wave to the right (towards the helicotrema).
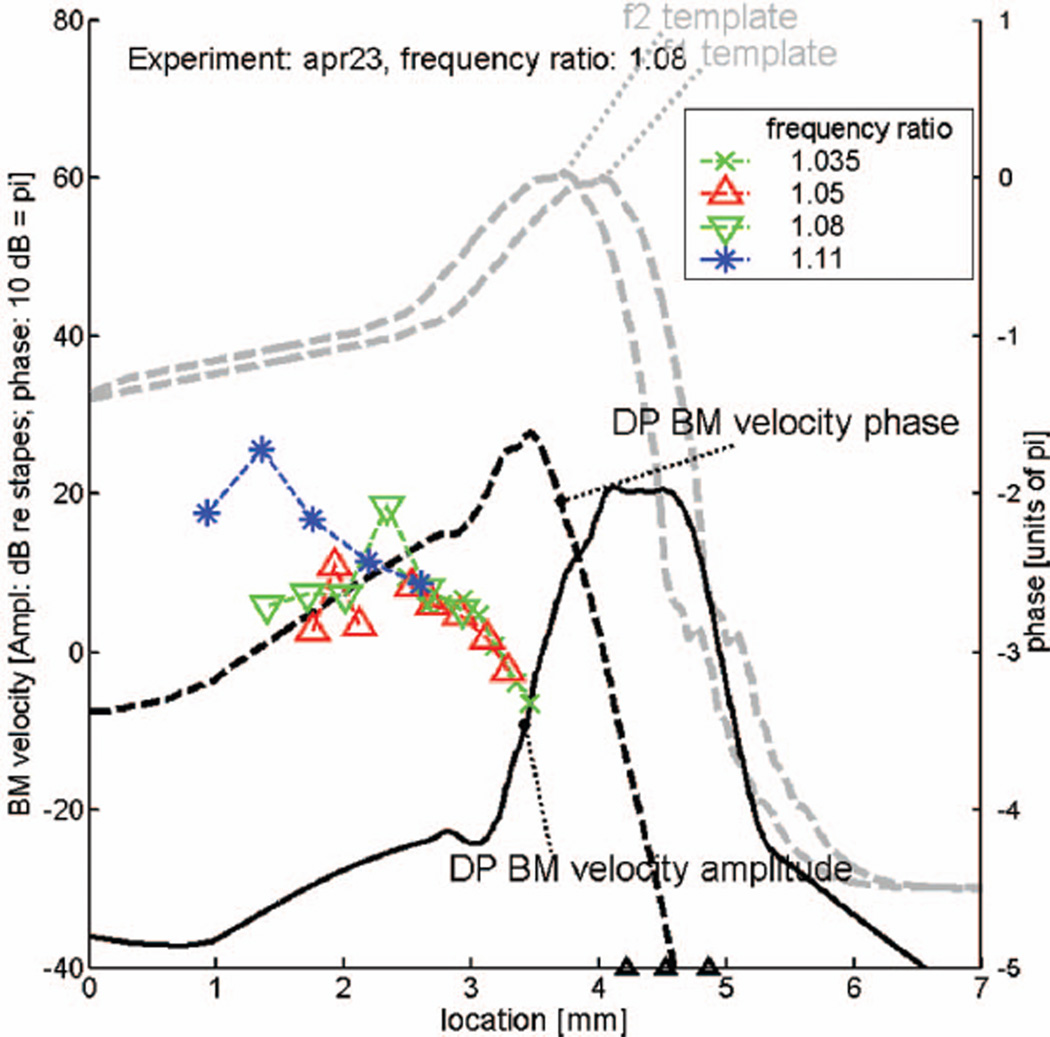
Figure 9 is a copy of Fig. 8; it shows the same predicted DP wave (the 13.4 kHz reference response curve has been omitted) for the frequency ratio of 1.08. Added to this figure are selected phase data (for three frequency ratios 1.05, 1.08 and 1.11) from the same animal (see Fig. 7), converted from the (DP) frequency to the place domain in the manner indicated by Figs. 1(A) and 1(B), and plotted in color. It is obvious that the measured phase of the DP wave goes in the opposite direction of the predicted response, demonstrating IDWP in the experimental data. Note that the average negative slope in the experimental data (the measured forward traveling wave) is of the same order of magnitude as the positive slope (the reverse traveling wave) in the prediction. From the comparison it becomes clear what is the size and extent of the IDWP effect. At first sight it may appear as a minor deviation, but it cannot be dismissed as a result of errors in the data or a shortcoming of the theory. This means that we should try to discover the origin of this effect. Figure 10 has the same layout as Fig. 9 but shows prediction and data from another one of the animals used in the present study. This figure fully confirms our conclusions from the preceding figure.
FIG. 9.
Partial copy of Fig. 8, with actual data (from the same animal) added in color. Dashed lines with crosses and symbols: selected DP phase responses (Fig. 7) transformed from the (DP) frequency to the location domain. This figure shows the true nature and extent of inverted direction of wave propagation (IDWP) in the cochlea.
FIG. 10.
Predicted amplitude and phase of DP wave, based on responses to noise signals in experiment “jan02” (low-level BF equal to 19.53 kHz). Measured DP phase values for the same experiment are added in color. Layout as in Fig. 9.
VII. GLOBAL THEORETICAL CONSIDERATIONS
The findings of Ren et al. (2006) and our present confirmation of them constitute an obstacle to the classical theory of cochlear mechanics. A classical model of the cochlea has a BM of which the mechanics is a local property. It has been shown, by de Boer et al. (2007) and Shera et al. (2007), that in a classical model with smoothly varying parameters only a reverse traveling wave arises between the response peak of the f2 tone and the stapes. Our Fig. 8 confirms this prediction for the present set of conditions. Therefore, IDWP in the sense as we mean it here is not compatible with current theory.
Classical and nonclassical models and their interrelation have been studied by the first-named author (de Boer, 1997). In a classical model forward and reverse traveling waves undergo the same amount of amplification or attenuation and have the same velocities of propagation. In a nonclassical model this premise is not true. Indeed it has been found that a feed-forward model does not have the same properties for forward and reverse traveling waves (de Boer, 2007). If the feed-forward model is designed in such a way as to show wave amplification for forward traveling waves, it will show wave attenuation for reverse traveling waves. A similar property is valid for a feed-backward model: if the model is designed to produce amplification for forward traveling waves, it has attenuation for reverse traveling waves. On the other hand, the propagation velocity is the same for forward and reverse traveling waves.
Examples of nonclassical models are feed-forward models (Steele et al., 1993; Geisler and Sang, 1995; Fukazawa, 1997; Lim and Steele, 2003) and feed-backward models. A combination of these two has been analyzed, too (Steele et al., 1993; de Boer and Nuttall, 2003; Wen and Boahen, 2003), because neither form is realistic by itself. Other examples of nonclassical models are models with more than two compartments (e.g., Hubbard, 1993). Because a general unifying theory of these models does not exist we are forced to leave these models out of consideration.
It will not be surprising that a feed-forward model designed to amplify forward traveling waves can show IDWP for the DP wave. This is so because the reverse traveling DP wave starting in the f2-region will be rapidly attenuated so that the forward traveling wave which also arises in that region will dominate. However, a pure feed-forward model is not satisfactory because such a model would show exceedingly weak otoacoustic emissions. Furthermore, the process of coherent reflection (Zweig and Shera, 1995; Shera et al., 2005; de Boer and Nuttall, 2006b), a prerequisite for a valid cochlear model, would be severely hampered.
As an alternative, we can consider corrugations in the mechanics of the cochlear partition. In Fig. 8 of the present paper we have used data from a particular animal to derive predictions on wave travel. We have selected that animal on the basis of smoothness of response and BM impedance functions, in other words, on the basis of minimal corrugations. The theory that we applied to derive the predicted response includes the possibility of internal reflections from BM corrugations. In the case of Fig. 8 the computation does not predict IDWP. In other animals, as in some of those of the present series of experiments, response and BM impedance functions are not as smooth, and the corrugations could have given rise to local reflection. However, it has not been found possible to force IDWP to occur by imposing random cochlear irregularity on a model with a smooth BM impedance function (data not shown, for the technique see de Boer and Nuttall, 2006b). As a last possibility, we should consider inadequacy of our method of data processing, i.e., the “inverse” solution. It may be that the actual “active” process in the cochlea extends over a larger distance towards the stapes than is revealed by our BM impedance results. We have little or no evidence on such a shortcoming. In summary, a satisfactory explanation of the phenomenon of IDWP has not yet been found.
VIII. CONCLUSIONS
We have executed a series of experiments on the phase of distortion products (DPs), directed at finding the nature of the DP-associated wave inside the cochlea. We focused on the DP with frequency 2f1 − f2 where f1 and f2 are the frequencies of the two stimulus tones. The movements of the BM were measured with a laser interferometer, at a location L0 with a best frequency around 17 kHz. The frequencies f1 and f2 always were below 17 kHz and were varied over more than one octave, keeping their frequency ratio constant. In this way the cochlear DP wave was monitored between the generation location (assumed to be near the f2-associated location) and the (fixed) observation location L0. It was found that in this region a segment of the DP wave runs in a counter-intuitive direction: it is a forward and not a reverse traveling wave. Our data confirm the findings of Ren et al. (2006) and He et al. (2007) in this respect. We conclude that for the DP with frequency 2f1 − f2 a substantial forward traveling wave exists in the region around the location associated with the frequency f2, and that a reverse traveling wave develops more towards the stapes. These findings are presenting an obstacle to present-day cochlear theory. Further study is necessary to find out under which conditions this anomaly of wave propagation (which we call IDWP) exists before it can be attempted to explain this phenomenon.
ACKNOWLEDGMENTS
The authors gratefully acknowledge the continual feedback provided by Christopher A. Shera. This study received support from Grant Nos. NIH NIDCD, R01 DC00141, and 1-P30-DC005983.
Footnotes
There is a small difference in shape resulting from the frequency dependence of the boundary condition at the stapes but in the figure this has been neglected.
As in the cited paper, amplitudes of primary tones are not drawn to scale.
Contributor Information
Egbert de Boer, Academic Medical Center, University of Amsterdam, Room D2-225/226, Meibergdreef 9, 1105 AZ, Amsterdam, The Netherlands and Oregon Hearing Research Center, NRC04, Oregon Health & Science University, 3181 SW Sam Jackson Park Road, Portland, Oregon 97239-3098.
Jiefu Zheng, Oregon Hearing Research Center, NRC04, Oregon Health & Science University, 3181 SW Sam Jackson Park Road, Portland, Oregon 97239-3098.
Edward Porsov, Oregon Hearing Research Center, NRC04, Oregon Health & Science University, 3181 SW Sam Jackson Park Road, Portland, Oregon 97239-3098.
Alfred L. Nuttall, Oregon Hearing Research Center, NRC04, Oregon Health & Science University, 3181 SW Sam Jackson Park Road, Portland, Oregon 97239-3098; Kresge Hearing Research Institute, University of Michigan, 1301 E. Ann Street, Ann Arbor, Michigan 48109-0506, and Department of Otolaryngology, Shanghai Jiao Tong University, 1954 Shanghai Huansan Road, Shanghai, China
References
- Allen JB, Fahey PF. Using acoustic distortion products to measure the cochlear amplifier gain on the basilar membrane. J. Acoust. Soc. Am. 1992;92:178–188. doi: 10.1121/1.404281. [DOI] [PubMed] [Google Scholar]
- de Boer E. Classical and nonclassical models of the cochlea. J. Acoust. Soc. Am. 1997;101:2148–2150. doi: 10.1121/1.418201. [DOI] [PubMed] [Google Scholar]
- de Boer E. Forward and reverse waves in nonclassical models of the cochlea. J. Acoust. Soc. Am. 2007;121:2819–2821. doi: 10.1121/1.2715743. [DOI] [PubMed] [Google Scholar]
- de Boer E, Nuttall AL. The mechanical waveform of the basilar membrane. III. Intensity effects. J. Acoust. Soc. Am. 2000;107:1497–1507. doi: 10.1121/1.428436. [DOI] [PubMed] [Google Scholar]
- de Boer E, Nuttall AL. Properties of amplifying elements in the cochlea. In: Gummer AW, Dalhoff E, Nowotny M, Scherer MP, editors. Biophysics of the Cochlea: From Molecules to Model. Singapore: World Scientific; 2003. pp. 331–342. [Google Scholar]
- de Boer E, Nuttall AL. Association for Research in Otolaryngology, Mid-Winter-Meeting. Vol. 29. Baltimore MD: 2006a. Amplification via “compression waves” in the cochlea—a parable; p. 349. Abstracts. [Google Scholar]
- de Boer E, Nuttall AL. Spontaneous basilar-membrane oscillation (SBMO) and coherent reflection. J. Assoc. Res. Otolaryngol. 2006b;7:26–37. doi: 10.1007/s10162-005-0020-9. [DOI] [PMC free article] [PubMed] [Google Scholar]
- de Boer E, Nuttall AL, Hu N, Zou Y, Zheng J. The Allen–Fahey experiment extended. J. Acoust. Soc. Am. 2005;117:1260–1267. doi: 10.1121/1.1856229. [DOI] [PubMed] [Google Scholar]
- de Boer E, Nuttall AL, Shera CA. Wave propagation patterns in a “classical” three-dimensional model of the cochlea. J. Acoust. Soc. Am. 2007;121:352–362. doi: 10.1121/1.2385068. [DOI] [PubMed] [Google Scholar]
- Diependaal RJ, Viergever MA. Point-impedance characterization of the basilar membrane in a three-dimensional cochlea model. Hear. Res. 1983;11:33–40. doi: 10.1016/0378-5955(83)90043-6. [DOI] [PubMed] [Google Scholar]
- Dong W, Olson ES. Evidence for reverse cochlear traveling waves. J. Acoust. Soc. Am. 2008;123:222. doi: 10.1121/1.2816566. [DOI] [PubMed] [Google Scholar]
- Fukazawa T. A model of cochlear micromechanics. Hear. Res. 1997;113:182–190. doi: 10.1016/s0378-5955(97)00138-x. [DOI] [PubMed] [Google Scholar]
- Geisler CD, Sang C. A cochlear model using feed-forward outer-hair-cell forces. Hear. Res. 1995;86:132–146. doi: 10.1016/0378-5955(95)00064-b. [DOI] [PubMed] [Google Scholar]
- Guillemin EA. Synthesis of Passive Networks. New York: Wiley; 1957. [Google Scholar]
- Goodman SS, Withnell RH, de Boer E, Lilly DJ, Nuttall AL. Cochlear delays measured with amplitude-modulated tone-burst evoked OAEs. Hear. Res. 2004;188:57–69. doi: 10.1016/S0378-5955(03)00375-7. [DOI] [PubMed] [Google Scholar]
- He WX, Nuttall AL, Ren T. Two-tone distortion at different longitudinal locations on the basilar membrane. Hear. Res. 2007;228:112–122. doi: 10.1016/j.heares.2007.01.026. [DOI] [PMC free article] [PubMed] [Google Scholar]
- Hubbard AE. A traveling wave-amplifier model of the cochlea. Science. 1993;259:68–71. doi: 10.1126/science.8418496. [DOI] [PubMed] [Google Scholar]
- Kalluri R, Shera CA. Distortion-product source unmixing: A test of the two-mechanism model for DPOAE generation. J. Acoust. Soc. Am. 2001;109:622–637. doi: 10.1121/1.1334597. [DOI] [PubMed] [Google Scholar]
- Kemp DT. Stimulated acoustic emission from within the human auditory system. J. Acoust. Soc. Am. 1978;64:1386–1391. doi: 10.1121/1.382104. [DOI] [PubMed] [Google Scholar]
- Lim K-M, Steele CR. Response suppression and transient behavior in a nonlinear active cochlear model with feed-forward. Int. J. Solids Struct. 2003;40:5097–5107. [Google Scholar]
- Nuttall AL, Dolan DF, Avinash G. Laser Doppler velocimetry of basilar membrane vibration. Hear. Res. 1991;51:203–214. doi: 10.1016/0378-5955(91)90037-a. [DOI] [PubMed] [Google Scholar]
- Nuttall AL, Grosh K, Zheng J, de Boer E, Zou Y, Ren T. Spontaneous basilar membrane oscillation and otoacoustic emission at 15 kHz in a guinea pig. J. Assoc. Res. Otolaryngol. 2004;5:337–349. doi: 10.1007/s10162-004-4045-2. [DOI] [PMC free article] [PubMed] [Google Scholar]
- Ren T. Association for Research in Otolaryngology, Mid-Winter-Meeting. Vol. 27. Daytona Beach, FL: 2004a. Propagation direction of the otoacoustic emission along the basilar membrane; p. 343. Abstracts. [Google Scholar]
- Ren T. Reverse propagation of sound in the gerbil cochlea. Nat. Neurosci. 2004b;7:333–334. doi: 10.1038/nn1216. [DOI] [PubMed] [Google Scholar]
- Ren T, He WX, Nuttall AL. Backward propagation of otoacoustic emissions in the cochlea. In: Nuttall AL, Ren T, Gillespie P, Grosh K, de Boer E, editors. Auditory Mechanisms: Processes and Models. Singapore: World Scientific; 2006. pp. 79–85. [Google Scholar]
- Ruggero MA. Comparison of group delay of 2f1−f2 distortion product otoacoustic emissions and cochlear travel times. ARLO. 2004;5:143–147. doi: 10.1121/1.1771711. [DOI] [PMC free article] [PubMed] [Google Scholar]
- Shera CA. Four counter-arguments for slow-wave OAEs. In: Nuttall AL, Ren T, Gillespie P, Grosh K, de Boer E, editors. Auditory Mechanisms: Processes and Models. Singapore: World Scientific; 2006. pp. 449–455. [Google Scholar]
- Shera CA, Guinan JJ. Evoked otoacoustic emissions arise by two fundamentally different mechanisms: A taxonomy for mammalian OAEs. J. Acoust. Soc. Am. 1999;105:782–798. doi: 10.1121/1.426948. [DOI] [PubMed] [Google Scholar]
- Shera CA, Tubis A, Talmadge CL. Coherent reflection in a two-dimensional cochlea: Short-wave versus long-wave scattering in the generation of reflection-source otoacoustic emissions. J. Acoust. Soc. Am. 2005;118:287–313. doi: 10.1121/1.1895025. [DOI] [PubMed] [Google Scholar]
- Shera CA, Tubis A, Talmadge CL, de Boer E, Fahey PA, Guinan JJ. Allen-Fahey and related experiments support the predominance of cochlear slow-wave otoacoustic emissions. J. Acoust. Soc. Am. 2007;121:1564–1575. doi: 10.1121/1.2405891. [DOI] [PubMed] [Google Scholar]
- Siegel JH, Cerka AJ, Recio-Spinoso A, Temchin AN, van Dijk P, Ruggero MA. Delays of stimulus-frequency otoacoustic emissions and cochlear vibrations contradict the theory of coherent reflection filtering. J. Acoust. Soc. Am. 2005;118:2434–2443. doi: 10.1121/1.2005867. [DOI] [PubMed] [Google Scholar]
- Steele CR, Baker G, Tolomeo J, Zetes D. Electromechanical models of the outer hair cell. In: Duifhuis H, Horst JW, van Dijk P, van Netten SM, editors. Biophysics of Hair-Cell Sensory Systems. Singapore: World Scientific; 1993. pp. 207–214. [Google Scholar]
- Wen B, Boahen K. A linear cochlear model with active bi-directional coupling. Proceedings of the 25th Annual International Conference of the IEEE Engineering in Medicine and Biology Society; Cancun, Mexico. 2003. pp. 2013–2016. [Google Scholar]
- Zweig G, Shera CA. The origin of periodicity in the spectrum of evoked otoacoustic emissions. J. Acoust. Soc. Am. 1995;98:2018–2047. doi: 10.1121/1.413320. [DOI] [PubMed] [Google Scholar]


