

Abstract
Type 1 diabetes (T1D) is a T cell-mediated disease. It is strongly associated with susceptibility haplotypes within the major histocompatibility complex, but this association accounts for an estimated 50% of susceptibility. Other studies have identified as many as 50 additional susceptibility loci, but the effect of most is very modest (odds ratio (OR) <1.5). What accounts for the “missing heritability” is unknown and is often attributed to environmental factors. Here we review new data on the cognate ligand of MHC molecules, the T cell receptor (TCR). In rats, we found that one allele of a TCR variable gene, Vβ13A, is strongly associated with T1D (OR >5) and that deletion of Vβ13+ T cells prevents diabetes. A role for the TCR is also suspected in NOD mice, but TCR regions have not been associated with human T1D. To investigate this disparity, we tested the hypothesis in silico that previous studies of human T1D genetics were underpowered to detect MHC-contingent TCR susceptibility. We show that stratifying by MHC markedly increases statistical power to detect potential TCR susceptibility alleles. We suggest that the TCR regions are viable candidates for T1D susceptibility genes, could account for “missing heritability,” and could be targets for prevention.
1. Introduction
Type 1 diabetes (T1D) is a T cell-mediated autoimmune disease that afflicts a million persons in the USA [1, 2]. It is a polygenic disorder resulting from the interaction of multiple gene variants [3] and environmental factors [4]. No approved methods are currently available for its prevention or reversal [5]. Most interventions targeted at curing human T1D have focused on either “secondary” or “tertiary” prevention, that is, treating individuals who either have the disease or are at risk based on family history and autoantibody titers [5]. To date, no intervention has achieved the degree of success required for clinical adaptation [6].
New strategies for primary prevention in susceptible individuals would be advantageous, attacking the problem before it starts or at its earliest stages [7]. Primary prevention, however, requires accurate predictive genetic tools. Treatment of individuals who would have remained diabetes-free poses serious pragmatic and ethical issues.
The major genetic loci for diabetes susceptibility are within the human leukocyte antigen (HLA) region, specifically those encoding HLA-DR and DQ antigens, with a less significant independent contribution from HLA class I genes [8–10]. Several high-risk HLA class II haplotypes account for ~40% of the predisposition to T1D, with an odds ratio of ~6.8, but accounting for the remaining 60% is an unresolved problem [3]. The insulin genes VNTR, PTPN22, and CD25 are associated with odds ratios >1.5, and rare alleles of IFIH1 have an odds ratio (OR) near 0.5 [11]. More than 40 non-MHC genes/regions, most involved in immune responses, have statistically significant associations, but with OR <1.5 [11, 12].
Unfortunately, although low-resolution HLA-genotyping will identify most individuals at risk for T1D, only 1/15 or ~7% of individuals with one of the highest risk HLA genotypes (known as “DR3/DR4”) will actually become diabetic [13]. Additional genetic knowledge has not yet significantly improved prediction. An early estimate of sibling relative risk (λs) for T1D was estimated to be quite high at 15 [14]. Predictions of T1D, incorporating both HLA and all currently known loci, generate a λs of only 5 [3, 15], although a recently reported strategy based on combining multiple risk alleles appears to hold promise [16].
2. The TCR and “Missing Heritability”
A possible explanation for our inability to predict T1D accurately based on genotyping is the effect of environmental perturbants [21]. There is clear seasonal and geographic variation in the onset of T1D [22], and miniepidemics of the disease have been documented [23]. Viral infection is thought to be the most likely perturbant, and it remains a topic of intense investigation [24]. Although there is no good evidence for direct infection of pancreatic beta cells, the immune response to infection might easily provoke disease onset in genetically predisposed individuals. Most of the genes and loci identified by genome-wide association study (GWAS) analyses of T1D are involved in immune responses [11], and the interaction of random infection with such genes (“environmental genetics”) is a plausible way to account for the “missing heritability.”
We would like to suggest, however, that there may be an overlooked genetic element that has not been detected for technical reasons, specifically the genome-encoded parts of the T cell receptor (TCR). The TCR is the cognate partner of major histocompatibility complex (MHC) molecules in the peptide-MHC (pMHC) unit (Figure 1), and T1D is clearly a T cell-mediated disease. Nonetheless, there is very little evidence that germline TCR haplotype is important in susceptibility to T1D. There are, however, linkages to TCR in human autoimmune diseases other than T1D. TCR genotype has been implicated in multiple sclerosis (MS) [25]. There are also well-documented associations of TCR genotype with other forms of autoimmunity including Sjogren's syndrome [26, 27] and narcolepsy [28–30], which has a TCRA bias.
Figure 1.
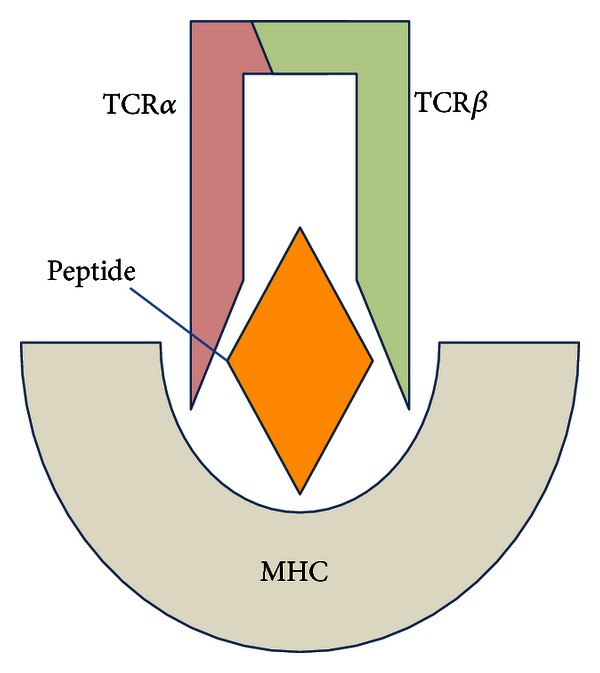
The trimolecular TCR-pMHC complex that is fundamental in T1D susceptibility.
Of course, because approximately 1015 V-(D)-J recombined TCRs are possible, it is not surprising that a role for germline-encoded TCR usage, with far less diversity than the recombined genes, has met with skepticism. New data, however, suggest that the genome-encoded TCR is likely to play a critical, previously unrecognized role in the pathogenesis of T1D. Here we review our data that point to a role for genome-encoded TCR susceptibility to T1D and then present new quantitative analyses that attempt to account for the failure of previous studies to detect such an effect.
3. Evidence from the Rat
3.1. Gene Mapping
Type 1-like autoimmune diabetes, both spontaneous and inducible, is relatively common among inbred rat strains that, like humans, express a high-risk class II MHC haplotype. In rats, this is designated RT1B/Du [19, 31, 32]. We have previously reported that Iddm14 (formerly designated Iddm4) is a dominant non-MHC susceptibility locus important for both spontaneous and induced autoimmune diabetes in multiple rat strains [18, 33–38].
Studies of Iddm14 in eight RT1B/Du rat strains led to the identification of a susceptibility haplotype in the Tcrb-V locus [18]. Sequencing and single nucleotide polymorphism (SNP) haplotype mapping revealed that 6 rat strains susceptible to diabetes (KDP, BBDR, BBDP, LEW.1WR1, LEW.1AR1-iddm, and PVG-RT1u) all share one allele of the beta chain variable region gene Tcrb-V13 (designated Tcrb-V13S1A1) [20]. Three rat strains that are resistant to, or confer resistance to, diabetes in genetic studies, all express different alleles, either Tcrb-V13S1A2 in the case of BN and WF rats, or Tcrb-V13S1A3P in the F344 rat [20]. These polymorphisms are of interest because the Tcrb-V13S1A1 gene product, designated Vβ13a, is used more by CD4+ than CD8+ cells [20]. Taken in the context of additional data available from studies of rat T1D, our findings suggest that it is the combination of MHC and TCR that in large measure determines susceptibility to T1D in the rat. As summarized in Table 1, only those rats that express both RT1B/Du and Vβ13a are highly susceptible to T1D. In the absence of Vβ13a, rats with a high-risk MHC are relatively resistant to T1D, and in the absence of RT1B/Du essentially no rats develop autoimmune diabetes.
Table 1.
Type 1 diabetes frequency in rats as a function of MHC and TCR genotypes.
| TCR | MHC | Diabetes | Strains |
|---|---|---|---|
| Vβ13a present | RT1B/Du | High susceptibility to diabetes | BBDP and BBDR |
| LEW.1WR1 and LEW.1AR1-iddm | |||
| KDP | |||
| PVG.RT1u | |||
| Vβ13a absent | RT1B/Du | Low penetrance of T1D | WF |
| Vβ13a present | Non-RT1B/Du | No T1D | Many |
These genetic observations, consistent with a critical role for germline TCR usage in T1D in the rat, led us to hypothesize that allele-specific TCR targeting could substantially prevent disease. This hypothesis was confirmed in multiple model systems, described below.
3.2. Depletion of Vβ13+ T Cells Prevents Poly I:C-Triggered T1D
LEW.1WR1 rats have a normal immunophenotype and develop T1D spontaneously at a rate of 2.5% and after treatment with polyinosinic: polycytidylic acid (poly I:C, a TLR3 and IFIH1 ligand) at a rate of 90–100% [39]. After documenting that anti-Vβ13 monoclonal antibody (mAb) reduces the number of Vβ13+ T cells in vivo by about 60%, we compared diabetes frequency in rats treated with either anti-Vβ13 mAb or control mouse anti-human OKT8. A second trial compared diabetes frequency in rats treated with anti-Vβ13 mAb, depleting anti-Vβ16 mAb, or vehicle. Diabetes frequency in rats treated with poly I:C and anti-Vβ13 mAb was 10% (2/20). In contrast, diabetes frequency in controls averaged 85% (34/40, P < 0.001) [17]. Histologic study showed significantly less insulitis and nearly complete preservation of beta cell insulin in animals treated with depleting anti-Vβ13 [17].
3.3. Depletion of Vβ13+ T Cells Prevents Virus-Triggered T1D
We also tested a model of triggered diabetes induced by viral infection. Rats were given a small priming dose of poly I:C followed by infection with Kilham rat virus (KRV). The priming dose of poly I:C is by itself nondiabetogenic but increases the penetrance of virus-triggered diabetes from ~40% to ~100% [40]. Diabetes frequency in anti-Vβ13-treated rats was 30% (3/10) as compared with 80% (8/10, P = 0.03) in both anti-Vβ16 mAb treated animals and untreated controls.
3.4. Depletion of Vβ13+ T Cells Prevents Spontaneous T1D
BBDP rats develop spontaneous T1D at a rate of 60–90% [31]. We treated cohorts of BBDP rats with vehicle, anti-Vβ13 mAb, or anti-Vβ16 mAb. Treatment with anti-Vβ13 mAb through 100 days of age completely prevented diabetes, whereas diabetes occurred in vehicle injected and anti-Vβ16 mAb treated rats at rates of 40% and 70%, respectively (P < 0.01). Among rats still nondiabetic at the end of the experiment, there was substantial “simmering” insulitis in rats treated with anti-Vβ16 mAb or vehicle [40].
These prevention studies were supplemented by additional immunological data showing a critical role for Vβ13+ T cells early in T1D pathogenesis.
3.5. CD4+Vβ13+ T Cells Are Abundant in Islets Early in the Disease Process
The animal models of “triggered” T1D that we use have well-defined kinetics and relatively rapid onset. This allows us to harvest islets from animals very early during disease onset and study the infiltrating inflammatory cells. By day 5 CD4+Vβ13+ T cells are remarkably abundant in the prediabetic islet [40], reaching a peak on day 10, when overt diabetes is first detectable.
3.6. Vβ13/Jβ mRNA Transcripts in Prediabetic Islets Are Skewed
Upon cloning the Vβ13+ transcripts from early prediabetic islets, we observed significant skewing of the TCRβ repertoire, with pauciclonal expansion of Vβ13-CDR3 sequences from islet T-cells compared to a high diversity of Vβ13-CDR3s in spleen. These data suggested that antigen-specific expansion of Vβ13+ T cells occurs in the islets of prediabetic rats. We also observed skewed TCR-Jβ usage in islet-infiltrating Vβ13+ T cells, with overrepresentation of Jβ1.3 and underrepresentation of Jβ2.1 relative to peripheral T cells. Spleen Vβ13+ T cells from poly I:C treated and untreated rats display skewing of individual Jβ segments. In addition, the representation of different Jβ segments in Vβ16+ T cell transcripts was not skewed in the islets or in the periphery. These results strongly support a role for Vβ13+ T cells in the early recognition of antigen in islets. In addition, we showed that the TCR-Vα5 repertoire is skewed among islet homing, sorted Vβ13+ T cells. This is exciting because TCR-Vα5D-4 is frequently used in the mouse T-cell response to islet antigen and recognizes insulin B:9-23 [41, 42]. Collectively, these data indicate that an oligoclonal Vβ13 response to pancreatic beta cells exists early in progression to autoimmune diabetes.
4. Evidence from the NOD Mouse
In the NOD mouse, Abiru et al. have observed a dramatic TCR α chain restriction (predominantly Vα5) in the recognition of insulin autoantigen [44]. Retrogenic NOD strains expressing Vα5D-4 α chains with many different CDR3 sequences show that even those derived from TCRs recognizing islet-irrelevant molecules develop anti-insulin autoimmunity [41]. The germline encoded Vα5D-4 T cell receptor targets a primary insulin peptide in NOD mice [41]. In addition, induction of insulin autoantibody production by helper T cells bearing Vα5D-4 α chains can be abrogated by the mutation of two amino acid residues in CDR1 and CDR2 sequences of TRAV5D-4. TRAV13-1, the human ortholog of murine TRAV5D-4, was also capable of inducing in vivo anti-insulin autoimmunity in the NOD mouse [41].
Nevertheless, the Vα locus has never been detected in mouse linkage studies to discover T1D genes. TCR-Vα5D-4 is polymorphic in mice, with 5 identified alleles differing by only 2–4 amino acids, but it also belongs to a family of paralogous genes with >92% homology (International ImMunoGeneTics information system or IMGT, http://www.imgt.org/). There is a paralog in B6 that has the same CDR1 and CDR2 as the important NOD paralog, VA5D4*04. There are two non-CDR amino acid differences in this B6 paralog, which by their position are unlikely to contribute to the trimolecular complex [45]. This means that both NOD and B6 strains could transmit an effective diabetogenic allele of a TCR-Vα5D-4, and thus there would be no apparent linkage to the Vα locus (resulting in the Idd designation) in a backcross or F2 [46].
A separate issue is whether a Vα (and TCR-Vα5D-4 in particular) selectively recognizes a permissive diabetogenic MHC molecule. A hint that this might occur is found in the mouse, where paralogs/alleles of TCR-Vα5D-4 likely influence differential selection on polymorphic MHC haplotypes. This is supported by the finding that the expressed repertoire of TCR-Vα5 paralogs in mice has a different frequency distribution in the periphery of mice with different MHC-II haplotypes [47]. In contrast, Iddm14 (TCR-Vβ13-A1) was discovered in rats in a linkage study because this TCR allelic polymorphism exists among multiple strains bearing the same high-risk MHC-II haplotypes.
5. Data That Point toward a Mechanism Explaining the Role of TCR Genotype
5.1. Sequence Data in the Rat
The gene products of Tcrb-V13S1A1 and Tcrb-V13S1A2 encode different amino acid sequences for both the CDR1 and CDR2 regions of the beta chain [20]. This polymorphism distinguishes WF and other T1D-resistant strains from BBDR, BBDP, KDP, and LEW.1WR1 T1D-susceptible strains, all of which share the same class II MHC [18]. CDR1 and CDR2 sequences are encoded within each Tcrb-V allele and are not altered by the combinatorial processes that create the CDR3 regions of the TCR (Figure 2).
Figure 2.
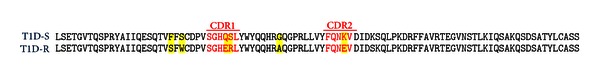
Nonsynonymous amino acid sequence alignments of beta chain CDR1 and CDR2 regions of Vβ13a, found in T1D susceptible (T1D-S) rats, and Vβ13b, which is found in T1D resistant (T1D-R) rats [17, 20]. Both the CDR1 and CDR2 regions (red) exhibit differences (all indicated in yellow). Vβ13a is encoded by Tcrb-V13S1A1 and has been found in the BBDR, BBDP, LEW.1WR1, LEW.1AR1-iddm, KDP, and PVGRT1u strains, all of which are T1D susceptible; Vβ13b is encoded by Tcrb-V13S1A2 and is found in T1D resistant WF and BN rats [17]. Another allele, Tcrb-V13S1A3P, is a pseudogene found in the resistant F344 rat [17, 20].
The Vβ13 sequences shown in Figure 2, which differentiate our susceptible and resistant alleles of Tcrb-V13, differ in both CDR1 and CDR2 and are consistent with emerging data on structural elements of the TCR-pMHC synapse that affect not only peptide recognition, but also binding affinity and peptide registration [48].
5.2. Structural Analyses
Crystal structures of the TCR-pMHC reveal the importance of the CDR1 and CDR2 regions in the human immunological synapse (recently reviewed in [48]). It is well accepted that CDR1 and CDR2 are critical for T cell-MHC restriction [49], and new data reveal how they interact with MHC helices to produce unanticipated and potentially important effects. In one study of the TCR “energetic landscape” it was noted that CDR1 and CDR2 loops act in a major way to stabilize the ligated CDR3 loops [50].
Another recent crystallographic study was designed specifically to address the question of whether shared germline contacts within the TCR-pMHC would persist despite distinct CDR3-peptide contacts in the model system, and they do [51]. The authors concluded that, “…a TCR utilizing entirely distinct chemistries to recognize different peptides exhibits highly persistent germline-mediated contacts.”
Studies by Sethi et al. have reported the crystal structure of a TCR from a patient with multiple sclerosis that engages its pMHC ligand in an unusual manner [52]. The TCR is bound in a highly tilted orientation that prevents interaction of the TCR-α chain with the MHC class II β chain helix. In this structure, only a single germline-encoded (i.e., CDR1 or CDR2) TCRVβ loop engages the MHC protein. Furthermore, the reduced interaction surface with the peptide may facilitate TCR cross-reactivity.
Finally, a very recent study shows biased TCR usage against HLA DQ8-restricted gliadin peptides in persons with celiac disease [53]. These new data show that TCR usage biased to TRBV9*01 underpins the recognition of HLA-DQ8-α-1-gliadin. More importantly for our hypothesis, they show that “all CDRβ loops (not just CDRβ3) interact with the gliadin peptide.” They proved that “…Leu37β from the CDR1β loop, and Tyr57β from the CDR2β loop are the “hot spot” residues underpinning the SP3.4 TCR-DQ8-glia-α1 interaction providing a basis for the TRBV9*01 bias.” This is precisely what our rat data predict to be true in T1D (which is often comorbid with celiac disease). Interestingly, rat Vβ13 is polymorphic in the analogous CDR1β position 37 “hot spot” described for celiac disease, strengthening the notion that allelic polymorphism in Vβ13 may influence pMHC interaction.
6. TCR Allelism in the Human Genome
A number of factors could affect investigations of the role of genome-encoded TCR sequences in human T1D. One is the issue of paralogs, which we discuss using the NOD Vα5D-4 as an example. Like the NOD, humans could also have multiple paralogs that are capable of binding insulin, and thus, some linkage studies would not find a T1D gene in the Vα region if the parents each had one or more suitable Vα paralogs. However, GWAS evaluates many more individuals than a linkage study does, and would have more power to detect those individuals who do not possess a suitable allele of a Vα chain paralog that detects insulin autoantigen. Deep sequencing has not been performed on the Vα and Vβ regions in large numbers of people, so it is premature to suggest that such individuals do not exist. To date, however, the human TCRα locus does seem significantly less complex than in rodents due to rat- and mouse-specific gene duplication events and/or human specific gene convergence (IMGT), so that human paralogs might in fact not complicate the genetic identification of a T1D gene in the Vα region.
Another factor that could affect investigations of the role of genome-encoded TCR sequences in human T1D is the possibility of extensive undocumented allelism. To investigate this possibility, we performed a preliminary study and analyzed one TCR isotype, TRBV11-2, in detail as proof of principle; it was selected because it is the human homolog of rat Tcrb-V13. From the 1000 Genomes database [57], we retrieved several TRBV11-2 sequences in which clear null alleles were present (some with open reading frames but no possibility of use in a TCR, as they did not have proper predicted cysteines or tryptophans at key residues ([57], (http://www.imgt.org/)). Among the remaining 1000 Genomes Caucasian sequences were multiple examples bearing the most common SNP variants, which supports the expected average minor allele frequency (MAF) of several of the SNPs in this region (0.21–0.43 among Caucasians, 1000 Genomes database). We sequenced a small number of samples at Drexel, to determine the level of polymorphism in this TCR element. The predominant TRBV11-2 allele among our sequences is supported by numerous ESTs and cDNAs (Figure 3). Interestingly, the UCSC database (hg19) [58] has a reference sequence for TRBV11-2 with a stop codon in the leader sequence, but all four of these TRBV11-2 genes have an open reading frame throughout the entire gene. The low read depth of sequencing, and the likely heterozygosity in the 1000 Genomes database, can contribute to ambiguous calls, leading us to question all but the most substantiated alleles of 11-2. Therefore, we searched the NCBI EST/cDNA databases for known transcripts with homology to TRBV11-2 (using BLAST), and these confirm the major alleles we found by sequencing. Our results compare with only two amino acid substitution alleles recognized previously in IMGT.
Figure 3.
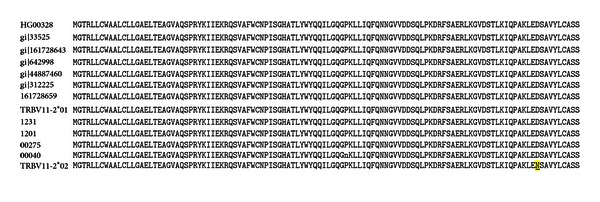
Genomic TRBV11-2 DNA sequences from Caucasian samples in the 1000 genomes database (including HG00328 (and HG00361, HG00320, HG00111, HG00310, HG00247, HG00256, HG00231, HG00127, HG00103, HG00117, HG0032, not shown)), five expressed sequences from the dbEST (indicated with gi numbers), two alleles of TRBV11-2 from IMGT, and four of the sequences we obtained at Drexel (1231, 1201, 00275, 00040) were translated and compared. Only TRBV11-2*02 shows any nonsynonymous change (D105N, underlined, yellow highlight), and it is substantiated by one transcript (M33235). The D105N change (which is residue 98 using IMGT numbering) forms a salt bridge with a positive residue (Arg75) in the Vβ domain but is away from the pMHC (see Supplementary Figure 1 available online at http://dx.doi.org//10.1155/2013/737485). Accordingly there could be some functional/structural consequence of that SNP, but given its location (not in any CDR region) and conservative nature (Asp to Asn) it is unlikely that this is a functionally significant change. There is, however, no proof that this is the case. Nucleotide substitutions reflecting known SNPs (rs183490568, rs149749379, rs148941368, rs139187012, rs76976752, rs34112565, rs17163285, rs7777952, rs17281, rs17163283, rs17280, rs11505614, rs57147993, rs10375465, and rs17279) were commonly observed among these sequences. Using these SNPs, four haplotypes (two homozygous and two heterozygous) were observed among the four Drexel sequences.
To generate a comprehensive analysis of genomic TCR effects in T1D, it will be necessary to collect alleles from each chromosome of heterozygous individuals. This information is missing from any available database, as most report a single sequence from each “person” in the cohort studied. As it is likely that people are polymorphic for TCR Vβ regions, we expect that many will be heterozygous. Thus, data are needed to fill the gap in our knowledge about variation in TRAV and TRBV as well as to contribute information on linkage disequilibrium (LD) between the many different isotypes within the TCR genomic complexes.
7. Molecular and Analytical Basis for Identification of Human TCRs Involved in T1D
7.1. Identifying and Mapping Known Human TCR Polymorphisms
To examine the possibility of germ-line human TCR variants having a functional impact on the immune repertoire and a potential impact on autoimmunity and T1D in particular, we extended the analysis of polymorphism in TRBV and compiled a comprehensive set of nonsynonymous polymorphisms in the human TRAV and TRBV genes in regions known to contact the pMHC (Table 2) [56]. In addition to the CDR1 and CDR2 loops, we included the TCR N-termini and HV4 loops, which often have 1-2 residues contacting pMHC [59, 60]. Our results (Table 2) indicate that there is a notable degree of polymorphism in both the TCRα and TCRβ chains, in regions with direct impact on pMHC binding. This was also noted in a previous study of human TRAV gene diversity where the authors found that nucleotide diversity was “substantially higher in the CDRs versus the FRs (framework regions)” [56]. This diversity is observed in a total of 19 positions and 22 genes, including the TRBV9 gene, which, as noted above, is implicated in celiac disease [53].
Table 2.
Previously identified polymorphisms in TRAV/TRBV genes near the pMHC interface.
| TCR Location1 | Polymorphism(s)2 | Genes2 |
|---|---|---|
| N-term | N2D | TRAV9-2 |
| CDR1α | V27M, G29V, G29R, N30S, P30E, P30Q, N31D, Y32S | TRAV36, TRAV12-2, TRAV8-4, TRAV14-1, TRAV38-1, TRAV20 |
| CDR2α | F55S, Q56E, A57G, V57M, S58T, T58I, A59G, K59E, Q61E | TRAV12-2, TRAV1-1, TRAV8-4, TRAV14-1, TRAV25, TRAV8-7, TRAV26-2, TRAV38-1 |
| CDR1β | A30V, N30E | TRBV7-7, TRBV6-6 |
| CDR2β | Q55H, Q57H, V57I, D58N, G60D, S60C, Q60H, L61I | TRBV9, TRBV19, TRBV30, TRBV15, TRBV20-1, TRBV10-1, TRBV3-1 |
| HV4β | G84E | TRBV7-2 |
1Region of the TCR variable domain tertiary structure. CDRs are as defined by Lefranc et al. [54], with CDR2 extended by one residue at the N-terminus to account for pMHC contacts with this position. 2From IMGT [55], as well as additional data from Mackelprang et al. [56] (in bold italics). IMGT TCR residue numbering used.
It is not certain whether the particular polymorphism in TRBV9 (Q55H) plays a key role in recognition of the gliadin-HLA-DQ8 celiac disease antigen (see above), though a structural and biophysical study of the TK3 TCR, which is encoded by the TRBV9 gene, found that this particular variant affected the electrostatic makeup and structure of pMHC recognition for HLA-B*35:01 and an EBV peptide [61].
To provide a structural context for these TCR sequence polymorphisms, we mapped their positions onto the structure of a complex of a TCR with a Class II MHC and peptide (Figure 4). While not all TCRs exhibit the same docking geometry, this particular complex [62] has a typical pMHC docking angle (49°) and is, thus, approximately representative of a variety of known complexes [63]. These polymorphisms in germ-line encoded TCR genes have a clear potential to impact the pMHC recognition, and, as the figure indicates, primarily via interaction with MHC helices. Additionally, a subset of these variants (including TCRβ position 55 in the case of the TK3 TCR [61]) have the potential to directly interact with the peptide as well. It is worth noting that additional positions outside of those analyzed here can potentially impact pMHC binding, given that TCRs are known to exhibit long-range energetic effects [64, 65] and long-range dynamic coupling between distal TCR sites [66]. It should also be noted that Table 2 is very likely an incomplete representation of TCR polymorphisms, and next generation sequencing of T cells from diseased populations, in conjunction with larger-scale studies of exome sequencing (including the 1000 Genomes project [67]), should yield valuable data on TCR polymorphisms and insights into their impact on autoimmune diseases like T1D and control of infection.
Figure 4.
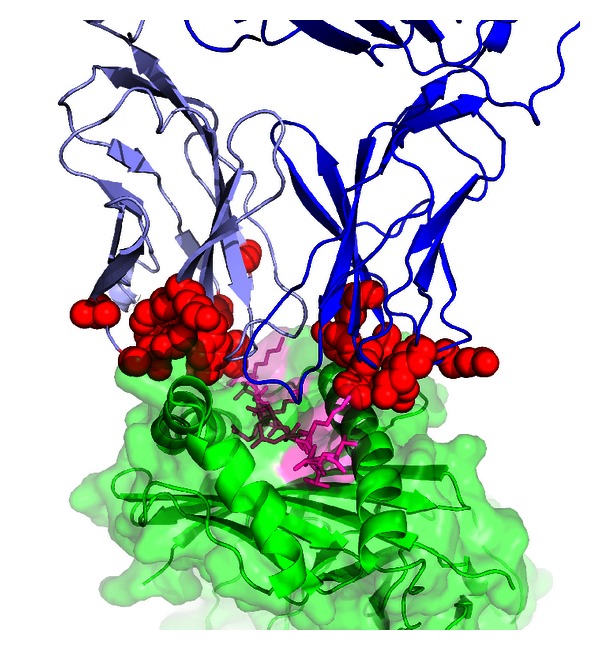
TRAV and TRBV polymorphic positions shown on a TCR/pMHC complex structure. Polymorphic positions are red, TCRα is light blue, TCRβ is blue, peptide is magenta, and MHC is green. Structure shown is HA1.7 TCR/HA peptide/HLA-DR4 (Protein Data Bank [43] ID 1J8H). The figure was generated using PyMOL (http://www.pymol.org/).
7.2. Improving Detection via Targeted Genotyping and Next Generation Sequencing
The question remains, then: why have such putative TCR alleles not been detected in GWAS studies? To address this issue, we performed a quantitative analysis. Assume that some TCRV allele, call it “Vx,” is important for T1D in individuals with a particular HLA-DRB1 allele (e.g., HLA-DRB1*03:01, which will be referred to here as DR3). We base this assumption on our data showing that Vβ13a is important for T1D in MHC Class II RT1Bu rats. Our remaining analysis is as follows.
7.2.1. Stratification by DR Allele
The ability to detect a causative “Vx” TCR allele may be dramatically improved by stratifying disease population by HLA-DR allele. Here we consider stratification by HLA diplotype (rather than presence of one haplotype alone), based on the impact of trans-encoded HLA proteins on T1D susceptibility and immune function [8, 68], as observed for the high-risk trans-encoded HLA-DQA1*05:01/DQB1*03:02. Additionally, this will control for the potential confounding effects of another HLA allele whose interaction with a different TCR could confer either additional susceptibility or resistance. However, such analysis (and stratification) can be applied for single alleles (i.e., the percentage of the T1D population with at least one copy of an allele), though haplotype frequencies (as given in Table 2 of Erlich et al. [8]) would not suffice. This is because they provide overall frequency of haplotypes within all diploid genomes (not distinguishing between homozygous and heterozygous).
As an example, we will focus on one of the high-risk HLA alleles, DR3, but the argument can be applied to any allele of interest. The frequency of DR3/3 homozygotes in T1D patients is 7.6% [8]. Assuming that the “Vx” allele is relevant in the context of HLA-DR3/3 and not the remainder of the HLA-DR allele combinations, the odds ratio seen for all T1D subjects (ORAll) is scaled accordingly from the odds ratio of “Vx” within the DR3/3 T1D population (ORDR3/3) by the DR3/3 frequency:
| (1) |
A comparison of stratified versus unstratified ORs is shown in Figure 5, for both DR3/3 and another diplotype (HLA-DR3/4-DQB1*03:02), which is more frequent in T1D (38% of the T1D population with European ancestry [8]) and contains the high-risk trans-encoded HLA-DQA*05:01/HLA-DQB*03:02 noted above. Even for a relatively modest value of ORAll (1.1, which is below the level of most identified genes in GWAS studies [11]), the OR for DR3/3 becomes appreciably higher (2.3) and somewhat higher (1.27) for DR3/4-DQB1*03:02. Given these odds ratios, for a study with 2000 patients, 2000 controls and background allele frequency of 10%, power to detect the risk TCR allele increases from 16% to 75% for DR3/4-DQB1*03:02, and to 100% for DR3/3 (G*Power version 3.1, Fisher's two-tailed exact test, α = 0.05). This implies that for previous studies that did not include stratification by HLA alleles, detection of a “Vx” allele may have been confounded by dilution of the odds ratio.
Figure 5.
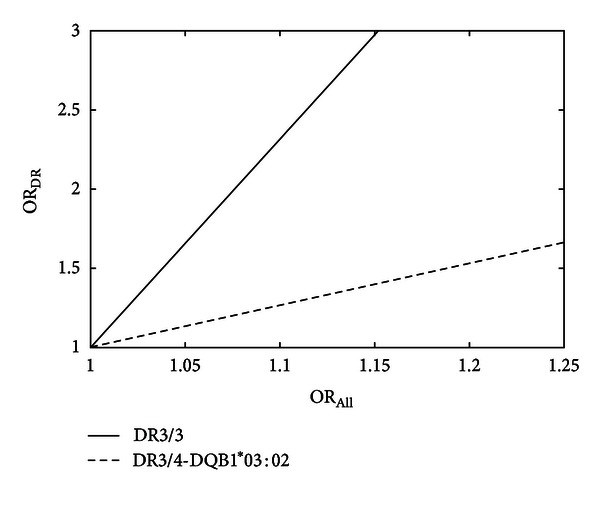
Calculated improvement in odds ratio (OR) when stratifying by HLA-DR-DQ genotype (ORDR) versus analyzing all T1D patients (ORAll) for detection of a putative risk TCR allele. Shown are data for homozygous HLA-DR3/3 and the high-risk DR3/4-DQB1*03:02 diplotype.
This analysis helps explain why a TCR α chain locus associated with autoimmune narcolepsy was identified using GWAS [29]. That study was stratified by default because a single HLA haplotype (DR B1*15:01-DQB1*06:02) is seen in 90% of cases [69]. That study did not identify the specific allele of a TCR that confers narcolepsy, though one might be identified using next generation sequencing (NGS).
7.2.2. NGS versus GWAS Array Coverage
Traditionally, analysis of polymorphisms in T1D has involved genome-wide association studies (GWASs), which rely on arrays with defined sets of probes, to infer the genotype in different regions of the locus. An analysis of linkage disequilibrium (LD) at the human TRAV locus found that it is highly variable, leading the authors to conclude that, “even with relatively dense coverage, it is unlikely that a genotyping strategy (as opposed to a resequencing strategy) will provide adequately dense coverage extending into the V genes” [56]. We examined this contention further using a dataset of TRAV and TRBV SNPs downloaded from the UCSC genome browser [58] (dbSNP [70] build 130), selecting only SNPs found within TRAV and TRBV exons from IMGT reference sequences [55]. This resulted in a total of 322 SNPs (158 in TRAV exons and 164 in TRBV exons). We used the SNAP web server [71] to calculate the degree of correlation (r 2) of these SNPs with three arrays used in previous studies of GWAS in T1D (Affymetrix GeneChip 500K, Illumina 550K Infinium and Affymetrix SNP Array 6.0) [72] and found average r 2 of approximately 0.3, and approximately 25% of SNPs with r 2 of 0.8 or higher. This coverage is somewhat lower than observed for common genome-wide SNPs from European ancestry for the Affymetrix GeneChip 500 (commensurate with values for the less common SNPs with MAFs of 1–5%) [73], but since these SNPs were not classified by frequency it is not possible to conclude that TRAV/TRBV coverage is lower than the rest of the genome, or determine the coverage of SNPs above a certain frequency threshold. Regardless, in light of the previous findings of variable LD at these loci noted above, these data support the notion that average r 2 for TRAV and TRBV SNPs is markedly lower than 1. As correlation is directly proportional to power of GWAS studies [74], it follows that there is likely at least some reduction in power to detect putative TCR alleles, reinforcing the strategy of NGS to genotype TCR polymorphisms.
8. Conclusion
The striking observations that have recently been made in the NOD mouse and in multiple strains of rats that are used to model T1D strongly suggest that elements of the TCR, encoded at the level of the genome and not subject to V-(D)-J recombination, may play a critical role in T1D susceptibility in an MHC-dependent fashion. Assuming these animal model systems are reliable, the likelihood is high that the germline TCR regions are also important for susceptibility to human T1D. This is not a new idea, but no supporting data have been reported to date. However, our quantitative analyses show that cogent statistical flaws in previous approaches could account for the negative findings. If an HLA-dependent TCR susceptibility paradigm can be identified for human T1D in the future, it could open the path to new ways of preventing the disease, either by targeting specific alleles of the TCR with deletion approaches or by using small molecules to interfere with the specific TCR-pMHC synapses that lead to the disease.
Supplementary Material
The Supplemental Figure shows the position of the D105N polymorphism (discussed in Figure 3 of the main text) in the crystal structure of the CF34 TCR (which is encoded by the TRBV 11-2∗01 allele) in complex with HLA-B∗0801 and a viral peptide (Protein Data Bank ID 3FFC). The position in question (which is residue 98 using IMGT numbering and in the PDB entry) is shown in red and forms a salt bridge with a positive residue (Arg75; shown as cyan sticks) in the Vβ domain but it is away from the pMHC (approximately 22 Å) and CDRs. TCR α chain is light blue, β chain is blue, peptide is magenta, and MHC is green. The supplemental figure was generated using PyMOL (http://www.pymol.org/).
Acknowledgments
This work is supported in part by Grants 7-11-BS-102 (J. P. Mordes) and 7-09-BS-18 (E. P. Blankenhorn) from the American Diabetes Association, Grants AI092105 (J. P. Mordes), AI088480 (E. P. Blankenhorn), DK61722 (J. A. Noble), and GM084884 (Z. Weng) from the National Institutes of Health.
References
- 1.Van Belle TL, Coppieters KT, Von Herrath MG. Type 1 diabetes: etiology, immunology, and therapeutic strategies. Physiological Reviews. 2011;91(1):79–118. doi: 10.1152/physrev.00003.2010. [DOI] [PubMed] [Google Scholar]
- 2.Tooley JE, Waldron-Lynch F, Herold KC. New and future immunomodulatory therapy in type 1 diabetes. Trends in Molecular Medicine. 2012;18(3):173–181. doi: 10.1016/j.molmed.2012.01.001. [DOI] [PMC free article] [PubMed] [Google Scholar]
- 3.Polychronakos C, Li Q. Understanding type 1 diabetes through genetics: advances and prospects. Nature Reviews Genetics. 2011;12(11):781–792. doi: 10.1038/nrg3069. [DOI] [PubMed] [Google Scholar]
- 4.Trucco M. Gene-environment interaction in type 1 diabetes mellitus. Endocrinología y Nutrición. 2009;56(4):56–59. doi: 10.1016/S1575-0922(09)73521-1. [DOI] [PubMed] [Google Scholar]
- 5.Wherrett DK, Daneman D. Prevention of type 1 diabetes. Endocrinology and Metabolism Clinics of North America. 2009;38(4):777–790. doi: 10.1016/j.ecl.2009.08.006. [DOI] [PMC free article] [PubMed] [Google Scholar]
- 6.Michels AW, Eisenbarth GS. Immune intervention in type 1 diabetes. Seminars in Immunology. 2011;23(3):214–219. doi: 10.1016/j.smim.2011.07.003. [DOI] [PMC free article] [PubMed] [Google Scholar]
- 7.Zhang L, Eisenbarth GS. Prediction and prevention of Type 1 diabetes mellitus. Journal of Diabetes. 2011;3(1):48–57. doi: 10.1111/j.1753-0407.2010.00102.x. [DOI] [PubMed] [Google Scholar]
- 8.Erlich H, Valdes AM, Noble J, et al. HLA DR-DQ haplotypes and genotypes and type 1 diabetes risk analysis of the type 1 diabetes genetics consortium families. Diabetes. 2008;57(4):1084–1092. doi: 10.2337/db07-1331. [DOI] [PMC free article] [PubMed] [Google Scholar]
- 9.Ide A, Babu SR, Robles DT, et al. “Extended” A1, B8, DR3 haplotype shows remarkable linkage disequilibrium but is similar to nonextended haplotypes in terms of diabetes risk. Diabetes. 2005;54(6):1879–1883. doi: 10.2337/diabetes.54.6.1879. [DOI] [PubMed] [Google Scholar]
- 10.Noble JA, Valdes AM, Varney MD, et al. HLA class I and genetic susceptibility to type 1 diabetes: results from the type 1 diabetes genetics consortium. Diabetes. 2010;59(11):2972–2979. doi: 10.2337/db10-0699. [DOI] [PMC free article] [PubMed] [Google Scholar]
- 11.Concannon P, Rich SS, Nepom GT. Genetics of type 1A diabetes. New England Journal of Medicine. 2009;360(16):1646–1654. doi: 10.1056/NEJMra0808284. [DOI] [PubMed] [Google Scholar]
- 12.Smyth DJ, Plagnol V, Walker NM, et al. Shared and distinct genetic variants in type 1 diabetes and celiac disease. New England Journal of Medicine. 2008;359(26):2767–2777. doi: 10.1056/NEJMoa0807917. [DOI] [PMC free article] [PubMed] [Google Scholar]
- 13.Rewers M, Bugawan TL, Norris JM, et al. Newborn screening for HLA markers associated with IDDM: diabetes autoimmunity study in the young (DAISY) Diabetologia. 1996;39(7):807–812. doi: 10.1007/s001250050514. [DOI] [PubMed] [Google Scholar]
- 14.Davies JL, Kawaguchi Y, Bennett ST, et al. A genome-wide search for human type 1 diabetes susceptibility genes. Nature. 1994;371(6493):130–136. doi: 10.1038/371130a0. [DOI] [PubMed] [Google Scholar]
- 15.Clayton DG. Prediction and interaction in complex disease genetics: experience in type 1 diabetes. PLoS Genetics. 2009;5(7) doi: 10.1371/journal.pgen.1000540.e1000540 [DOI] [PMC free article] [PubMed] [Google Scholar]
- 16.Winkler C, Krumsiek J, Lempainen J, et al. A strategy for combining minor genetic susceptibility genes to improve prediction of disease in type 1 diabetes. Genes & Immunity. 2012;13(7):549–555. doi: 10.1038/gene.2012.36. [DOI] [PubMed] [Google Scholar]
- 17.Liu Z, Cort L, Eberwine R, et al. Prevention of type 1 diabetes in the rat with an allele-specific anti-T cell receptor antibody: Vβ13 as a therapeutic target and biomarker. Diabetes. 2012;61(5):1160–1168. doi: 10.2337/db11-0867. [DOI] [PMC free article] [PubMed] [Google Scholar]
- 18.Mordes JP, Cort L, Norowski E, et al. Analysis of the rat Iddm14 diabetes susceptibility locus in multiple rat strains: identification of a susceptibility haplotype in the Tcrb-V locus. Mammalian Genome. 2009;20(3):162–169. doi: 10.1007/s00335-009-9172-y. [DOI] [PMC free article] [PubMed] [Google Scholar]
- 19.Ellerman KE, Like AA. Susceptibility to diabetes is widely distributed in normal class II(u) haplotype rats. Diabetologia. 2000;43(7):890–898. doi: 10.1007/s001250051466. [DOI] [PubMed] [Google Scholar]
- 20.Stienekemeier M, Hofmann K, Gold R, Herrmann T. A polymorphism of the rat T-cell receptor β-chain variable gene 13 (BV13S1) correlates with the frequency of BV13S1-positive CD4 cells. Immunogenetics. 2000;51(4-5):296–305. doi: 10.1007/s002510050623. [DOI] [PubMed] [Google Scholar]
- 21.Laron Z. Interplay between heredity and environment in the recent explosion of type 1 childhood diabetes mellitus. American Journal of Medical Genetics. 2002;115(1):4–7. doi: 10.1002/ajmg.10338. [DOI] [PubMed] [Google Scholar]
- 22.Green A, Patterson CC. Trends in the incidence of childhood-onset diabetes in Europe 1989–1998. Diabetologia. 2001;44(3):B3–B8. doi: 10.1007/pl00002950. [DOI] [PubMed] [Google Scholar]
- 23.Lipman TH, Chang Y, Murphy KM. The epidemiology of type 1 diabetes in children in Philadelphia 1990–1994: evidence of an epidemic. Diabetes Care. 2002;25(11):1969–1975. doi: 10.2337/diacare.25.11.1969. [DOI] [PubMed] [Google Scholar]
- 24.van der Werf N, Kroese FGM, Rozing J, Hillebrands JL. Viral infections as potential triggers of type 1 diabetes. Diabetes/Metabolism Research and Reviews. 2007;23(3):169–183. doi: 10.1002/dmrr.695. [DOI] [PubMed] [Google Scholar]
- 25.Watson CT, Para AE, Lincoln MR, et al. Revisiting the T-cell receptor alpha/delta locus and possible associations with multiple sclerosis. Genes and Immunity. 2011;12(2):59–66. doi: 10.1038/gene.2010.65. [DOI] [PubMed] [Google Scholar]
- 26.Manavalan SJ, Valiando JR, Reeves WH, et al. Genomic Absence of the Gene Encoding T Cell Receptor Vβ7.2 Is Linked to the Presence of Autoantibodies in Sjögren’s Syndrome. Arthritis and Rheumatism. 2004;50(1):187–198. doi: 10.1002/art.11429. [DOI] [PubMed] [Google Scholar]
- 27.Kay RA, Hutchings CJ, Ollier WER. A subset of Sjogren’s syndrome associates with the TCRBV13S2 locus but not the TCRBV2S1 locus. Human Immunology. 1995;42(4):328–330. doi: 10.1016/0198-8859(94)00115-7. [DOI] [PubMed] [Google Scholar]
- 28.Black JL. Narcolepsy: a review of evidence for autoimmune diathesis. International Review of Psychiatry. 2005;17(6):461–469. doi: 10.1080/02646830500381492. [DOI] [PubMed] [Google Scholar]
- 29.Hallmayer J, Faraco J, Lin L, et al. Narcolepsy is strongly associated with the T-cell receptor alpha locus. Nature Genetics. 2009;41(6):708–711. doi: 10.1038/ng.372. [DOI] [PMC free article] [PubMed] [Google Scholar]
- 30.Miyagawa T, Honda M, Kawashima M, et al. Polymorphism located in TCRA locus confers susceptibility to essential hypersomnia with HLA-DRB1∗1501-DQB1∗0602 haplotype. Journal of Human Genetics. 2010;55(1):63–65. doi: 10.1038/jhg.2009.118. [DOI] [PubMed] [Google Scholar]
- 31.Mordes JP, Poussier P, Rossini AA, Blankenhorn EP, Greiner DL. Rat models of type 1 diabetes: Genetics, environment, and autoimmunity. In: Shafrir E, editor. Animal Models of Diabetes: Frontiers in Research. 2007. pp. 1–39. [Google Scholar]
- 32.Awata T, Guberski DL, Like AA. Genetics of the BB rat: association of autoimmune disorders (diabetes, insulitis, and thyroiditis) with lymphopenia and major histocompatibility complex class II. Endocrinology. 1995;136(12):5731–5735. doi: 10.1210/endo.136.12.7588330. [DOI] [PubMed] [Google Scholar]
- 33.Martin AM, Maxson MN, Leif J, Mordes JP, Greiner DL, Blankenhorn EP. Diabetes-prone and diabetes-resistant BB rats share a common major diabetes susceptibility locus, iddm4: additional evidence for a “universal autoimmunity locus” on rat chromosome 4. Diabetes. 1999;48(11):2138–2144. doi: 10.2337/diabetes.48.11.2138. [DOI] [PubMed] [Google Scholar]
- 34.Blankenhorn EP, Rodemich L, Martin-Fernandez C, Leif J, Greiner DL, Mordes JP. The rat diabetes susceptibility locus iddm4 and at least one additional gene are required for autoimmune diabetes induced by viral infection. Diabetes. 2005;54(4):1233–1237. doi: 10.2337/diabetes.54.4.1233. [DOI] [PMC free article] [PubMed] [Google Scholar]
- 35.Mordes JP, Leif J, Novak S, Descipio C, Greiner DL, Blankenhorn EP. The iddm4 locus segregates with diabetes susceptibility in congenic WF.iddm4 Rats. Diabetes. 2002;51(11):3254–3262. doi: 10.2337/diabetes.51.11.3254. [DOI] [PMC free article] [PubMed] [Google Scholar]
- 36.Hornum L, DeScipio C, Markholst H, et al. Comparative mapping of rat iddm4 to segments on HSA7 and MMU6. Mammalian Genome. 2004;15(1):53–61. doi: 10.1007/s00335-003-3023-z. [DOI] [PubMed] [Google Scholar]
- 37.Blankenhorn EP, Descipio C, Rodemich L, et al. Refinement of the iddm4 diabetes susceptibility locus reveals TCRVβ4 as a candidate gene. Annals of the New York Academy of Sciences. 2007;1103:128–131. doi: 10.1196/annals.1394.020. [DOI] [PubMed] [Google Scholar]
- 38.Fuller JM, Bogdani M, Tupling TD, et al. Genetic dissection reveals diabetes loci proximal to the gimap5 lymphopenia gene. Physiological Genomics. 2009;38(1):89–97. doi: 10.1152/physiolgenomics.00015.2009. [DOI] [PMC free article] [PubMed] [Google Scholar]
- 39.Mordes JP, Guberski DL, Leif JH, et al. LEW.1WR1 rats develop autoimmune diabetes spontaneously and in response to environmental perturbation. Diabetes. 2005;54(9):2727–2733. doi: 10.2337/diabetes.54.9.2727. [DOI] [PMC free article] [PubMed] [Google Scholar]
- 40.Tirabassi RS, Guberski DL, Blankenhorn EP, et al. Infection with viruses from several families triggers autoimmune diabetes in LEW.1WR1 rats: prevention of diabetes by maternal immunization. Diabetes. 2010;59(1):110–118. doi: 10.2337/db09-0255. [DOI] [PMC free article] [PubMed] [Google Scholar]
- 41.Nakayama M, Castoe T, Sosinowski T, et al. Germline TRAV5D-4 T cell receptor sequence targets a primary insulin peptide of NOD mice. Diabetes. 2012;61(4):857–865. doi: 10.2337/db11-1113. [DOI] [PMC free article] [PubMed] [Google Scholar]
- 42.Zhang L, Jasinski JM, Kobayashi M, et al. Analysis of T cell receptor beta chains that combine with dominant conserved TRAV5D-4*04 anti-insulin B:9-23 alpha chains. Journal of Autoimmunity. 2009;33(1):42–49. doi: 10.1016/j.jaut.2009.02.003. [DOI] [PMC free article] [PubMed] [Google Scholar]
- 43.Berman HM, Westbrook J, Feng Z, et al. The protein data bank. Nucleic Acids Research. 2000;28(1):235–242. doi: 10.1093/nar/28.1.235. [DOI] [PMC free article] [PubMed] [Google Scholar]
- 44.Abiru N, Wegmann D, Kawasaki E, Gottlieb P, Simone E, Eisenbarth GS. Dual overlapping peptides recognized by insulin peptide B:9–23 T cell receptor AV13S3 T cell clones of the NOD mouse. Journal of Autoimmunity. 2000;14(3):231–237. doi: 10.1006/jaut.2000.0369. [DOI] [PubMed] [Google Scholar]
- 45.Wucherpfennig KW, Gagnon E, Call MJ, Huseby ES, Call ME. Structural biology of the T-cell receptor: insights into receptor assembly, ligand recognition, and initiation of signaling. Cold Spring Harbor Perspectives in Biology. 2010;2(4) doi: 10.1101/cshperspect.a005140.a005140 [DOI] [PMC free article] [PubMed] [Google Scholar]
- 46.Ghosh S, Palmer SM, Rodrigues NR, et al. Polygenic control of autoimmune diabetes in nonobese diabetic mice. Nature Genetics. 1993;4(4):404–409. doi: 10.1038/ng0893-404. [DOI] [PubMed] [Google Scholar]
- 47.Simone EA, Yu L, Wegmann DR, Eisenbarth GS. T cell receptor gene polymorphisms associated with anti-insulin, autoimmune T cells in diabetes-prone NOD mice. Journal of Autoimmunity. 1997;10(3):317–321. doi: 10.1006/jaut.1997.0134. [DOI] [PubMed] [Google Scholar]
- 48.Wucherpfennig KW. The first structures of T cell receptors bound to peptide-MHC. Journal of Immunology. 2010;185(11):6391–6393. doi: 10.4049/jimmunol.1090110. [DOI] [PubMed] [Google Scholar]
- 49.Sim BC, Zerva L, Greene MI, Gascoigne NRJ. Control of MHC restriction by TCR V(α) CDR1 and CDR2. Science. 1996;273(5277):963–966. doi: 10.1126/science.273.5277.963. [DOI] [PubMed] [Google Scholar]
- 50.Borg NA, Ely LK, Beddoe T, et al. The CDR3 regions of an immunodominant T cell receptor dictate the ’energetic landscape’ of peptide-MHC recognition. Nature Immunology. 2005;6(2):171–180. doi: 10.1038/ni1155. [DOI] [PubMed] [Google Scholar]
- 51.Adams JJ, Narayanan S, Liu B, et al. T cell receptor signaling is limited by docking geometry to peptide-major histocompatibility complex. Immunity. 2011;35(5):681–693. doi: 10.1016/j.immuni.2011.09.013. [DOI] [PMC free article] [PubMed] [Google Scholar]
- 52.Sethi DK, Schubert DA, Anders AK, et al. A highly tilted binding mode by a self-reactive T cell receptor results in altered engagement of peptide and MHC. Journal of Experimental Medicine. 2011;208(1):91–102. doi: 10.1084/jem.20100725. [DOI] [PMC free article] [PubMed] [Google Scholar]
- 53.Broughton SE, Petersen J, Theodossis A, et al. Biased T cell receptor usage directed against human leukocyte antigen DQ8-restricted gliadin peptides is associated with celiac disease. Immunity. 2012;37(4):611–621. doi: 10.1016/j.immuni.2012.07.013. [DOI] [PubMed] [Google Scholar]
- 54.Lefranc MP, Pommié C, Ruiz M, et al. IMGT unique numbering for immunoglobulin and T cell receptor variable domains and Ig superfamily V-like domains. Developmental and Comparative Immunology. 2003;27(1):55–77. doi: 10.1016/s0145-305x(02)00039-3. [DOI] [PubMed] [Google Scholar]
- 55.Lefranc MP, Giudicelli V, Ginestoux C, et al. IMGT, the international ImMunoGeneTics information system. Nucleic Acids Research. 2009;37(1):D1006–D1012. doi: 10.1093/nar/gkn838. [DOI] [PMC free article] [PubMed] [Google Scholar]
- 56.Mackelprang R, Livingston RJ, Eberle MA, et al. Sequence diversity, natural selection and linkage disequilibrium in the human T cell receptor alpha/delta locus. Human Genetics. 2006;119(3):255–266. doi: 10.1007/s00439-005-0111-z. [DOI] [PubMed] [Google Scholar]
- 57.Altshuler DL, Durbin RM, Abecasis GR, et al. A map of human genome variation from population-scale sequencing. Nature. 2010;467(7319):1061–1073. doi: 10.1038/nature09534. [DOI] [PMC free article] [PubMed] [Google Scholar]
- 58.Meyer LR, Zweig AS, Hinrichs AS, et al. The UCSC genome browser database: extensions and updates 2013. Nucleic Acids Research. 2012;41(1):D64–D69. doi: 10.1093/nar/gks1048. [DOI] [PMC free article] [PubMed] [Google Scholar]
- 59.Kaas Q, Duprat E, Tourneur G, et al. IMGT standardization for molecular characterization of the T-cell receptor/peptide/MHC complexes. Immunoinformatics. 2008;1:19–49. [Google Scholar]
- 60.Pierce BG, Weng Z. A flexible docking approach for prediction of T cell receptor-peptide-MHC complexes. Protein Science. 2012;22(1):35–46. doi: 10.1002/pro.2181. [DOI] [PMC free article] [PubMed] [Google Scholar]
- 61.Gras S, Chen Z, Miles JJ, et al. Allelic polymorphism in the T cell receptor and its impact on immune responses. Journal of Experimental Medicine. 2010;207(7):1555–1567. doi: 10.1084/jem.20100603. [DOI] [PMC free article] [PubMed] [Google Scholar]
- 62.Hennecke J, Wiley DC. Structure of a complex of the human α/β T cell receptor (TCR) HA1.7, Influenza hemagglutinin peptide, and major histocompatibility complex class II molecule, HLA-DR4 (DRA*0101 and DRBI*0401): insight into TCR cross-restriction and alloreactivity. Journal of Experimental Medicine. 2002;195(5):571–581. doi: 10.1084/jem.20011194. [DOI] [PMC free article] [PubMed] [Google Scholar]
- 63.Rudolph MG, Stanfield RL, Wilson IA. How TCRs bind MHCs, peptides, and coreceptors. Annual Review of Immunology. 2006;24:419–466. doi: 10.1146/annurev.immunol.23.021704.115658. [DOI] [PubMed] [Google Scholar]
- 64.Moza B, Buonpane RA, Zhu P, et al. Long-range cooperative binding effects in a T cell receptor variable domain. Proceedings of the National Academy of Sciences of the United States of America. 2006;103(26):9867–9872. doi: 10.1073/pnas.0600220103. [DOI] [PMC free article] [PubMed] [Google Scholar]
- 65.Pierce BG, Haidar JN, Yu Y, Weng Z. Combinations of affinity-enhancing mutations in a T cell receptor reveal highly nonadditive effects within and between complementarity determining regions and chains. Biochemistry. 2010;49(33):7050–7059. doi: 10.1021/bi901969a. [DOI] [PMC free article] [PubMed] [Google Scholar]
- 66.Hawse WF, Champion MM, Joyce MV, et al. Cutting edge: evidence for a dynamically driven T cell signaling mechanism. Journal of Immunology. 2012;188(12):5819–5823. doi: 10.4049/jimmunol.1200952. [DOI] [PMC free article] [PubMed] [Google Scholar]
- 67.Abecasis GR, Auton A, Brooks LD, et al. An integrated map of genetic variation from 1,092 human genomes. Nature. 2012;491(7422):56–65. doi: 10.1038/nature11632. [DOI] [PMC free article] [PubMed] [Google Scholar]
- 68.Michels AW, Nakayama M. The anti-insulin trimolecular complex in type 1 diabetes. Current Opinion in Endocrinology, Diabetes and Obesity. 2010;17(4):329–334. doi: 10.1097/MED.0b013e32833aba41. [DOI] [PMC free article] [PubMed] [Google Scholar]
- 69.Faraco J, Mignot E. Immunological and genetic aspects of narcolepsy. Sleep Medicine Research. 2011;2:1–9. [Google Scholar]
- 70.Sherry ST, Ward MH, Kholodov M, et al. DbSNP: the NCBI database of genetic variation. Nucleic Acids Research. 2001;29(1):308–311. doi: 10.1093/nar/29.1.308. [DOI] [PMC free article] [PubMed] [Google Scholar]
- 71.Johnson AD, Handsaker RE, Pulit SL, Nizzari MM, O’Donnell CJ, De Bakker PIW. SNAP: a web-based tool for identification and annotation of proxy SNPs using HapMap. Bioinformatics. 2008;24(24):2938–2939. doi: 10.1093/bioinformatics/btn564. [DOI] [PMC free article] [PubMed] [Google Scholar]
- 72.Barrett JC, Clayton DG, Concannon P, et al. Genome-wide association study and meta-analysis find that over 40 loci affect risk of type 1 diabetes. Nature Genetics. 2009;41(6):703–707. doi: 10.1038/ng.381. [DOI] [PMC free article] [PubMed] [Google Scholar]
- 73.Pe’er I, De Bakker PIW, Maller J, Yelensky R, Altshuler D, Daly MJ. Evaluating and improving power in whole-genome association studies using fixed marker sets. Nature Genetics. 2006;38(6):663–667. doi: 10.1038/ng1816. [DOI] [PubMed] [Google Scholar]
- 74.Spencer CCA, Su Z, Donnelly P, Marchini J. Designing genome-wide association studies: sample size, power, imputation, and the choice of genotyping chip. PLoS Genetics. 2009;5(5) doi: 10.1371/journal.pgen.1000477.e1000477 [DOI] [PMC free article] [PubMed] [Google Scholar]
Associated Data
This section collects any data citations, data availability statements, or supplementary materials included in this article.
Supplementary Materials
The Supplemental Figure shows the position of the D105N polymorphism (discussed in Figure 3 of the main text) in the crystal structure of the CF34 TCR (which is encoded by the TRBV 11-2∗01 allele) in complex with HLA-B∗0801 and a viral peptide (Protein Data Bank ID 3FFC). The position in question (which is residue 98 using IMGT numbering and in the PDB entry) is shown in red and forms a salt bridge with a positive residue (Arg75; shown as cyan sticks) in the Vβ domain but it is away from the pMHC (approximately 22 Å) and CDRs. TCR α chain is light blue, β chain is blue, peptide is magenta, and MHC is green. The supplemental figure was generated using PyMOL (http://www.pymol.org/).