Abstract
Background
Ferric citrate (FC) is a phosphate binder in development for the treatment of hyperphosphatemia in patients with end-stage renal disease (ESRD). In clinical trials, FC improved patient serum phosphorus levels and increased serum ferritin and percent transferrin saturation. Because nephrologists respond to increases in these iron measures by reducing intravenous (IV) iron and erythropoiesis-stimulating agent (ESA) doses, the decreased use of iron and ESA associated with FC may reduce costs.
Objectives
To develop a cost-offset model from a managed care perspective estimating the cost savings associated with FC use.
Methods
We created a cost-offset model from the managed care payer perspective that compared the treatment costs of ESRD for patients given FC. The model considered the number of dialysis sessions per month; number of ESRD patients enrolled in the health plan; cost of ESAs, iron, and dialysis sessions; and the proportion of patients on phosphate binder therapy. The model assumed equivalent efficacy and cost neutrality between FC and other phosphate binders. Monte Carlo simulations were conducted by varying model inputs.
Results
When FC was compared to other phosphate binders, the monthly cost of ESA and IV iron per 500 patients with ESRD (85% treated with phosphate binders) was reduced by 8.15% and 33.2%, respectively. When incorporated into the total cost of dialysis for patients with ESRD (dialysis, ESA, and IV iron), the decrease in the monthly cost of dialysis care was US$80,214 per 500 ESRD patients. Monte Carlo simulations suggest that a plan serving 500 dialysis patients could save between US$626,000 and US$1,106,000 annually with the use of FC.
Conclusion
The use of FC in ESRD patients with hyperphosphatemia may help reduce treatment costs.
Keywords: phosphate binders, hyperphosphatemia, end-stage renal disease, dialysis, hemodialysis
Introduction
In the United States, approximately 570,000 patients live with end-stage renal disease (ESRD).1 Of these, approximately 400,000 undergo dialysis three or more times per week,1 while others choose other modalities of renal replacement therapy. According to the 1972 Social Security Act, ESRD was established as a chronic illness, and individuals whose disease required hemodialysis or kidney transplantation were deemed disabled.2 This distinction entitled qualifying ESRD patients to Medicare benefits covering dialysis treatment, starting in the fourth month after dialysis initiation, despite not being of age to qualify. For patients with commercial insurance, Medicare is the secondary payer until the 30th month, at which time Medicare then takes over as the primary payer.3 Despite the fact that, in 2009, only 15% of ESRD patients had commercial insurance as the primary payer, the estimated amount spent on their care was US$9 billion, versus US$29 billion for the 85% of patients with Medicare as the primary payer.1
A significant portion of the cost of managing ESRD is oral and injectable medications. The kidney is involved in the regulation of multiple homeostatic systems, including blood volume and pressure, bone and mineral metabolism, and red blood cell production; as the kidneys fail, patients must rely on drugs to exogenously regulate these systems. For example, the kidney is responsible for the excretion of phosphorus, but dialysis is unable to adequately filter phosphorus, leading to excessive levels in the blood.4 The kidneys also activate vitamin D, which regulates calcium metabolism. The combination of these events leads to significant bone and mineral deregulation, resulting in calcium being deposited in arteries instead of bone, with associated increases in clinical events such as fractures and cardiovascular and cerebrovascular events.5 As a result, patients must reduce their dietary intake of phosphorus and use oral phosphate binders to decrease their serum phosphorus level, and in the US, most ESRD patients are also treated with an injectable form of activated vitamin D to regulate calcium metabolism.6,7
The regulation of red blood cell production is another example of a critical kidney function. Healthy kidneys produce erythropoietin, which acts on bone marrow to produce red blood cells. When the kidneys fail to produce this hormone, red blood cell production and hemoglobin drop, resulting in profound anemia. To treat anemia and avoid blood transfusions in patients undergoing hemodialysis, individuals receive regular injections of epoetin alfa (an erythropoiesis-stimulating agent [ESA]) to stimulate red blood cell production, as well as intravenous (IV) iron, which is a key component of this process.8 All told, oral and injectable medications account for more than half of outpatient dialysis expenses.1
Ferric citrate is an experimental iron-based oral phosphate binder that is under Phase III clinical development to manage and control serum phosphorus in ESRD patients with chronic kidney disease with mineral and bone disorder (CKD-MBD).9 In 28-day Phase II clinical trials, ferric citrate reduced serum phosphorus levels by 25% in patients with ESRD.10 An additional finding was that ferric citrate also increased measures of iron and iron storage in the blood.11–13 Primary analyses from a long-term study extension demonstrated that the use of ferric citrate increased serum ferritin and percent saturation of transferrin (TSAT), key measures of iron storage.14 These data suggest that this single drug may have multiple benefits: treatment as an oral phosphate binder medication and iron source in ESRD patients with anemia.
We therefore developed a budget impact model estimating the monthly cost associated with the use of ferric citrate in the treatment of hyperphosphatemia with the added benefit of treating iron deficiency associated with ESRD anemia, versus the cost of other currently available phosphate binders. The model was constructed from the perspective of a US managed care plan.
Methods
Model design
We constructed a cost-offset model to quantify the potential cost savings associated with the use of ferric citrate. The economic model compares ferric citrate to currently available phosphate binders as a group, such as calcium acetate, sevelamer hydrochloride/carbonate, and lanthanum carbonate. For this model, price was set at parity for all binders, indicating no premium price for ferric citrate. The model specified that total costs per patient include cost of dialysis sessions, prescription bone and mineral drugs, and injectable medications (epoetin alfa and IV iron). Total monthly costs were compared to calculate the incremental cost savings of ferric citrate; ie, subtracting the total monthly cost for the currently available binders group from the estimated total monthly cost for ferric citrate. The average monthly individual patient treatment cost calculation is shown in Equation 1:
| (1) |
The calculation was extrapolated for 500-member plan estimates within monthly and annual time frames.
Model assumptions
This model compares treatment costs between patient groups prescribed ferric citrate versus other phosphate binders. We assumed equivalence between these groups in terms of:
Number of patients
Patient characteristics
Monthly utilization and costs for the delivery of dialysis
Monthly utilization and cost of phosphate binders
Phosphorus outcomes
In contrast, we did not assume that utilization of iron and epoetin alfa were equivalent. A recent retrospective analysis found that when nephrologists in real-world practice observe non-treatment related increases in TSAT and ferritin as shown in the ferric citrate clinical trials (TSAT [≥ 10%] and ferritin [≥15% to ≤25%]), they respond with a mean decrease of 500 units of epoetin alfa per session and 5.79 mg of IV iron per session.15 (For serum ferritin and TSAT changes to be considered non-treatment related there must have been no significant [< 10%] change in ESA administration or IV iron administration, and the patient’s hemoglobin level must have remained steady relative to the target range [below, within, or above] in the previous 60 days. Also, the physician could not have made a change in the patient’s prescribed phosphate binder or the brand of IV iron in the previous 60 days.) The cost savings were estimated for a 2-month span; persistency of saving over the year is projected based on carrying these values forward (ie, without further changes).
Model inputs
The following model input parameters are required to estimate the per patient monthly costs for ferric citrate and the currently available phosphate binders: mean number of hemodialysis sessions per month, epoetin alfa utilization per month (monthly dose per patient), IV iron utilization per month (monthly dose per patient), estimated payment for epoetin alfa (per unit) and IV iron (per mg), and estimated cost per session of dialysis. The default values for each of these parameters were obtained from published sources, historical values, or analyses of patient databases (Table 1). Baseline epoetin alfa and IV iron doses were derived from a database analysis of mean epoetin alfa, IV iron, and phosphate binder utilization in the 2 months prior to the index date of qualifying increases in serum ferritin and TSAT15
Table 1.
Default input parameters for the managed care cost-offset model
| Input | Default |
|---|---|
| Population inputs | |
| Number of ESRD patients in plan | 500 |
| Percentage on phosphate binders | 85% |
| Utilization and cost inputsa | |
| Average number of dialysis sessions per month | 11.95 |
| Commercial reimbursement for dialysis session | US$400.00 |
| Average per session epoetin alfa dose per patient | 5217 units |
| Epoetin alfa payment per 1000 units | US$20.00 |
| Average per session IV iron dose per patient | 15 mg |
| Expected dose reduction in epoetin alfa and IV iron with ferric citrateb | |
| Mean reduction in epoetin alfa dose per session | 500.2 units |
| Mean reduction in IV iron dose per session | 5.79 mg |
Estimated reductions in epoetin alfa and IV iron use associated with ferric citrate were derived directly from mean values determined by Bond et al:15 these average values were not representative of all 1983 patients studied in the analysis. The commercial payments for dialysis, epoetin alfa, and IV iron were all calculated as two times the wholesale acquisition cost. In constructing the cost-offset model, the 2010 Red Book™16 (reference manual for pricing and product information on more than 160,000 prescription and over-the-counter items) was used to determine the costs of ESAs and IV iron.
Model outputs
The model provided estimates for the average monthly incremental cost-offset for epoetin alfa and IV iron for patients treated with ferric citrate compared to those treated with currently available phosphate binders and the total cost-offset for hemodialysis for patients with ESRD when treated with ferric citrate compared to the currently available phosphate binders.
Monte Carlo simulations
Monte Carlo simulations were used to address the high uncertainty of the cost-offset model parameters using @Risk Software (v 5.0; Palisade Corporation, Ithaca, NY, USA). Monte Carlo simulation works by substituting a range of values – a probability distribution – for model variables. In a Monte Carlo simulation, calculations are performed on more than 10,000 iterations, with each calculation performed using a different set of random values from the probability functions. By using mean values and approximately 10% standard deviations for model input variables, simulations were used to derive 90% confidence intervals for the potential annual cost savings with ferric citrate both monthly and annually.
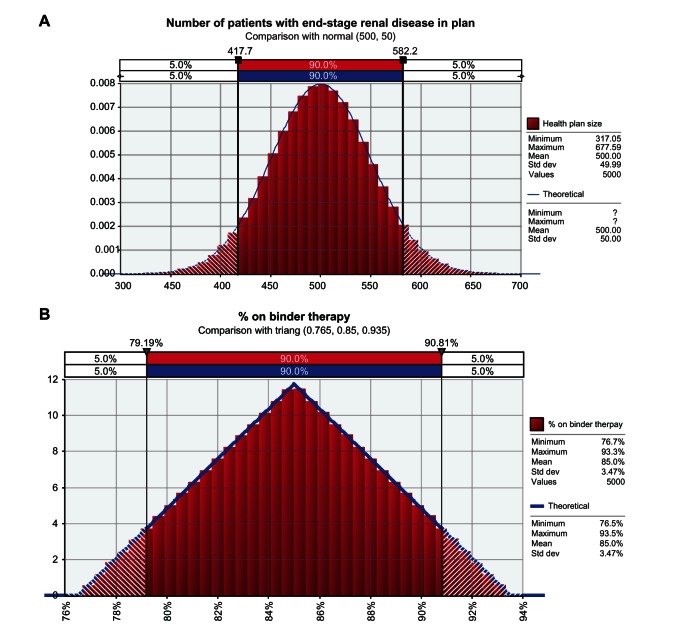
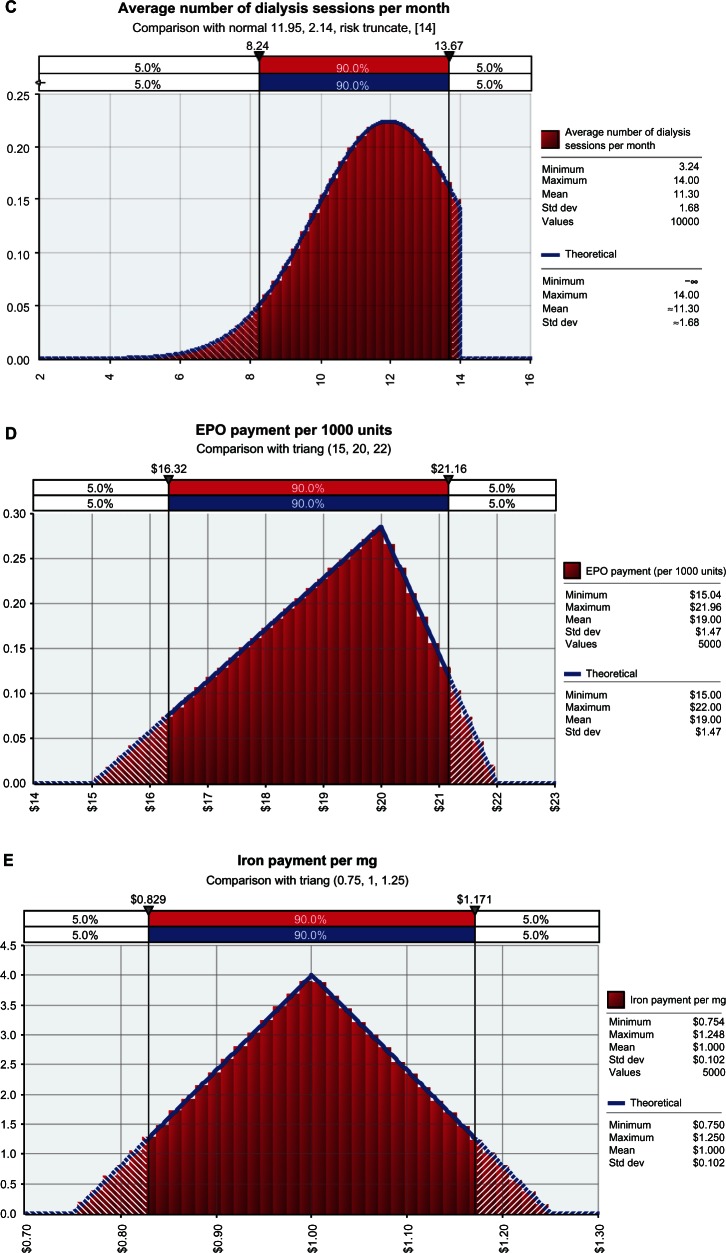
The Monte Carlo simulations used varying base model values and distributions (Figure 1). Model parameters include the number of ESRD patients in the health plan ([normal distribution] mean, 500; standard deviation, 50); percentage of patients on binder therapy ([triangle distribution] mean, 85%; minimum, 76.5%; maximum, 93.5%); estimated cost for dialysis ([normal distribution] mean, US$400; standard deviation, US$80); estimated payment per 1000 units of epoetin alfa or ESA ([triangle distribution] mean, US$20; minimum, US$15; maximum, US$22); and estimated payment per mg of IV iron ([triangle distribution] mean, US$1; minimum, US$0.75; maximum, US$1.25). Regarding the average number of dialysis sessions provided each month to each patient, a normal distribution was selected with a 14-session upper limit (no lower limit) with a mean of 11.95 sessions per month (standard deviation, 2.14). For Monte Carlo simulations performed for the analyses presented here, the model was repeated for no less than 5000 iterations, and as many as 10,000, as specified.
Figure 1.
Base model values and distributions for different model parameters used in the Monte Carlo simulations. (A) the number of patients with end-stage renal disease in the plan, comparison with normal (500, 50) (B) percent on binder therapy; comparison with triang (0.765, 0.85, 0.935). (C) Average number of dialysis sessions per month; comparison with normal (11.95, 2.14, risk truncate, [14]). (D) EPO payment per 1000 units; comparison with triang (15, 20, 22). (E) Iron payment per mg; comparison with triang (0.75, 1, 1.25).
Note: All figures are in US dollars.
Abbreviations: EPO, epoetin alfa; std dev, standard deviation; triang, triangle distribution.
Sensitivity analysis was conducted using Monte Carlo simulation. The output of the Monte Carlo simulation is aggregated, and the range of possible alternatives is reported and displayed graphically.
Results
Our model showed substantial reductions in the costs of ESA and IV iron when ferric citrate was compared to other phosphate binders (Table 2). Per 500 ESRD patients covered, the total monthly cost of ESA to the health plan was reduced by almost US$50,808 when using ferric citrate, an 8.15% relative reduction in epoetin alfa cost. Similarly, the total monthly cost of IV iron to the plan was reduced by US$29,406 with ferric citrate, reducing IV iron costs by 33.2%.
Table 2.
Total monthly costs to plan for 500 ESRD patients treated with either ferric citrate or comparator phosphate binders
| Total monthly costa
|
Monthly incremental cost | ||
|---|---|---|---|
| Ferric citrate | Other phosphate binders | ||
| Dialysis cost | US$2,390,000 | US$2,390,000 | – |
| Epoetin alfa cost | US$572,600 | US$623,408 | US$50,808 |
| IV iron cost | US$59,089 | US$88,495 | US$29,406 |
| Total monthly cost | US$3,021,689 | US$3,101,903 | US$80,214 |
| Monthly cost per ESRD patient | US$6043 | US$6203 | US$160 |
Notes:
Default input parameters used as described in Table 1; all figures are in US dollars
Abbreviations: ESRD, end-stage renal disease; IV, intravenous.
When incorporated into the total monthly cost of dialysis for patients with ESRD, the overall cost of dialysis care for the plan decreased from US$3,101,903 per year with currently available phosphate binders to US$3,021,689 per year with ferric citrate (Table 2). The estimated cost-offset of US$160 per ESRD patient per month translated into a relative reduction in cost of 2.59%.
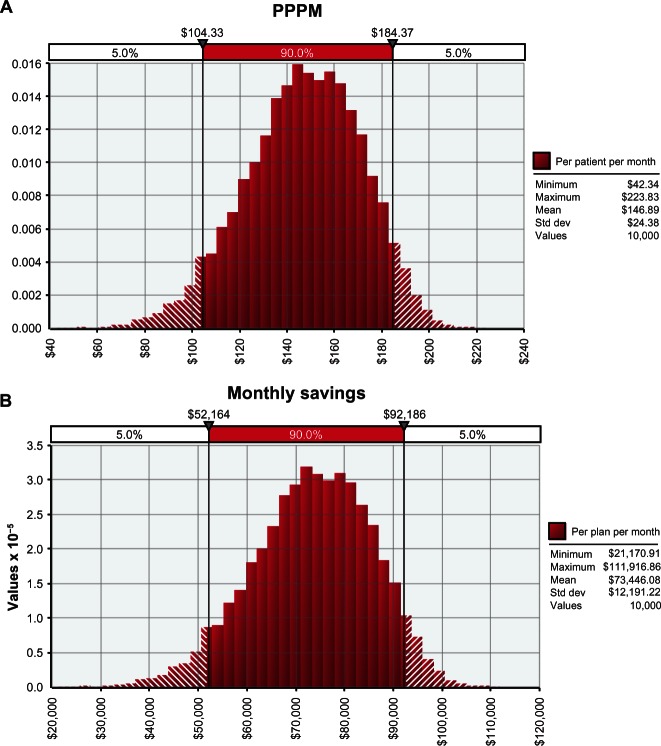
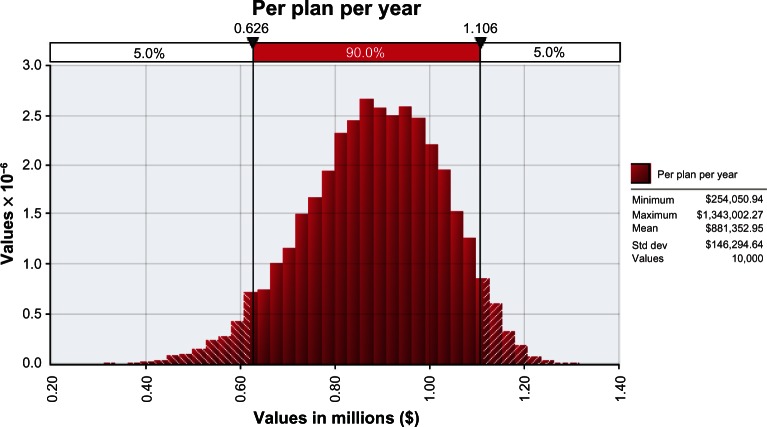
The Monte Carlo simulation showed that for each patient with ESRD, a managed care organization will likely save between US$104 and US$184 (90% confidence interval) per month with ferric citrate use (Figure 2). These savings translated into a monthly savings of between US$52,164 and US$92,186 (90% confidence interval) per 500 ESRD patients when ferric citrate was compared to other conventional phosphate binders (Figure 2). The monthly model input variables were projected out to determine annual cost estimates. An additional Monte Carlo simulation demonstrated (at 90% probability) that a provider serving 500 dialysis patients could save between US$626,000 and US$1,106,000 annually with the use of ferric citrate (Figure 3).
Figure 2.
Monte Carlo simulations of (A) cost savings per patient per month and (B) total monthly savings with ferric citrate.
Note: All figures are in US dollars.
Abbreviations: PPPM, per patient per month; std dev, standard deviation.
Figure 3.
Monte Carlo simulations of annual savings with ferric citrate.
Note: All figures are in US dollars.
Abbreviation: std dev, standard deviation.
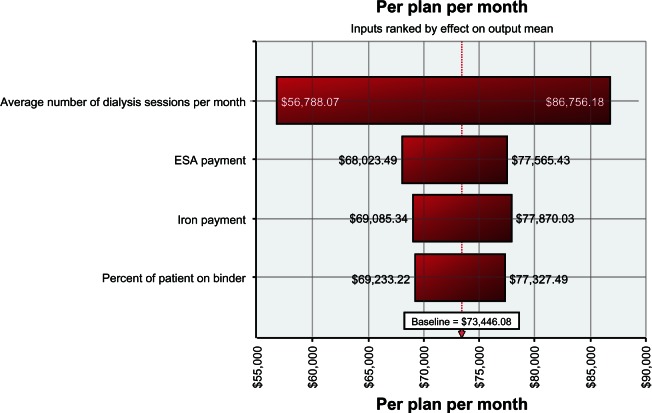
Sensitivity analysis demonstrated that this cost-offset model is most sensitive to the number of dialysis sessions per month, clinic payments for ESA and IV iron (cost), and proportion of ESRD patients on phosphate binder therapy (Figure 4). These factors contributed most to the cost of dialysis bore by the insurer.
Figure 4.
Sensitivity analysis.
Note: All figures are in US dollars.
Abbreviation: ESA, erythropoiesis-stimulating agent.
Discussion
The majority of patients undergoing dialysis are treated with phosphate binders, ESAs, and IV iron. These agents account for a large proportion of outpatient dialysis treatments costs.
The use of ferric citrate, a novel phosphate binder with an iron component, was found to reduce utilization of ESA and IV iron in clinical trials.11,13,14 These findings build upon the results of another study demonstrating that nephrologists respond to increases in iron measurements by decreasing ESA and IV iron dosage.15
To our knowledge, no similar cost-offset model has been created to consider the costs of phosphate binders or any CKD-MBD medication used for the treatment of dialysis patients. In the model that we present, the reduction in ESA and IV iron use in response to ferric citrate could translate into substantial cost savings. Indeed, the Dialysis Patients’ Response to IV Iron with Elevated ferritin (DRIVE) study has already demonstrated that increasing serum ferritin and TSAT reduces ESA use and cost.17–19 The base case cost-offset model described here (using default inputs) suggests a cost savings of US$1920 per ESRD patient per year, or approximately US$960,000 for the treatment of 500 ESRD patients per year, when ferric citrate is compared to other phosphate binders. Monte Carlo simulations of 10,000 model outputs suggest that the monthly savings for a plan serving 500 ESRD patients might range between US$52,164 and US$92,186 and between US$626,000 and US$1,106,000 annually – a finding that is in general agreement with the base case model cost-offset estimates. It should be noted that this cost-offset model was constructed with US physician prescription behavior data involving the brand name ESA Epogen® (epoetin alfa; Amgen Inc, Thousand Oaks, CA, USA). These cost-offset estimations do not consider potential savings available with the administration of ferric citrate and other ESAs such as Aranesp® (darbepoetin alfa; Amgen); Omontys® (peginesatide; Takeda Pharmaceutical Company Limited, Osaka, Japan), which was not available for prescription at the time of this analysis; or biosimilar ESAs, which may soon be available in the US. Potential cost savings could be more or less with the use of ferric citrate, depending on physician ESA-dosing practices and the prices for ESAs negotiated by the managed care organization. Our model supports significant cost savings with the use of ferric citrate to treat ESRD patients with hyperphosphatemia from the perspective of a managed care organization operated in the US but might also apply outside the US.
This economic analysis is based on several assumptions, such as equivalence in efficacy, cost neutrality, and equivalent dosing. Corrections for these assumptions may reduce or increase the cost-savings estimates. The input parameters of the model can also be adjusted to more accurately reflect the cost savings for a dialysis facility. For example, the analyses and potential cost savings in this model are computed based on the assumption that all patients are switched from other comparator phosphate binders to ferric citrate; the model can be modified to reflect the proportion of patients switching to ferric citrate. Similarly, the model can be tailored to include the actual reductions in the use of ESA and IV iron for each practice. The Monte Carlo simulations described in this manuscript are based on randomly selected input values from a defined distribution that may not be representative of all health care plans; the model can be adjusted to include a distribution to more accurately reflect the patient population treated at each facility.
There are a number of issues that should be considered in our interpretation of the cost-offset model estimations. The data generated here were created using defined input settings for the cost-offset model. Potential managed care plan savings could be more or less, depending on these particular assumptions.
In comparing potential cost savings and actual cost savings, it should be noted that estimates for cost savings are dependent on the assumption that full reimbursement is possible; providers of medical services often do not recognize complete reimbursement of costs. Another possible confounder regarding estimates of cost savings is that calculations for the reduced administration of ESA and IV iron as a result of non-treatment related increases in iron storage measures have not been measured since the June 2011 change to FDA-approved ESA labels, which suggests dosing to a target hemoglobin level of <11 g/dL.20 That label change will influence ESA-dosing trends and likely reductions in ESA use.
Postmarketing studies have examined the cost effectiveness of phosphate binders, analyzing acquisition costs and the costs of vascular complications and health care resource utilization.21,22 The cost-offset model we present here suggests yet another method with which to evaluate phosphate binders and treatment costs – through the potential for reduced ESA and IV iron utilization in the dialysis clinic. Further studies, including long-term analyses, will be needed to demonstrate that our cost-offset model is accurate and that potential reduced dosing of anemia medications with ferric citrate provides benefits to patients.
Conclusion
The use of ferric citrate as a phosphate binder has the potential to reduce utilization of anemia management drugs, such as epoetin alfa and IV iron, thereby reducing the cost of dialysis care. This cost-offset model shows that the use of ferric citrate as a preferred phosphate binder can result in substantial cost savings to the payer and help to reduce the economic burden of treating patients with ESRD from a managed care perspective.
Acknowledgments
We thank teammates at DaVita Clinical Research (DCR) for providing technical support for this research project. We thank Supriya Srinivasan, PhD and Donna Jensen, PhD for medical writing and editorial support.
Footnotes
Disclosure
Results from the analysis were presented in part at the National Kidney Foundation’s spring meeting held May 9–13, 2012, in Washington, DC, USA and the North American annual meeting of the International Society for Pharmacoeconomics and Outcomes Research held June 2–6, 2012, in Washington, DC, USA. This work was conducted at DCR, Inc, a wholly owned subsidiary of DaVita, Inc. This study was sponsored by Keryx Biopharmaceuticals, Inc. The authors report no other conflicts of interest in this work.
References
- 1.United States Renal Data System The United States Renal Data System 2011 Annual Data Report: Atlas of End-Stage Renal Disease in the United States Minneapolis, MN: United States Renal Data System; 2011Available from http://www.usrds.org/atlas11.aspxAccessed May 15, 2011 [DOI] [PubMed] [Google Scholar]
- 2.Rettig RA. Special treatment – the story of Medicare’s ESRD entitlement. N Engl J Med. 2011;364(7):596–598. doi: 10.1056/NEJMp1014193. [DOI] [PubMed] [Google Scholar]
- 3.Centers for Medicare and Medicaid Services (CMS), HHS Medicare program; end-stage renal disease prospective payment system and quality incentive program; ambulance fee schedule; durable medical equipment; and competitive acquisition of certain durable medical equipment prosthetics, orthotics and supplies. Final rule. Fed Regist. 2011;76(218):70228–70316. [PubMed] [Google Scholar]
- 4.Kalantar-Zadeh K, Gutekunst L, Mehrotra R, et al. Understanding sources of dietary phosphorus in the treatment of patients with chronic kidney disease. Clin J Am Soc Nephrol. 2010;5(3):519–530. doi: 10.2215/CJN.06080809. [DOI] [PubMed] [Google Scholar]
- 5.Dusso A, González EA, Martin KJ. Vitamin D in chronic kidney disease. Best Pract Res Clin Endocrinol Metab. 2011;25(4):647–655. doi: 10.1016/j.beem.2011.05.005. [DOI] [PubMed] [Google Scholar]
- 6.Kidney Disease: Improving Global Outcomes (KDIGO) CKD-MBD Work Group KDIGO clinical practice guideline for the diagnosis, evaluation, prevention, and treatment of Chronic Kidney Disease-Mineral and Bone Disorder (CKD-MBD) Kidney Int Suppl. 2009;(113):S1–S130. doi: 10.1038/ki.2009.188. [DOI] [PubMed] [Google Scholar]
- 7.National Kidney Foundation K/DOQI clinical practice guidelines for bone metabolism and disease in chronic kidney disease. Am J Kidney Dis. 2003;42(4 Suppl 3):S1–S201. [PubMed] [Google Scholar]
- 8.KDOQI. National Kidney Foundation KDOQI Clinical Practice Guidelines and Clinical Practice Recommendations for Anemia in Chronic Kidney Disease. Am J Kidney Dis. 2006;47(5 Suppl 3):S11–S145. doi: 10.1053/j.ajkd.2006.03.010. [DOI] [PubMed] [Google Scholar]
- 9.Yang WC, Yang CS, Hou CC, Wu TH, Young EW, Hsu CH. An open-label, crossover study of a new phosphate-binding agent in haemodialysis patients: ferric citrate. Nephrol Dial Transplant. 2002;17(2):265–270. doi: 10.1093/ndt/17.2.265. [DOI] [PubMed] [Google Scholar]
- 10.Niecestro R, Chan K, Town W. A Phase II, randomized, double-blind, placebo-controlled dose ranging study of ferric citrate on serum phosphate levels in ESRD patients. J Am Soc Nephrol. 2006;17:76A. [Google Scholar]
- 11.Sinsakul M, Korbet S, Green T, Sika M, Lewis J. Iron absorption with higher doses of ferric citrate in controlling serum phosphorus in endstage renal disease; Proceedings of the 2010 Spring Clinical Meetings of the National Kidney Foundation; April 13–17, 2010; Orlando, FL, USA. [Google Scholar]
- 12.Sinsakul M, Korbet S, Green T, Sika M, Lewis J. The safety and tolerability of higher doses of ferric citrate in controlling serum phosphate in end-stage renal disease patients; Proceedings of the 2010 Spring Clinical Meetings of the National Kidney Foundation; April 13–17, 2010; Orlando, FL, USA. [Google Scholar]
- 13.Niecestro R, Chiang SS, Chiang C, Chiang M, Town W. Long-term use of ferric citrate in end-stage renal disease patients; Proceedings of the 2010 Spring Clinical Meetings of the National Kidney Foundation; April 13–17, 2010; Orlando, FL, USA. [Google Scholar]
- 14.Sika M, Sinsakul MV, Niecestro RM, Chiang SS. Prolonged use of ferric citrate as a phosphate binder reduces intravenous iron use in patients with end-stage renal disease. J Am Soc Nephrol. 2010;21:783A. [Google Scholar]
- 15.Bond TC, Rubin J, Wang S, Niecestro RN, Poradosu E, Mayne TJ. Physician reaction to spontaneous rises in transferrin saturation and serum ferritin levels in end stage renal disease patients. J Am Soc Nephrol. 2011;22:728A. [Google Scholar]
- 16.The Red Book Truven Health Analytics; New York, NY: http://www.redbook.com/redbook/Accessed May 24, 2011 [Google Scholar]
- 17.Kapoian T, O’Mara NB, Singh AK, et al. Ferric gluconate reduces epoetin requirements in hemodialysis patients with elevated ferritin. J Am Soc Nephrol. 2008;19(2):372–379. doi: 10.1681/ASN.2007050606. [DOI] [PMC free article] [PubMed] [Google Scholar]
- 18.Coyne DW, Kapoian T, Suki W, et al. DRIVE Study Group Ferric gluconate is highly efficacious in anemic hemodialysis patients with high serum ferritin and low transferrin saturation: results of the Dialysis Patients’ Response to IV Iron with Elevated Ferritin (DRIVE) Study. J Am Soc Nephrol. 2007;18(3):975–984. doi: 10.1681/ASN.2006091034. [DOI] [PubMed] [Google Scholar]
- 19.Pizzi LT. Economic considerations in a changing anemia environment. Am J Kidney Dis. 2008;52(Suppl 6):S29–S33. doi: 10.1053/j.ajkd.2008.09.001. [DOI] [PubMed] [Google Scholar]
- 20.Epogen (epoetin alfa) [package insert] Thousand Oaks, CA: Amgen, Inc; 2011. [Google Scholar]
- 21.St Peter WL, Fan Q, Weinhandl E, Liu J. Economic evaluation of sevelamer versus calcium-based phosphate binders in hemodialysis patients: a secondary analysis using centers for Medicare and Medicaid services data. Clin J Am Soc Nephrol. 2009;4(12):1954–1961. doi: 10.2215/CJN.04100609. [DOI] [PMC free article] [PubMed] [Google Scholar]
- 22.Kakuta T, Tanaka R, Hyodo T, et al. Effect of sevelamer and calcium-based phosphate binders on coronary artery calcification and accumulation of circulating advanced glycation end products in hemodialysis patients. Am J Kidney Dis. 2011;57(3):422–431. doi: 10.1053/j.ajkd.2010.10.055. [DOI] [PubMed] [Google Scholar]


