Abstract
Electrical muscle stimulation demonstrates potential for preventing muscle atrophy and for restoring functional movement after spinal cord injury (SCI). Control systems used to optimize delivery of electrical stimulation protocols depend upon the algorithms generated using computational models of paralyzed muscle force output. The Hill-Huxley-type model, while being highly accurate, is also very complex, making it difficult for real-time implementation. In this paper, we propose a Wiener-Hammerstein system to model the paralyzed skeletal muscle under electrical stimulus conditions. The proposed model has substantial advantages in identification algorithm analysis and implementation including computational complexity and convergence, which enable it to be used in real-time model implementation. Experimental data sets from the soleus muscles of fourteen subjects with SCI were collected and tested. The simulation results show that the proposed model outperforms the Hill-Huxley-type model not only in peak force prediction, but also in fitting performance for force output of each individual stimulation train.
1. Introduction
After spinal cord injury (SCI), the loss of volitional muscle activity triggers a range of deleterious adaptations. Muscle cross-sectional area declines by as much as 45% in the first 6 weeks after injury, with further additional atrophy occurring for at least 6 months [1]. Muscle atrophy impairs weight distribution over bony prominences, predisposing individuals with SCI to pressure ulcers, a potentially life-threatening secondary complication [2]. The diminution of muscular loading through the skeleton precipitates severe osteoporosis in paralyzed limbs. The lifetime fracture risk for individuals with SCI is twice the risk experienced by the non-SCI population [3]. Rehabilitation interventions to prevent post-SCI muscle atrophy and its sequel are an urgent need.
Functional electrical stimulation (FES) after SCI is an effective method to induce muscle hypertrophy [4, 5], fiber type and metabolic enzyme adaptations [6, 7], and improvements in torque output and fatigue resistance [8-10]. New evidence suggests that an appropriate longitudinal dose of muscular load can be an effective anti-osteoporosis countermeasure [8, 11, 12]. Electrical muscle stimulation also has potential utility for restoration of function in tasks such as standing, reaching, and ambulating. The myriad applications for electrical stimulation after SCI have created a demand for control systems that adjust stimulus parameters in real-time to accommodate muscle output changes (potentiation, fatigue) or inter-individual force production differences. To facilitate the refinement of control system algorithms, mathematical models of muscle torque output are continuously being developed. To most successfully adapt stimulus parameters to real-time muscle output changes, an accurate and easy-to-implement model is essential.
Over the last decades, researchers have developed a number of muscle models aimed at predicting muscle isometric force output [13-16]. The Hill-Huxley-type model [15] is the most advanced and accurate mathematical model put forward to date [17, 18]. However, its complexity undermines its usefulness for on-line identification and real-time implementation for control. Identification of a Hill-Huxley-type model is non-trivial because it is time-varying, high dimensional and nonlinear. Local minimum versus global minimum is always a difficult issue, and a user must tune identification algorithm parameters patiently (including the initial estimate) in order to have a good result. FES fatigue models have been also developed [19-21] based on the Hill-Huxley-type model for individual stimulation trains. Due to the structural complexity and convergence issues, the fatigue model is identified off-line, which is not suitable for applications that require real-time adaptations.
Hunt and his colleagues [22] proposed a Hammerstein system for non-fatigue force modeling from signal processing point of view, but the model was deemed inadequate for muscle modeling. By examining the experimental data sets and the system, we noted two problems. First, a linear block prior to the nonlinear block was missing and secondly, the static nonlinearity seemed suboptimal. To that end, we have proposed a Wiener-Hammerstein model for modeling paralyzed skeletal muscle dynamics under electrical stimulation [23].
In this paper, we extend the model to both fatigue and non-fatigue cases. By using actual soleus force data from fourteen subjects with SCI, we demonstrate that the advantages of the proposed model over previous ones are theoretically justified and numerically verified.
2. Material and Methods
A typical electrical stimulation and the corresponding muscle force responses are shown in Fig. 1. The electrical stimulation pattern is composed of a number of trains (124 trains in Fig. 1) denoted by pulses and the corresponding forces output is represented by thick curves. We observe that the peak force of each train decreases as the number of the trains increases, though the input stimulation pattern remains the same, a phenomenon referred to as fatigue. The purpose of the modeling is to find a mathematical model that describes force output under the given stimulation pattern for each individual train and also captures the fatigue phenomenon.
Fig. 1.
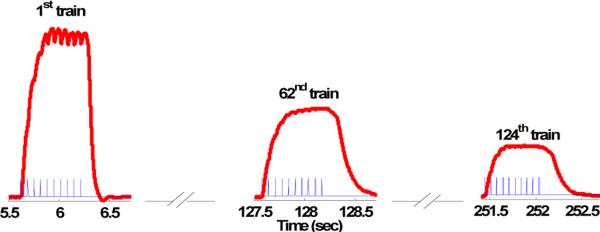
Force responses (thick curves) to the stimulation pulse (thin pulses) for subject 1. The muscle was stimulated by a sequence of trains with duration of 2 seconds for total 124 trains. Each train is composed of 10-pulses with 15 Hz frequency followed by a resting period of 1337ms. The muscle fatigue effect is clearly shown through the reduced peak force response of the 62nd and 124th train.
2.1 The Hill-Huxley-Type Fatigue Model
The Hill-Huxley-type Model [13, 19] is the most accurate model in the literature to describe the isometric muscle force during non-fatigue and fatigue conditions and is given by a set of equations (1) - (5).
| (1) |
| (2) |
| (3) |
| (4) |
| (5) |
Equation (1) and (2) describe the stimulated muscle behavior for each individual stimulation train, while Equations (3) - (5) govern the fatigue effect via varying the parameter A, R0 and τc. In Equation (1) and (2), ti is the time of the ith stimulation input and CN is the (internal) state variable, while A, and R0 are gains, and y(t) is the force output and τ1, τ2, and τc are the time constants. Note no actual input amplitude is directly used but only the input time sequence ti is used. The effect of the input amplitude is automatically adjusted by the parameters Ri and τc. In Equations (3)-(5), αA, αR0 and ατc are decaying parameters and τfat is recovery rate. These four parameters control the fatigue model. Arest, R0,rest and τc,rest are the parameter values at the initial (non-fatigue) stage which have to be identified from the non-fatigue model (1) and (2). Note that output force is involved as a feedback in Equations (3) - (5).
To identify the Hill-Huxley-type model, an offline multi-step method is used [19]. First, it needs to fix τc = 0.02 (seconds) to obtain the other two time constants τ1 and τ2, which are fixed at the obtained value in the next step; then parameters A, R0, and τc will be identified for each individual stimulation train. The last step is to derive the fatigue parameters αA, αR0, ατc and τfat by using the actual force output. This procedure is time-consuming and has to be done offline due to the complexity of the model and algorithm which cause local minimum problems.
2.2. The Wiener-Hammerstein Fatigue Model
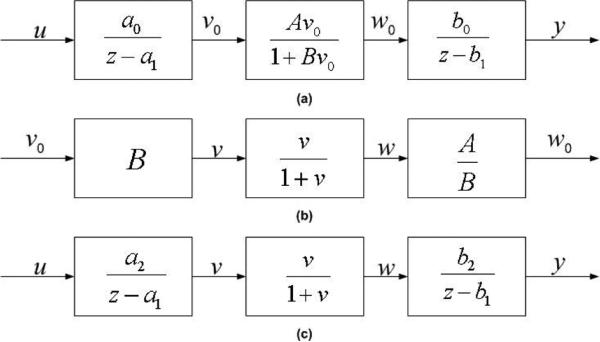
The proposed Wiener-Hammerstein model for single stimulation train is shown in Fig. 2 (a) with the nonlinearity , where B and A are unknown parameters which are adjusted for each individual subject. The system is in the discrete time domain for easy use of digital computers. The input u(kT) is the electrical stimulus (in volts) at time kT where T (=0.2ms in the paper) is the sampling interval and the output y(kT) is the muscle force at time kT. The internal signals, v(kT) and w(kT), are unavailable. The linear blocks prior and after the nonlinearity are the first order dynamic systems. The Wiener-Hammerstein model resembles the structure of the Hill-Huxley-type model but at a much reduced complexity. By decomposing middle block into three blocks (Fig. 2 (b)) and combining the gains B and A / B with a0 and b0, respectively, we obtain the following system in Fig. 2 (c), where a2 = a0B and . This normalization process greatly simplifies the identification problem, reducing the number of unknown parameters from six to four. Also, no additional sequence of ti's is needed, which is not the case for the Hill-Huxley-type model. It is important to comment that the system in Fig. 2 (c) is identical to the system in Fig. 2 (a), from input to output point of view, though the complexity is greatly reduced. The identification algorithm and convergence analysis of Wiener-Hammerstein model for single train (non-fatigue) are described in [23].
Fig. 2.
(a): Wiener-Hammerstein muscle model. (b): The middle nonlinear block can be decomposed into three parts. (c): The simplified Wiener-Hammerstein muscle model.
In this paper, we concentrate on the Wiener-Hammerstein fatigue model, which is developed upon the Wiener-Hammerstein model for a single stimulation train. From Fig. 2, the fatigue model is described by the following set of equations (6) - (9):
| (6) |
| (7) |
| (8) |
| (9) |
In Equation (6), b2 (p), b1 (p), and a1 (p) are the parameters of pth (p>2) train in the stimulation pattern, is the saturation function defined the same as in Fig. 2 (c), and yp (kT), up (kT) are the force output and stimulus input for the pth stimulation train. Note that in the fatigue model, we set a2 (p) = 1 for all stimulation trains because the fitting performance is not sensitive to a2 and it also reduces the number of parameters to three for each individual train. For stability reason, we set 0 ≤ b1 (p) ≤ 1 and 0 ≤ a1 (p) ≤ 1. Time varying nature of the parameters b2 (p), b1 (p) and a1 (p) reveals the muscle fatigue effects (Equations (7) - (9)). It is reasonable to assume that the parameters for each individual train are slow varying. Therefore, they can be predicted by the extrapolation of the previous two (or more) corresponding parameters. In Equations (7) - (9), αa1 (p), βa1 (p), αb1 (p), βb1 (p), αb2 (p) and βb2 (p) are the coefficients, and they are obtained through the iterative (least squares) method.
| (10) |
Similarly,
| (11) |
| (12) |
It is commented that to calculate αa1 (p), βa1 (p), αb1 (p), βb1 (p), αb2 (p) and βb2 (p), only the data up to p-1 trains are needed. This causal property is important which makes identification in real-time feasible.
2.3. Identification of the Wiener-Hammerstein system
Identification of the Wiener-Hammerstein non-fatigue model (single train stimulation model)
Before presenting the identification algorithm for the Wiener-Hammerstein fatigue model, we need to show the method to identify the Wiener-Hammerstein non-fatigue model or the parameters in Equation (6) for a given pth single stimulation train. Let θ (p) = [a1 (p), b1 (p), b2 (p)] denote the unknown system parameters for the given p. The purpose of this identification is to determine their estimates based on the available pth stimulation train input up (kT) and corresponding output yp (kT). Let ŷp (kT) be the predicted output calculated using the estimates
| (13) |
The identification problem is to find the best parameter set , which minimizes the sum of squared errors between the actual output yp (kT) and the predicted output ŷp (kT) of the proposed model
| (14) |
Obviously, (14) is a nonlinear optimization problem because of the involvement of the nonlinear function f and thus in general, local minimum is always a tough issue. However, we show that this is not a problem for the minimization of (14).
Suppose a value of â1 (p) is given, the internal signal can be calculated. Based on this internal signal and the model ŷp ((k + 1)T) = b̂1 (p) ŷp (kT) + b̂2 (p) ŵp (kT, â1 (p)), The optimal value of b̂1 (p) and b̂2 (p) with given value of â1 (p) are the solution of
| (15) |
By taking the derivative of the above cost function with respect to b̂2 (p) and setting it to zero yields
| (16) |
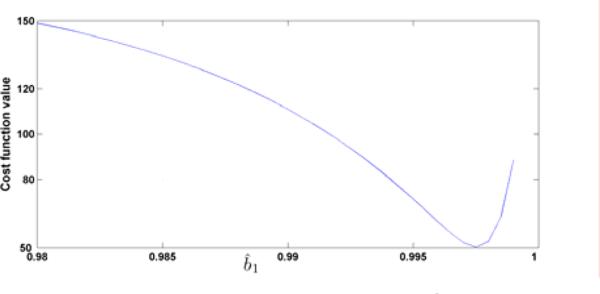
which is well defined provided . Now replacing b̂2 (p) by b̂1 (p), the optimization (15) becomes one-dimensional. By visualizing the cost function versus b̂1 (p) ∈ [0, 1] in Fig. 3, it is easily seen that there is only one (global) minimum in that range. Then, any nonlinear optimization algorithm can be used to find the global minimum. Finally, the optimal b̂2 (p) is obtained from b̂1 (p) as in (16). This process guarantees a unique optimal solution b̂1 (p) and b̂2 (p) for given â1 (p), written as
| (17) |
and the minimization problem (14) of three parameters becomes the minimization problem of one parameters
| (18) |
Fig. 3.
The cost function value vs. b̂1 with given â1 = 0.9.
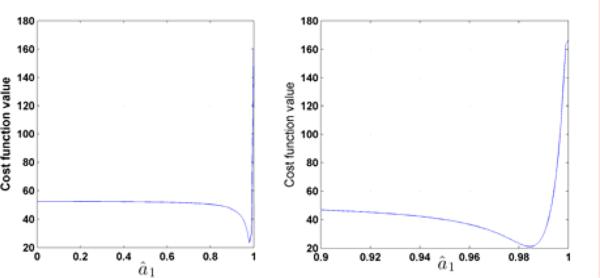
Although the minimization problem is simplified from (14) to (18), (18) is still nonlinear. However, it is one-dimensional and the cost function J versus â1 (p) can now be easily plotted and visualized as shown in Fig. 4. It is clearly shown that there is one (global) minimum for â1 ∈ [0, 1], precisely in the range â1 ∈ [0.98, 1]. In fact, for both minimization problems (16) and (18), we have found that, for all tested subjects, there is only one (local and global) minimum. Then any nonlinear optimization algorithm can be used to find the global minimum. We now summarize the identification algorithm for single train response (non-fatigue).
Fig. 4.
The cost function J(â1 (p), h(â1 (p)) vs. â1. The right plot is the zoom of the left plot with â1 ∈ [0.9, 1].
Single train (non-fatigue) model Identification algorithm
Given the data set up (kpT), yp (kpT) of pth stimulation train and kp = 1, 2, ···, Np,
For each â1 (p), use any nonlinear optimization algorithm to find the optimal b̂1 (p) and b̂2 (p) of (15).
Apply any nonlinear optimization algorithm to find the optimal â1 (p) ∈ [0, 1], and compute the corresponding b̂1 (p) and b̂2 (p).
In the simulations, we use the modified MATLAB program ”fminsearchbnd” to solve the nonlinear optimization problem for both Step 1 and Step 2. The MATLAB program ”fminsearchbnd” is Nelder-Mead simplex approach based and is able to deal with simple upper-bound and lower-bound constraints.
Identification of the Wiener-Hammerstein fatigue model
The following is the identification algorithm for the fatigue model.
Online fatigue model Identification algorithm
Given the data set up (kpT), yp (kpT), where p = 1, 2, ···, N is the stimulation train number and kp ∈ {1, 2, ···, Np} with Np being the total number of sampling data for pth stimulation train and N being the total stimulation train number.
Identify the single train (non-fatigue) models for the first ks stimulation trains respectively, which are assumed to be the non-fatigue case. Let p = ks.
Format the parameters â1 (p), b̂1 (p) and b̂2 (p) into A1, B1 and B2 as that in Equation (10) - (12). Apply Equation (10) - (12) to obtain the coefficients, αa1 (p), βa1 (p), αb1 (p), βb1 (p) and αb2 (p), βb2 (p).
Substituting the above coefficients into (7) - (9), we have predicted values of a1 (p + 1), b1 (p + 1) and b2 (p + 1) for the next stimulation train.
The force response ŷp + 1 (kp + 1T) of the next stimulation train is predicted by substituting a1 (p + 1), b1 (p + 1), and b2 (p + 1) into Equation (6).
Collect the actual input and force output for the (p + 1)th stimulation train.
If p = N – 1, stop. Otherwise let p = p + 1 and go back to Step 2.
3. Collection of SCI patient data
Fourteen subjects with chronic SCI (> 2 years) provided written informed consent, as approved by the University of Iowa Human Subjects Institutional Review Board. A detailed description of the stimulation and the force transducing systems has been previously reported [8-10] (Fig. 5). In brief, the subject sat in a wheelchair with the knee and ankle positioned at ninety degrees. The foot rested upon a rigid metal plate, and the ankle was secured with a soft cuff and turnbuckle connectors. Padded straps over the knee and forefoot ensured isometric conditions. The tibial nerve was supramaximally stimulated in the popliteal fossa using a nerve probe and a custom computer-controlled constant-current stimulator. Stimulation was controlled by digital pulses from a data-acquisition board (Metrabyte DAS 16F, Keithley Instruments Inc., Cleveland, OH) housed in a microcomputer under custom software control. The simulator was programmed to deliver a 10-pulse train (15 Hz; train duration: 667ms) every 2 seconds for total 124 trains. In this paper, we will only consider stimulation at 15 Hz. This is because that muscular overload (~60% of maximal torque) can be generated via 15 Hz supra-maximal stimulation [8] and eliciting muscle contractions with a 1 on: 2 off work-rest cycle (Burke like protocol) with a 15-Hz frequency induced significant low-frequency fatigue without compromising neuromuscular transmission [24]. The ensuing soleus isometric plantar flexion torques were measured via a load cell (Genisco AWU-250) positioned under the first metatarsal head. Torque was amplified 500 times (FPM 67, Therapeutics Unlimited) and input to a 12-bit resolution analog-to-digital converter at a sampling rate of 5000 samples per second. The digitized signals were analyzed with Datapac 2K2 software (RUN Technologies, Mission Viejo, CA).
Fig. 5.
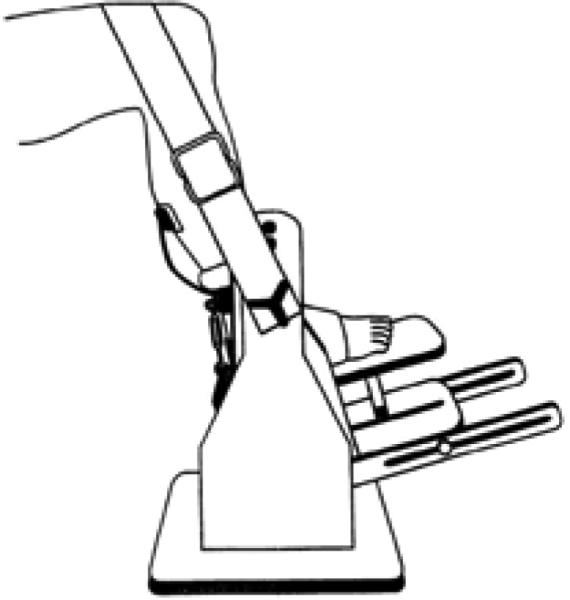
Schematic representation of the limb fixation and force measurement system
4. Results
We applied the proposed Wiener-Hammerstein model on fourteen subjects. To show the advantages of the proposed model, we compared its performance against the Hill-Huxley-type model. We tried to obtain the Hill-Huxley-type fatigue model using the algorithm presented in [19] which unfortunately did not perform well. Therefore, we identified the Hill-Huxley model train by train using Equation (1) and (2) (with optimal τ1, τ2 identified in advance), and denote the predicted force of each train by
| (19) |
with
| (20) |
The actual and the predicted peak forces for the Hill-Huxley-type model are defined as
| (21) |
where tp is the starting time of the pth train.
The performance of the proposed Wiener-Hammerstein model is compared against the performance of (19) - (21). It is important to note that the performance of (19) - (21) is better than the actual Hill-Huxley fatigue model (3) - (5). Hence, the comparison appears reasonable.
Similarly, the actual and the predicted peak force for the proposed model are defined
| (22) |
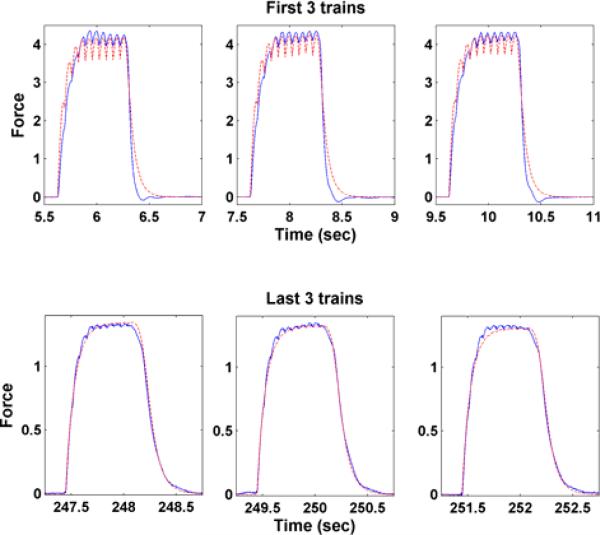
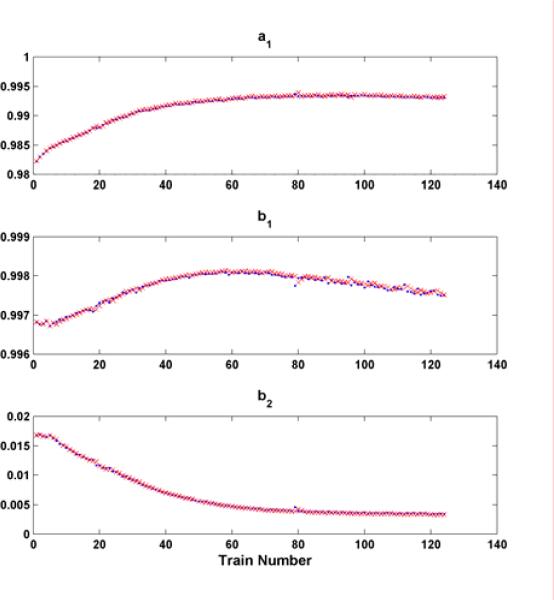
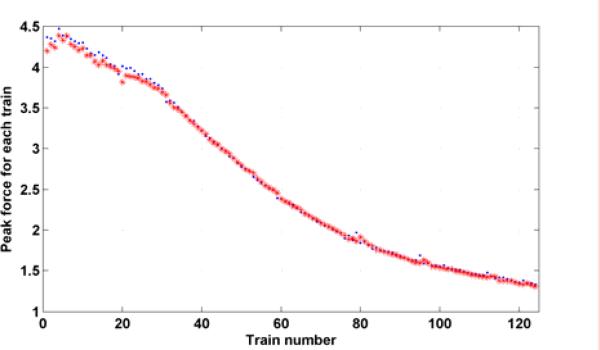
There are totally 124 trains and each train is composed of 10 pulses at 15 Hz with a resting period 1337 ms (1/3rd on: 2/3rds rest). Fig. 6 shows the fits for the first and the last three trains of the proposed model. It demonstrates the capability of fitting the actual force response very well. The predicted parameters (a1 (p + 1) b1 (p + 1) and b2 (p + 1)) (x) in the fatigue model based on (7) - (9) are shown in Fig. 7 along with the individually identified ones (dot) based on the data within individual trains. This illustrates the model proposed is capable of capturing the properties of individual trains as well as the fatigue phenomenon. Fig. 8 shows the predicted (star) and actual (dot) peak force for subject 1. They match well in both shape and magnitude.
Fig. 6.
The force response of the first (upper plots) and the last (bottom plots) three stimulation trains for actual output (solid) and the predicted output (dashed) for subject 1.
Fig. 7.
Wiener-Hammerstein model parameters a1, b1 and b2 for each stimulation train of the subject 1. x's denote the predicted parameter value and dots denote parameter value identified using non-fatigue model.
Fig. 8.
Peak force for each stimulation train of subject 1. Dots denote the actual peak force and stars denote the predicted peak force.
Force response for individual stimulation train
For each subject, the good-of-fitness (gof) is calculated for each train and their average is used for comparison, see Equation (23)
| (23) |
The average good-of-fitness for all 124 stimulation trains of all fourteen subjects are in Table 1. The proposed model substantially outperforms the Hill-Huxley-type model in gofave (0.9102 vs. 0.7805). Keep in mind that the proposed model is for the prediction and the Hill-Huxley-type model reflects only the off line identification result.
Table 1.
Average good-of-fitness (gofave) for each stimulation train and the correlation coefficient (R) and good-of-fitness (gofpk) for the actual and predicted peak force for fourteen subjects using the proposed fatigue model and Hill-Huxley-type model, respectively.
| Subject number | Wiener-Hammerstein model | Hill-Huxley-type model | ||||
|---|---|---|---|---|---|---|
| gofave | R | gofpk | gofave | R | gofpk | |
| 1 | 0.9363 | 0.9993 | 0.9532 | 0.8077 | 0.9978 | 0.7721 |
| 2 | 0.8938 | 0.9993 | 0.9331 | 0.7692 | 0.9989 | 0.8443 |
| 3 | 0.8889 | 0.9967 | 0.8375 | 0.8437 | 0.9971 | 0.519 |
| 4 | 0.8958 | 0.9976 | 0.8924 | 0.7826 | 0.9978 | 0.7481 |
| 5 | 0.9286 | 0.9997 | 0.9643 | 0.841 | 0.9993 | 0.8428 |
| 6 | 0.9212 | 0.9983 | 0.9212 | 0.8154 | 0.9994 | 0.8833 |
| 7 | 0.9187 | 0.9990 | 0.9337 | 0.8673 | 0.9982 | 0.9039 |
| 8 | 0.9223 | 0.9995 | 0.891 | 0.781 | 0.9952 | 0.5571 |
| 9 | 0.9217 | 0.9992 | 0.917 | 0.7311 | 0.9969 | 0.7216 |
| 10 | 0.9265 | 0.9994 | 0.9374 | 0.7734 | 0.9988 | 0.7558 |
| 11 | 0.9110 | 0.9982 | 0.8557 | 0.802 | 0.9924 | 0.22 |
| 12 | 0.8687 | 0.9975 | 0.7262 | 0.7889 | 0.9971 | 0.8284 |
| 13 | 0.9025 | 0.9993 | 0.8886 | 0.7249 | 0.9936 | 0.4065 |
| 14 | 0.9072 | 0.9996 | 0.9351 | 0.5992 | 0.9821 | 0.4535 |
| average | 0.9102 | 0.9988 | 0.8990 | 0.7805 | 0.9961 | 0.6755 |
Peak force
As for the prediction performance on the peak force, we use the correlation coefficient and good of fitness. The former is also used in [19] to show the correlation between the actual peak force and predicted peak force, which is defined as
| (24) |
where F̄pk and are the average of actual and predicted peak force for all stimulation trains, respectively. This measurement tells us how the predicted force correlates to the actual peak force of each individual train. A problem with the use of correlation coefficients is that it is unable to distinguish the discrepancy between the actual peak force and predicted peak force due to a DC shift or scaling. That is, the correlation is a measure of association and not agreement. For instance, the correlation coefficient could be close to one even though the actual peak force and predicted peak force differ substantially. Consequently, a very high correlation coefficient does not always imply a small error in predicting the actual force. A better criterion is the good-of-fitness, widely used in identification literature. Since we are more concerned about the peak force for each stimulation train during the FES, we want to know how well the predicted peak force fit the actual peak fore of each individual train defined by
| (25) |
Table 1 also shows the peak force correlation coefficient and good-of-fitness of the actual and predicted peak force for the proposed Wiener-Hammerstein fatigue model and the Hill-Huxley-type model. It is shown that the proposed fatigue model has a similar correlation coefficient to the Hill-Huxley-type individual model (0.9988 vs. 0.9916 in R). In terms of the gof, the proposed model outperforms the Hill-Huxley model substantially (0.8990 vs 0.6755 in gofpk).
Statistical analysis
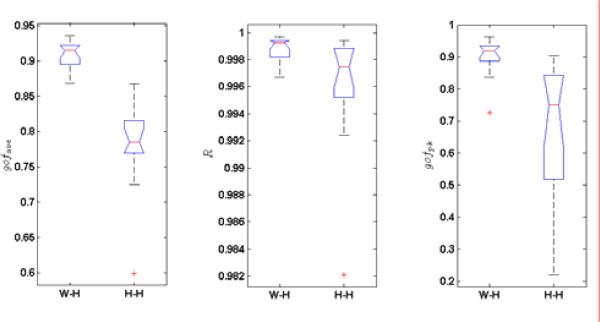
To compare the variability of the model, we use one-way analysis of the variance on the numbers in the Table 1. They are shown in Fig. 9. Not surprisingly, the p-value for gofave, R and gofpk, are 1.5×10⁻⁷, 3.7×10⁻² and 7×10⁻⁴, respectively. It simply means that W-H model has a significantly better fitting performance than the Hill-Huxley model for the obtained data sets.
Fig. 9.
Box plots of the gofave, R, and gofpk of fourteen subjects for Wiener-Hammerstein model (W-H) and Hill-Huxley-type (H-H) model, respectively.
5. Discussion and conclusions
During the simulation training for patients with SCI, patients’ muscles are easily fatigued due to the synchronizing recruitment mechanism of FES. The proposed Wiener-Hammerstein fatigue model predicts well not only the peak force tendency (high gofpk) but also the force output profile (high gofave) of the each individual stimulation train. However, this fatigue model is only tested on 15Hz stimulation and has not been tested on other frequency stimulations or hybrid stimulation frequencies, which will be addressed in subsequent experiments.
We emphasize that this fatigue model can be identified on-line because the proposed muscle model has a “global” optimum, which makes the model identification more efficient and causal. Conversely, the Hill-Huxley-type model is complex and there is no guarantee of obtaining the global optimum and is non-causal, i.e., the future data is required. Therefore, the identification procedure is time-consuming and it is not suitable for an on-line algorithm.
We developed a Wiener-Hammerstein fatigue model, which can be performed on-line to predict the peak force. The results show that the proposed model outperforms the Hill-Huxley-type model while retaining a more simplified solution. Indeed, the proposed paralyzed muscle fatigue model is very robust and has strong potential to be incorporated into a feedback controlled FES system. We emphasize the strengths of the model are that it is less complicated which affords the opportunity to be implemented in real-time. Our future goals are to analyze other stimulation protocols and embed the algorithm into a real-time feedback FES system.
Key Points.
Because of the simple structure of the proposed model and global optimum properties of the least squares (10) - (12), and (16) and (18)., this identification procedure is suitable for on-line identification, that is, identify the model for each simulation train and use those parameters to predict the force response for the next stimulation train.
In Equations (10) - (12), the identified parameters of the current and the previous 2 trains are used to obtain the model parameter of the next stimulation train. There exist many modifications. It is always a balance of accuracy, robustness and complexity.
The first ks trains are used to establish the initial fatigue model, and then the parameters, a1 (p), b1 (p) and b2 (p) are updated in real-time. The exact value of ks can be adjusted based on some criteria, for example, ks is the value that the fatigue phenomenon is initially observed.
Footnotes
Publisher's Disclaimer: This is a PDF file of an unedited manuscript that has been accepted for publication. As a service to our customers we are providing this early version of the manuscript. The manuscript will undergo copyediting, typesetting, and review of the resulting proof before it is published in its final citable form. Please note that during the production process errors may be discovered which could affect the content, and all legal disclaimers that apply to the journal pertain.
References
- 1.Castro MJ, Apple DF, Hillegass EA, Dudley GA. Influence of complete spinal cord injury on skeletal muscle cross-sectional area within the first 6 months of injury. European Journal of Applied Physiology & Occupational Physiology. 1999;86(1):350–358. doi: 10.1007/s004210050606. [DOI] [PubMed] [Google Scholar]
- 2.Shields RK, Dudley-Javoroski S. Musculoskeletal deterioration and hemicorporectomy after spinal cord injury. Physical Therapy. 2003;83(3):263–275. [PMC free article] [PubMed] [Google Scholar]
- 3.Vestergaard P, Krogh K, Rejnmark L, Mosekilde L. Fracture rates and risk factors for fractures in patients with spinal cord injury. Spinal Cord. 1998;36(11):790–796. doi: 10.1038/sj.sc.3100648. [DOI] [PubMed] [Google Scholar]
- 4.Mahoney ET, Bickel CS, Elder C, Black C, Slade JM, Apple D, Dudley GA. Changes in skeletal muscle size and glucose tolerance with electrically stimulated resistance training in subjects with chronic spinal cord injury. Arch. Phys. Med. Rehabil. 2005;86(7):1502–1504. doi: 10.1016/j.apmr.2004.12.021. [DOI] [PubMed] [Google Scholar]
- 5.Dudley GA, Castro MJ, Rogers S, Apple DF. A simple means of increasing muscle size after spinal cord injury: a pilot study. European Journal of Applied Physiology & Occupational Physiology. 1999;80(4):394–396. doi: 10.1007/s004210050609. [DOI] [PubMed] [Google Scholar]
- 6.Crameri RM, Weston A, Climstein M, Davis GM, Sutton JR. Effects of electrical stimulation-induced leg training on skeletal muscle adaptability in spinal cord injury. Scandinavian Journal of Medicine & Science in Sports. 2002;12(5):316–322. doi: 10.1034/j.1600-0838.2002.20106.x. 2002. [DOI] [PubMed] [Google Scholar]
- 7.Andersen JL, Mohr T, Biering-Sorensen F, Galbo H, Kjaer M. Myosin heavy chain isoform transformation in single fibres from m. vastus lateralis in spinal cord injured individuals: effects of long-term functional electrical stimulation (FES) Pflugers Archiv - European Journal of Physiology. 1996;431(4):513–518. doi: 10.1007/BF02191897. [DOI] [PubMed] [Google Scholar]
- 8.Shields RK, Dudley-Javoroski S. Musculoskeletal plasticity after acute spinal cord injury: Effects of long-term neuromuscular electrical stimulation training. Journal of Neurophysiology. 2006;95:2380–2390. doi: 10.1152/jn.01181.2005. [DOI] [PMC free article] [PubMed] [Google Scholar]
- 9.Shields RK, Dudley-Javoroski S. Musculoskeletal adaptation in chronic spinal cord injury: effects of long-term soleus electrical stimulation training. Journal of Neurorehabilitation and Neural Repair. 2007;21(2):169–179. doi: 10.1177/1545968306293447. [DOI] [PMC free article] [PubMed] [Google Scholar]
- 10.Shields RK, Dudley-Javoroski S, Littmann AE. Post-fatigue potentiation of paralyzed soleus muscle: Evidence for adaptation with long-term electrical stimulation training. Journal of Applied Physiology. 2006;101:556–565. doi: 10.1152/japplphysiol.00099.2006. [DOI] [PMC free article] [PubMed] [Google Scholar]
- 11.Shields RK, Schlechte J, Dudley-Javoroski S, Zwart BD, Clark SD, Grant SA, Mattiace VM. Bone mineral density after spinal cord injury: a reliable method for knee measurement. Arch. Phys. Med. Rehabil. 2005;86(10):1969–1973. doi: 10.1016/j.apmr.2005.06.001. [DOI] [PMC free article] [PubMed] [Google Scholar]
- 12.Dudley-Javoroski S, Shields RK. Case report: Dose estimation and surveillance of mechanical load interventions for bone loss after spinal cord injury. Physical Therapy. 2008;88:387–396. doi: 10.2522/ptj.20070224. [DOI] [PMC free article] [PubMed] [Google Scholar]
- 13.Ding J, Binder-Macleod SA, Wexler AS. Two-step, predictive, isometric force model tested on data from human and rat muscles. J. Appl. Physiol. 1998;85(6):2176–2189. doi: 10.1152/jappl.1998.85.6.2176. [DOI] [PubMed] [Google Scholar]
- 14.Ding J, Wexler AS, Binder-Macleod SA. A mathematical model that predicts the force-frequency relationship of human skeletal muscle. Muscle Nerve. 2002;26(4):477–485. doi: 10.1002/mus.10198. [DOI] [PubMed] [Google Scholar]
- 15.Bernotas BA, Patrick CE, Binder-Macleod CJ. A discrete-time model of electrically stimulated muscle. IEEE Trans. on Biomedical Engineering. 1986;33(9):829–838. doi: 10.1109/TBME.1986.325776. [DOI] [PubMed] [Google Scholar]
- 16.Bobet J, Stein RB. A simple model of force generation by skeletal muscle during dynamic isometric contractions. IEEE Trans. on Biomedical Engineering. 1998;45(8):1010–1016. doi: 10.1109/10.704869. [DOI] [PubMed] [Google Scholar]
- 17.Bobet J, Gossen ER, Stein RB. A comparison of models of force production during stimulated isometric ankle dorsiflexion in humans. IEEE Trans Neural Syst Rehabil Eng. 2005;13(4):444–451. doi: 10.1109/TNSRE.2005.858461. [DOI] [PubMed] [Google Scholar]
- 18.Frey Law LA, Shields RK. Predicting human chronically paralyzed muscle force: a comparison of three mathematical models. Journal of Applied Physiology. 2006;(100):1027–1036. doi: 10.1152/japplphysiol.00935.2005. [DOI] [PMC free article] [PubMed] [Google Scholar]
- 19.Ding J, Wexler AS, Binder-Macleod SA. A predictive model of fatigue in human skeletal muscles. Journal of Applied Physiology. 2000;89:1322–1332. doi: 10.1152/jappl.2000.89.4.1322. [DOI] [PubMed] [Google Scholar]
- 20.Ding J, Wexler AS, Binder-Macleod SA. A predictive fatigue model--I: Predicting the effect of stimulation frequency and pattern on fatigue. IEEE Trans. Neural Syst. Rehabil. Eng. 2002;10(1):48–58. doi: 10.1109/TNSRE.2002.1021586. [DOI] [PubMed] [Google Scholar]
- 21.Ding J, Wexler AS, Binder-Macleod SA. A predictive fatigue model--II: Predicting the effect of resting times on fatigue. IEEE Trans. Neural Syst. Rehabil. Eng. 2002;10(1):59–67. doi: 10.1109/TNSRE.2002.1021587. [DOI] [PubMed] [Google Scholar]
- 22.Hunt KJ, Munih M, Donaldson NN, Barr FM. Investigation of the Hammerstein hypothesis in the modeling of electrically stimulated muscle. IEEE Trans. on Biomed Eng. 1998;45(8):998–1009. doi: 10.1109/10.704868. [DOI] [PubMed] [Google Scholar]
- 23.Bai EW, Cai Z, Dudley-Javoroski S, Shields RK. Identification a Modified Wiener-Hammerstein System and Its Application in Electrically Stimulated Paralyzed Skeletal Muscle Modeling. Automatica. 2009;45:736–743. doi: 10.1016/j.automatica.2008.09.023. [DOI] [PMC free article] [PubMed] [Google Scholar]
- 24.Deluca C. Myoelectrical manifestations of localized muscular fatigue in human. CRC Crit. Rev. Biomed. Eng. 1984;11(4):251–279. [PubMed] [Google Scholar]


