Abstract
Powders composed of four morphologically different calcium phosphate particles were prepared by precipitation from aqueous solutions: flaky, brick-like, elongated orthogonal, and spherical. The particles were then loaded with either clindamycin phosphate as the antibiotic of choice, or fluorescein, a model molecule used to assess the drug release properties. A comparison was carried out of the comparative effect of such antibiotic-releasing materials on: sustained drug release profiles; Staphylococcus aureus growth inhibition; and osteogenic propensities in vitro. Raman spectroscopic analysis indicated the presence of various calcium phosphate phases, including monetite (flaky and elongated orthogonal particles), octacalcium phosphate (brick-shaped particles) and hydroxyapatite (spherical particles). Testing the antibiotic-loaded calcium phosphate powders for bacterial growth inhibition demonstrated satisfying antibacterial properties both in broths and on agar plates. All four calcium-phosphate-fluorescein powders exhibited sustained drug release over 21 days. The calcium phosphate sample with the highest specific surface area and the smallest, spherical particle size was the most effective in both drug loading and release, consequently having the highest antibacterial efficiency. Moreover, the highest cell viability, the largest gene expression upregulation of three different osteogenic markers – osteocalcin, osteopontin and Runx2 - as well as the least disrupted cell cytoskeleton and cell morphologies were also noticed for the calcium phosphate powder composed of smallest, spherical nanosized particles. Still, all four powders exerted a viable effect on osteoblastic MC3T3-E1 cells in vitro, as evidenced by both morphological assessments on fluorescently stained cells and measurements of their mitochondrial activity. The obtained results suggest that the nanoscale particle size and the corresponding coarseness of the surface of particle conglomerates as the cell attachment points may present a favorable starting point for the development of calcium-phosphate-based osteogenic drug delivery devices.
Keywords: Calcium Phosphate, Controlled Drug Delivery, Morphology, Osteomyelitis, Raman Spectroscopy, Staphylococcus aureus
Introduction
The prevalence of bone disease is expected to rise in the decades to follow.1 Osteomyelitis, that is, bone infection caused by various pathogens, many of which reside in healthy oral flora, affects 1 in 5000 people, mainly elderly and children, and its conventional treatments involve long-term antibiotic therapies coupled with surgical removal of portions of diseased or dead bony tissue.2, 3 While prolonged administration of antibiotics produces undesired effects following its nonlocal distribution in the body, significant bone loss requires the application of typically non-biodegradable extraneous implants to maintain the skeletal integrity of the affected area and/or minimize the effects of its unaesthetic disfigurement.4 To address this imperfect therapeutic approach, development of a material for simultaneous (a) sustained and localized delivery of antibiotics, and (b) induction of spontaneous regeneration of hard tissues affected by disease would be desirable and is what comprises the central subject of this study. Previously, we developed calcium-phosphate-based carriers for the local delivery and sustained release of antibiotics at different time scales.5, 6 Ensuring simultaneous bactericidal and osteoinductive properties of the drug/carrier composite is a prerequisite for its successful application in the treatment of osteomyelitis.
Optimization of particle properties for their most favorable interface with cells and tissues is of great interest for the biomedical community and a great challenge for the field of biomaterials. Alongside size, roughness, functionalization of the surface or zeta potentials, the particle morphology presents an important consideration in this respect, especially since it is known that different morphologies of the same chemical composition may trigger drastically different cell responses. For example, cylindrical zeolite particles of ~ 100 nm in size were shown to be markedly more toxic than cubic, cuboid or spherical ones.7 That elongated nanoparticles could be in general more toxic than spherical or orthogonal ones can be supported by the finding of markedly more reduced viability of cells treated with Ag wires (100 – 160 nm in diameter and the aspect ratio of 10 – 20) than those treated with spherical Ag particles.8 As for CAP, studies on growth inhibition and apoptosis in primary cultured rat osteoblasts concordantly suggested a greater harm done to the cells by the needle-shaped than by the spherical particles.9 The production of various inflammatory cytokines by human monocytes was also induced to a greater extent by the needle-shaped CAPs than by any other morphology, while different specific surface areas of CAPs did not have any effect.10 It has been similarly demonstrated that needleand plate-shaped particles are significantly more cytotoxic and conducive of inflammatory cytokine expression than spherical ones on BEAS-2B cells of bronchial epithelium and RAW 264.7 macrophages.11 In a different study, however, neither of the rod-, plate- or needle-shaped hydroxyapatite particles were shown to be toxic, at least up to the concentrations of 5 mg/ml, in the very same RAW 264.7 cultures12, suggesting that ultrafine topological features may be responsible for determining the viability of cell response as well as that narrow windows of particle dimensions may foster favorable cell-particle interactions, alongside other, nonmorphological factors. Such selective favoring of topographic features of specific dimensions by cells is now a well confirmed phenomenon.13–16 In this work, we expand our former studies with the aim to further optimize the osteogenic and antibiotic performance of CAPs as drug delivery carriers by synthesizing four different morphologies of their submicron-sized constituents and subjecting them to analyses of their (a) drug release profiles; (b) antibacterial activity against Staphylococcus aureus, the main causative agent of osteomyelitis; and (b) the osteoblastic cell response in vitro.
Materials and methods
Synthesis and characterization of clindamycin-containing calcium phosphate powders
Table 1 lists ionic concentrations and other conditions used in the synthesis of four different powders composed of calcium phosphate (CAP) particles of submicron dimensions. To prepare samples A – C, 100 ml solutions composed of Ca(NO3)2, NH4H2PO4 and urea were covered with aluminum foil to prevent evaporation, heated to 88 °C and then subjected to an ultrasound field using a Q700 QSonica ultrasonicator, a regular, ½’’ tip, the amplitude equal to 20 and pulse on/off time of 2/1 s for different processing periods (Table 1). The decomposition of urea17 at elevated temperatures proceeds according to Eq.1, yielding NH4OH as a product. The resulting gradual increase in pH has led to precipitation of one of the following phases: (a) anhydrous dicalcium phosphate, a.k.a. monetite (Eq.2; samples A and C), (b) octacalcium phosphate (Eq.3; sample B), or (c) hydroxyapatite (Eq.4; sample D).
| (Eq. 1) |
| (Eq. 2) |
| (Eq. 3) |
| (Eq. 4) |
Table 1.
Ionic parameters used in the preparation of four CAP powders composed of differently sized and shaped particles. Note that the concentrations of ionic precursors correspond to those in the resulting mixture. The concentrations in the separate solutions prior to their mixing are double the values given here.
| Sample | [Ca2+] (M) |
[HxPO43–x] (M) |
[CO(NH2)2] (M) |
T (°C) | Ultra- sonication |
Duration (h) |
Final pH |
Average particle dimensions (µm) |
Specific surface area (m2/g) |
Drug loading capacity µg/mg) |
|---|---|---|---|---|---|---|---|---|---|---|
| A | 0.01 | 0.005 | 0.02 | 88 | Yes | 3 | 5.5 | 3 × 1 × 0.1 | 8.7 | 0.7 |
| B | 0.01 | 0.04 | 0.02 | 88 | Yes | 3 | 4.5 | 2 × 2 × 0.2 | 4.8 | 0.6 |
| C | 0.01 | 0.06 | 0.02 | 88 | No | 2 | 4.1 | 2 × 0.2 × 0.05 | 19 | 0.9 |
| D | 0.05 | 0.03 | 0 | 25 | Yes | 0.25 | 10.4 | 0.02 | 230 | 1.0 |
After the reaction times ranging from 1 – 3 h, the samples were cooled down to room temperature and aged in air for 12 h. The precipitates were then sedimented in the centrifugal field (3500 rpm) for 5 min, separated from the supernatant and dried in a vacuum oven (p = - 20 mmHg) at 60 °C.
Sample D was prepared by adding 200 ml of the aqueous solution of NH4H2PO4 containing 12.5 ml 28 % NH4OH dropwise (13 ml/min) to the same volume of the aqueous solution of Ca(NO3)2 containing 25 ml 28 % NH4OH, vigorously agitated using the same ultrasonication conditions as noted above. After the addition of NH4H2PO4 was complete, the precipitate alongside its parent solution was left to age in atmospheric conditions for 12 h. After the given time, the precipitate was washed once with deionized (DI) H2O, centrifuged (5 min at 3500 rpm), and dried in a vacuum oven (p = - 20 mmHg) at 60 °C.
To load the powders with the antibiotic or a similarly sized fluorophore, the agitationassisted precipitation was followed by cooling down to room temperature, after which the volume of the suspension was divided to two parts. Clindamycin phosphate (CL; Tokyo Chemical Industry) in the amount of 100 mg was introduced to one part, while the other part had 0.2 mg fluorescein-Na (Sigma) added to it, after which the suspensions underwent a 12 h aging period, followed by centrifugation and drying.
The morphologies and dimensions of the obtained particles were assessed using a Carl Zeiss Ultra 55 field-emission scanning electron microscope (FE-SEM) at the voltage of 2 kV. All samples were sputtered with iridium (~ 3 nm) prior to observation. High-resolution transmission electron microscopy (HR-TEM) analysis was performed on an FEI monochromated F20 UT Tecnai microscope under the electron acceleration voltage of 200 kV. The phase composition of the powders was analyzed on a Renishaw inVia Reflex Raman microscope, in the high throughput mode, using low laser power of 2 – 5 mW, λ = 532 nm, the groove grating of 2400, and a 50x objective.
Drug release
Drug release experiments were conducted by immersing 1 mg of each fluorescein-loaded CAP powder in either 100 or 300 µl of 20 mM Tris/HCl (pH 7.4), and incubating it at room temperature under agitation on a shaker plate (60 rpm) for up to three weeks. In the former case (100 µl), the medium was sampled out in its entirety every 24 h and analyzed for fluorescence (Packard Fluorocount, λexcitation = 495 nm, λemission = 525 nm) convertible to the concentration of the released fluorophore, before being replaced with fresh medium to prevent its saturation. In the latter case (300 µl), 100 µl aliquots were sampled out and analyzed for fluorescence before being replaced with fresh medium. At the end of three weeks of release time, the remaining powders were dissolved in 20 mM HCl. The resulting fluorescence was measured and used to calculate the overall amount of the drug initially contained by the powders. The drug released at each time point was then normalized to the overall amount of drug released. Each sample was analyzed in triplicates and the fluorescence of each experimental replica was determined as the average of three independent measurements.
Bacterial culture
A single colony of Staphylococcus aureus (ATCC 25923) cultured on a blood agar plate over 48 hours was stabbed with a pipette tip, which was then placed in 5 ml of 37 mg/ml brain heart infusion (BHI) broth and kept on an incubator shaker (Innova 44) overnight at 37 °C and 225 rpm. The turbid broth was collected the following day and 8 nl of it was added to serially diluted samples containing different concentrations of different CL-loaded powders in 1 ml of 37 mg/ml BHI broth, for the purpose of determining the minimal inhibitory concentration (MIC) of the antibiotic-containing powders under the given analytical conditions. The given bacterial concentration (1:125, 000 of 5 ml 37 mg/ml BHI broth inoculated overnight with a single bacterial colony) was found to be equal to the standard concentration of 105 bacteria per ml after comparing the optical density at λ = 600 nm of a range of serially diluted bacterial broths with 0.5 M McFarland solution (equivalent to approximately 108 bacteria per ml) prepared by mixing 1 % BaCl2 solution and 1 % H2SO4 in the volume ratio of 1:200, respectively. The dilution yielding the same absorbance as that of 0.5 M McFarland solution was diluted 103 times to yield the standard bacterial concentration of 105 bacteria per ml. The series of samples was incubated overnight on the incubator shaker and visually analyzed the following day for their turbidity and the optical density at λ = 600 nm. Turbid broths indicated those in which the concentration of the antibiotic released from the CAP particles was insufficient to prevent the bacterial growth, as opposed to the transparent broths. A parallel antibacterial test using a modified Kirby-Bauer method was repeated on sheep blood agar plates (UCSF Cell Culture Facility). A freshly inoculated bacterial broth was diluted to the concentration of 108 colony forming units per ml and 200 µl of it were added to the plate and spread until the surface was fully covered. One milligram of the CL-loaded particles was then added onto the plate in form of separate islets. The plates were incubated overnight at 37 °C and observed for inhibition of the bacterial growth around the particles the following day. All the experiments were carried out in quadruplicates and compared with the negative controls, incubated without any added bacteria and the positive controls, incubated with bacteria and no antibiotic-loaded particles.
Cell culture
Mouse calvarial preosteoblastic cell line, MC3T3-E1 subclone 4, was purchased from American Tissue Culture Collection (ATCC, Rockville, MD) and cultured in Alpha Minimum Essential Medium (α-MEM; Gibco) supplemented with 10% fetal bovine serum (FBS, Invitrogen) and no ascorbic acid (AA). The medium was replaced every 48 h, and the cultures were incubated at 37 °C in a humidified atmosphere containing 5% CO2. Every 7 days, the cells were detached from the surface of the 75 cm2 cell culture flask (Greiner Bio-One) using 0.25 wt% trypsin, washed, centrifuged (1000 rpm × 3 min), resuspended in 10 ml α-MEM and subcultured in 1:7 volume ratio. Cell passages 17 – 21 were used for the experiments reported hereby. The cultures were regularly examined under an optical microscope to monitor growth and possible contamination.
For the purpose of staining with fluorescent markers, MC3T3-E1 cells were seeded on glass cover slips placed in 24 well plates and 500 µl of α-MEM supplemented with 10% fetal bovine serum (FBS, Invitrogen) and no AA at the density of 6 × 10⁴ cells per well. After 5 days of incubation, nearly confluent cells were treated with α-MEM containing 50 µg/ml AA as the mineralization inductor. At the same time, 2 – 4 mg/cm2 of particles were added to the cells. After 5 days of incubation in the presence of the drug-containing particles, cells were stained for f-actin and nucleus. The staining procedure began with washing the cells with phosphate buffer saline (PBS; pH 7.4) and fixing them for 15 min in 3.7 % paraformaldehyde. The cells were then washed with PBS 3 × 5 min and then with the blocking solution (PBT = 1 % Bovine Serum Albumin (BSA), 0.1 % Triton X-100 in PBS) 2 × 5 min. The cells were then blocked and permeabilized in PBT for 1 h, and then incubated in 20 µg/ml 4', 6-diamidino-2-phenylindole dihydrochloride nuclear counterstain (DAPI, Invitrogen), 2 µM calcein AM as CAP-particlestaining compound, and 10 µg/ml phalloidin-tetramethylrhodamine (AlexaFluor 555, Invitrogen), all in PBT for one hour and then washed with PBS 3 × 5 min. The cover slips containing the fixed and stained cells were mounted onto glass slides using hard set vectashield and nail polish and were subsequently imaged on a confocal laser scanning microscope – C1si (UCSF Nikon Imaging Center) at 20 – 100 × magnification in oil. The final images were obtained by z-stack volume-rendering 15 – 20 raw images spaced by 1 µm. All the experiments were done in triplicates.
For the purpose of MTT (3-[4, 5-dimethylthiazol-2-yl]-2, 5-diphenyl tetrazolium bromide) in vitro toxicological assay, MC3T3-E1 cells were seeded in 48 well plates at the density of 3 · 104 cells per well and cultured in the abovementioned AA-free medium until confluency was reached. The AA-free medium was then substituted with the AA-supplemented medium and, at the same time, 4 mg/cm2 of particles were added to the cells. At the end of the incubation period, which lasted for 24 and 96 h, 20 µl of 5 mg/ml MTT (Sigma M-5655) in PBS were added to each well. After a 3 h incubation at 37 °C, 220 µl of MTT solubilization solution (Sigma M-5655) were added to each well. Following an additional 30 min incubation, 100 µl aliquots from each well were analyzed for absorbance at 570 nm on a UV/Vis spectrophotometric microplate reader (Molecular Devices: Spectra Max 190). All the particle types were analyzed in triplicates and the resulting absorbance values were normalized to the negative control.
For the purpose of real-time polymerase chain reaction (qPCR) analysis, MC3T3-E1 cells were seeded in 96 well plates at the density of 3 · 104 cells per well and cultured in the abovementioned AA-free medium until confluency was reached. The AA-free medium was then substituted with the AA-supplemented medium and, at the same time, 1 mg of particles was added to each well. At the end of the incubation period, which lasted for 5 days, cell lysis, reverse transcription (Bio-Rad) and qPCR (Applied Biosystems, StepONEPlus) were performed using the Fast SYBR Green Cells-to-CT kit (Ambion) in accordance with the manufacturer’s instructions. Each experiment was done in triplicates and each experimental replica was analyzed for mRNA expression in triplicates too (n = 3 × 3). The expressions of one housekeeping gene, β-actin (ACTB), and three osteogenic markers, osteocalcin (BGLAP), osteopontin (BSP-1) and Runx2 were analyzed. The following primer pair sequences were used18–20: ACTB forward 5’-GGCCCAGAGCAAGAGAGGTATCC-3’, reverse 5’-ACGCACGATTTCCCTCTCAGC-3’; BSP-1 forward 5’-AGGAGGAGGCAGAGCACA-3’, reverse 5’-CTGGTATGGCACAGGTGATG-3’; BGLAP forward 5’-CTCACAGATGCCAAGCCCA-3’, reverse 5’-CCAAGGTAGCGCCGGAGTCT-3’; Runx2 forward 5’-AAATGCCTCCGCTGTTATGAA-3’, reverse 5’-GCTCCGGCCCACAAATCT-3’. The real-time PCR results were analyzed using the ΔΔCt method21 and all the data were normalized to ACTB expression levels. The statistical analyses were performed using an unpaired t-test (GraphPad, La Jolla, CA).
Results and discussion
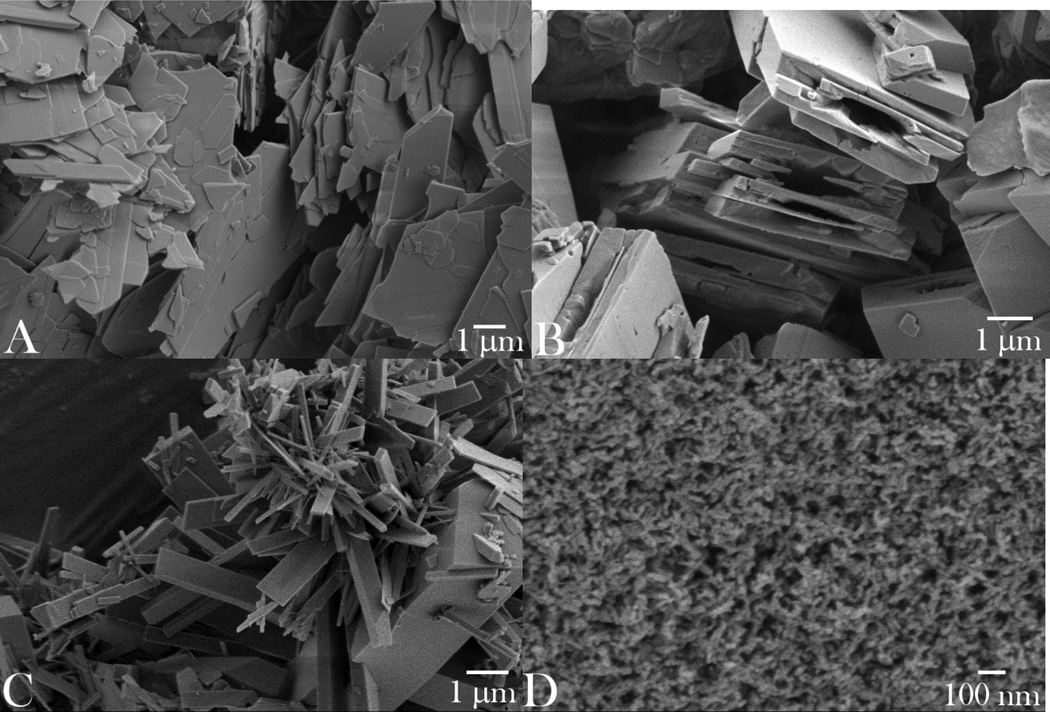
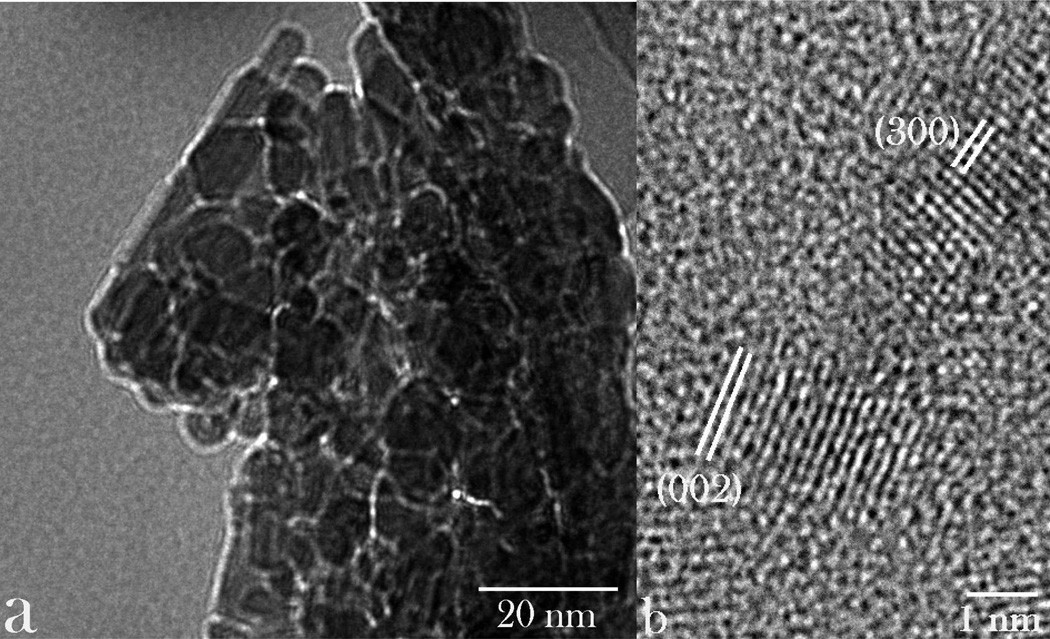
The optimal interaction between cells and particles utilized for drug delivery or diagnostic monitoring purposes critically depends not only on their chemical composition, but on numerous other parameters: size, shape, stiffness, surface roughness and charge, crystallinity and porosity.22 In this work, we assessed four different types of submicron CAP particles for their (a) drug loading and release properties, (b) antibacterial performance, and (c) osteogenic propensities. Particle morphologies of different CAP powders synthesized, ranging from planar, flaky (sample A) to brick-shaped (sample B) to elongated, plank- or rod-shaped (sample C) to spherical (sample D), are displayed in Fig.1. As shown in Table 1, all the particles had at least one of their dimensions in the submicron range, while the smallest and the most uniform ones were those comprising sample D: ~ 10 nm in diameter. The application of the ultrasound in the course of precipitation contributed to a multifold decrease in the particle size: e.g., from ~ 100 nm to ~ 10 nm for sample D. The ultrastructural, HR-TEM analysis of sample D confirmed the round shape of the particles, but also made their irregularly hexagonal morphological forms evident (Fig.2a). The law of rational indices correspondingly suggested the hexagonal unit cell, which would correspond to P63/m space group of hydroxyapatite, the only hexagonal CAP phase. This was confirmed by indexing the crystal lattice parameters based on the interatomic distances (Fig.2b); as expected, the most prominent plane was (002), perpendicular to the c-axis of hexagonal crystals, with the characteristic spacing of 0.17 nm.
Fig. 1.
SEM images of the synthesized CAP particles of different morphologies: plate-shaped (A); brick-shaped (B); plank-shaped (C); and spherical (D).
Fig. 2.
TEM images of nanoparticles comprising sample D at different magnifications, along with the indexed crystal lattice parameters corresponding to the hexagonal, P63/m space group of hydroxyapatite.
To prepare particle morphologies different from the spherical, precipitation at low supersaturations was initiated by the degradation of urea. Former studies have shown that low Ca/P ratios at low supersaturations favor the uniaxial growth of CAP crystals and the formation of particles with high aspect ratios.23 Crystallization of more than one CAP phase has been shown24 to be more sensitive to the activity of HxPO4x-3 species than to that of Ca2+. This effect is explained by the weaker hydration attraction of solvated HxPO4x-3 groups to the adjacent H3O+ ions than of solvated Ca2+ ions to the neighboring OH− groups. This leads to a higher activation barrier for Ca2+ in the solution than for HxPO4x-3, as also in agreement with the more pronounced solubility effect of anions of the Hofmeister series.25 Consequently, anions have been generally shown to have a more major effect on the morphology of precipitated nanoparticles than cations.26 However, for as long as precipitation is performed abruptly, by rapid transcension of the saturation level, as dictated by the conditions used for the formation of the powder D, no variations from the spherical particle morphology are noticed, regardless of the Ca/P ratio of the precursors. For this reason, conditions for the preparation of elongated particles involved gradually reaching and surpassing the saturation level. This effect utilized in the synthesis of planar and elongated rectangular particles (samples A–C) has been derived from the fact that lower supersaturations tend to promote surface growth, as opposed to high homogeneous nucleation rates corresponding to high supersaturations and typically leading to the formation of ultrafine spherical particles, such as those comprising the sample D.
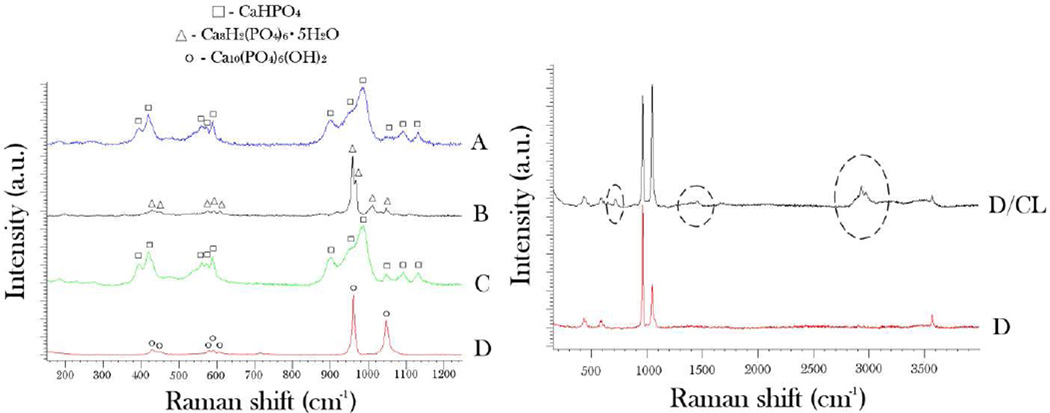
The results of the phase composition analysis of the synthesized particles using Raman spectroscopy are shown in Fig.3. Considering the submicron particle dimensions (Table 1) and the laser beam penetration depth of ~ 10 µm under the given measurement settings, the obtained spectra can be said to be representative of the bulk particle contents. The main Raman band for sample D was detected at 961 cm−1 and is derived from ν1(PO4) - the symmetric, non-degenerated stretching mode of the tetrahedral phosphate ion. It is indicative of partially type-B (PO4 → CO3) carbonated hydroxyapatite.27 The second most intensive band for the given sample was found at 1048 cm−1 and originated from NH4NO3 as a byproduct of the reaction between Ca and PO4 precursors. The doublet at 428 cm−1 and the triplet at 592 cm−1 are derived from ν2 and ν4 stretching modes of the tetrahedral PO4 ion. The spectrum of the sample B displayed high levels of semblance with the sample D, except that it additionally exhibited ν3(PO4) band at ~ 1014 cm−1, positioned between ν1(PO4) and the main doublet of ν3(PO4) bands with peaks at 1045 and 1075 cm−1, respectively, indicating the presence of °Ctacalcium phosphate in the system. In contrast, samples A and C were predominantly composed of monetite28, as evidenced by the presence of ν1(PO4) band at 968 cm−1 with the shoulder at 946 cm−1 characteristic for the given CAP phase. The absence of the shoulder at 1005 cm−1 indicates no crystalline water in the compound and, thus, no presence of brushite (CaHPO4·2H2O) as another common dicalcium phosphate phase. The stretching P-O bands of medium intensity, including ν3 triplet at 1126, 1086 and 895 cm−1, ν4 triplet with the maxima at 583, 569 and 553 cm−1, and ν2 doublet at 413 and 390 cm−1 are furthermore indicative of the presence of monetite in samples A and C. As shown in Fig.3b, the bands characteristic of an organic phase were additionally detected in samples loaded with CL, including the alkyl and aromatic C-H stretch in the 2900 – 3030 cm−1 range, alkyl C-H bending at 1440 cm−1 and aromatic C-H bending at 710 cm−1.
Fig. 3.
(a) Raman spectra of CAP powders composed of morphologically different particles (A–D), along with the denoted bands characteristic for three different CAP phases detected – monetite (CaHPO4), octacalcium phosphate (Ca8H2(PO4)6·5H2O), and hydroxyapatite (Ca10(PO4)6(OH)2); (b) Raman spectra of CAP comprising sample D per se and CAP comprising sample D loaded with CL. The encircled bands represent those derived from the organic phase. See the text for the detailed assignment of the vibrational bands.
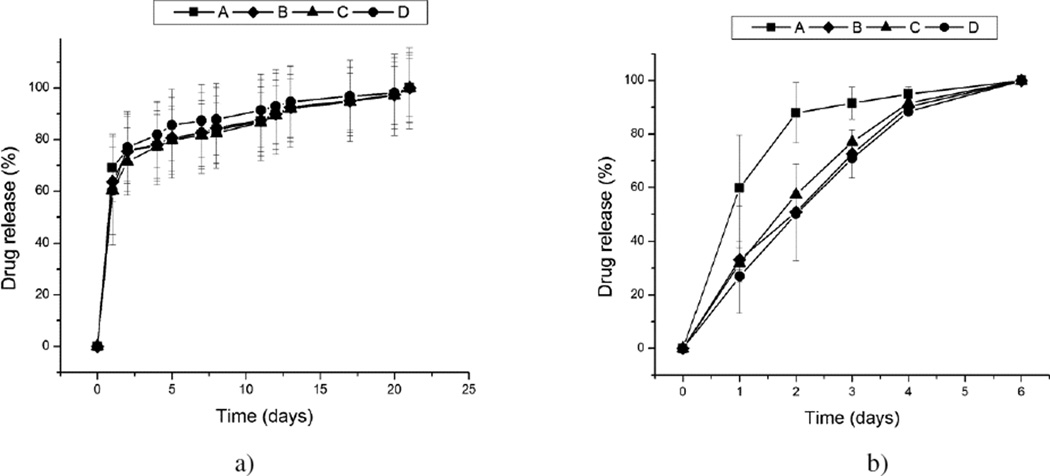
The temporal drug release profiles for the four morphologically different CAP powders, shown in Fig.4, exhibited high levels of mutual semblance. Only when the solution was replaced daily was the release from powder A consistently faster than that from other powders (Fig.4b). In contrast, the release curves corresponding to three other morphologies (B, C, D) were virtually indistinguishable. Despite the fact that samples B–D were of different phase compositions and correspondingly had different solubility products, ranging from pKsp 7 to 97 to 117 for samples C, B and D, respectively, no significant difference was observed in their release curves, suggesting that the release kinetics was not conditioned by the particle solubility. In contrast with CAP particles synthesized in our former study5, when the release kinetics was contingent upon the particle solubility, this effect was absent hereby, presumably due to greater dispersability of the particles resulting from the application of the ultrasound during their precipitation. As expected due to the dispersed nature of the powder and the drug loaded by physisorption only, all samples exhibited burst release in the first 24 h, followed by a more sustained, zero-order release period throughout the following three weeks (Fig.4a). While the controlled delivery of many other therapeutic compounds does not benefit from an intense initial release, this is not so for antibiotics where a moderate burst release is needed to ensure that the MIC is exceeded in a relatively short period of time and that the bacterial population is prevented from becoming resistant to the given therapy. No significant difference was detected for the drug release profiles depending on whether the release solutions were kept on a shaker plate or in stagnant conditions. Still, a difference in the released amount was observed conditional on whether the release was conducted by changing only a portion of the solution throughout the release time (Fig.4a) or its complete daily replacements (Fig.4b). In the latter case, the most intensive drug release was exhibited by the leafy particles (A). Planar surfaces were previously shown to be more effective in adsorbing organic molecules than any other surface geometry29, and this insight could be applied to the reverse process: desorption. The fact that the release is completed in only a week in more dynamic conditions involving frequent solution replacements suggests that the release is a diffusion-controlled process. Another important insight derivable from the comparison of these two release profiles is that the conditions under which the release process is carried out largely predetermine the overall release trend, making occasionally a difference between a more sustained, but first-order kinetics (Fig.4a) and a comparatively shorter, but thoroughly zero-order release (Fig.4b). Using urea as a precipitating agent and/or ultrasound-assisted conditions of precipitation resulted in excellent dispersibility of the particles, even after prolonged drying, and proved to be a decisive factor in eliminating the previously annotated effect of the phase composition difference on drug release profiles.5
Fig. 4.
The release of fluorescein from the surface of morphologically different CAP particles (A, B, C, D) in 20 mM Tris/HCl (pH 7.4) under the conditions that involved changing only a portion of the release solution throughout the release time (a) and daily replacements of the given solution (b). The profiles were normalized to the overall amount of the drug released in the given time by the particles.
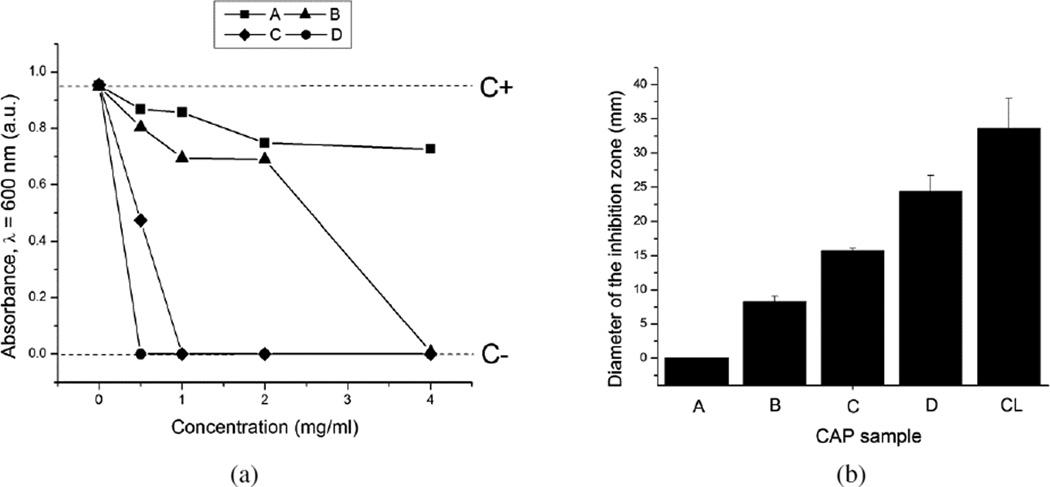
As could be seen from Figs.5–7, a great variation in the antibacterial performance between the four morphologically different antibiotic-loaded CAP samples is seen in the particle concentration range of 0.5 – 4 mg/ml. The MIC values for different samples are given in Table 2. A direct correlation is found to exist between the specific surface area of the antibiotic-loaded powders, their drug loading capacity (Table 1) and their antibacterial efficacy. Namely, the specific surface area of sample D is more than tenfold larger than that of sample C and more than twentyfold larger than those of samples A and B. Logically, the drug loading capacity and, henceforth, release follow the same trend: D > C > B > A. The greatest surface area of sample D, composed of 10-nm-sized hydroxyapatite nanospheres, predisposes it to be most effective in capturing the drug by physisorption and, consequently, most effective in inhibiting the bacterial growth. The same trend of increase in the antibiotic efficacy from the sample A to the sample D is observed both against bacteria in suspension (Figs.5 and 7a) and on contaminated surfaces (Figs.6 and 7b). Incidentally, as shown in Fig.7b, the function of the diameter of the inhibition zone on agar plates vs. the sample type yields a linear curve, with the antibacterial efficacy of pure CL (33 mm) being only slightly larger than that of the most effective CL-loaded sample (D; 24 mm).
Fig. 5.
Visual appearance of turbid/infected and clear/disinfected BHI broths inoculated with S aureus (105 bacteria per ml) and different amounts of different CL-loaded CAP samples, following 24 h incubation, including the negative control (C−), incubated without any added bacteria, and the positive control (C+), incubated with 105 bacteria per ml and no antibiotic-loaded particles.
Fig. 7.
(a) Optical transparence at λ = 600 nm of BHI broths inoculated with S aureus (105 bacteria per ml) as a function of the concentration of the CL-loaded CAP powders, following 24 h incubation (C− dashed line denotes the absorbance of the negative control, incubated without any added bacteria, while C+ dashed line indicates the absorbance of the positive control, incubated with 105 bacteria per ml and no antibiotic-loaded particles); (b) the average diameters of the inhibition zone on sheep blood agar plates around 1 mg of the CL-loaded powders A–D and pure CL.
Table 2.
MIC values for different CL-loaded CAP powders against S aureus in BHI broths.
| Sample | MIC (mg/ml) |
|---|---|
| A | > 4 |
| B | 2 – 4 |
| C | 0.5 – 1 |
| D | < 0.5 |
Fig. 6.
Inhibition zones formed around 1 mg of CL-loaded CAP particles of different morphologies (A, B, C, D) and the same amount of pure CL on sheep blood agar plates seeded with 7 · 103 S aureus bacteria per mm2 following an overnight incubation.
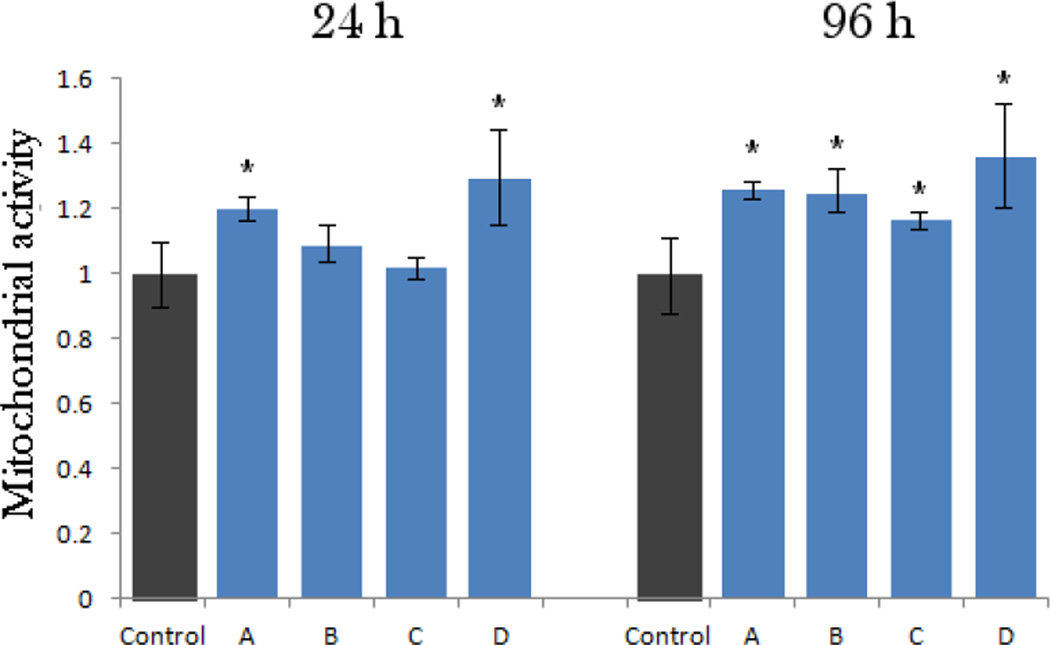
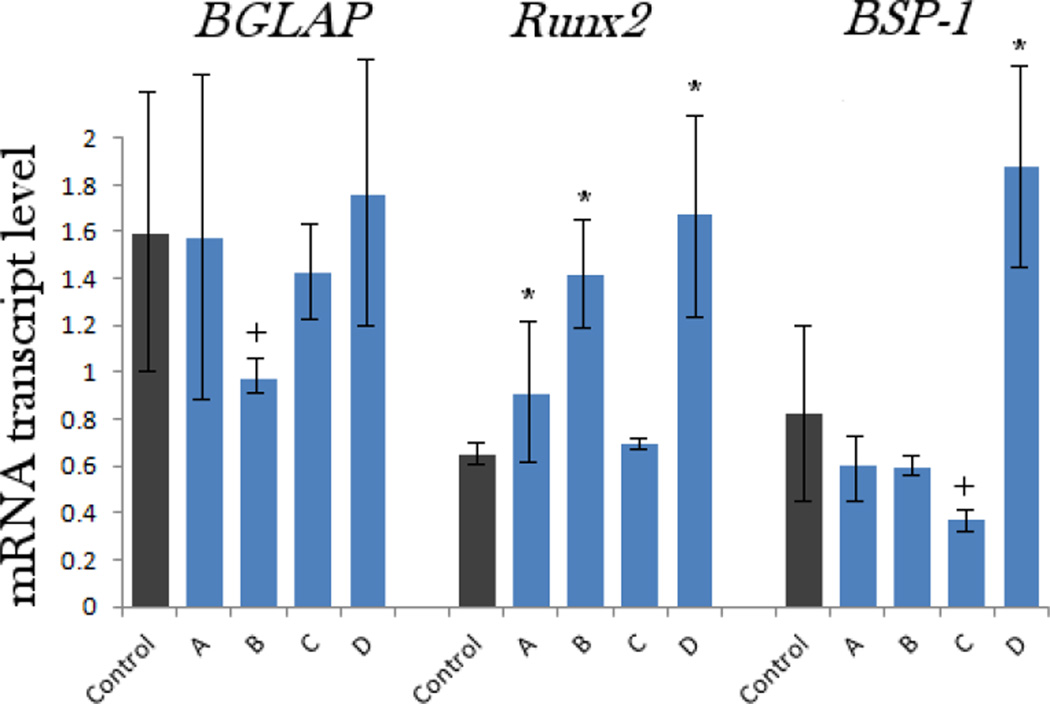
The results of the MTT assays performed at two different time points (24 and 96 h) are given in Fig.8. Interestingly, the mitochondrial activity of the osteoblastic cells, directly indicative of cell viability, increased after incubation with all the particle types, though statistically significantly (p < 0.05) only for samples A and D after 24 h of incubation. After 96 h of incubation, however, the viability was significantly elevated for all four samples. The most pronounced elevation at both time points was observed for the sample D, suggesting a particular affinity of the cells to the nanoscale size and topography of this material. Such an increase can be explained by fostered cell proliferation when the surface of nanostructured hydroxyapatite, the one that the osteoblastic cells naturally thrive on and with greatest ease convert to new bone in vivo30, is provided to them. The results of the gene expression analysis of the effects of various CAP particles on osteoblastic MC3T3-E1 cells are displayed in Fig.9. The same trend evidenced with respect to the mitochondrial activity was observed for the transcription levels of three different osteogenic markers analyzed by qPCR: namely, the greatest level of upregulation was noticed among the cell population incubated in the presence of the sample D, though statistically significant with respect to the negative control only for Runx2 and BSP-1. mRNA levels of Runx2, a key transcription factor for osteoblast differentiation31, were elevated for all the samples. In contrast, the levels of osteocalcin (BGLAP) and particularly osteopontin (BSP-1) were elevated only for the sample D and downregulated for all the other particle morphologies (A, B, C). BGLAP is a gene encoding for a protein directly involved in mineralization of the extracellular matrix and a key marker for bone formation32, while an opposite role, that of a mineralization inhibitor33, has been established for BSP-1.
Fig. 8.
Mitochondrial activity indicative of cell viability after different treatment intervals (24 and 96 h), normalized to the negative control and determined by the MTT assay for morphologically different CAP powders (A–D). Data normalized to the optical density at λ = 570 nm of the negative control are shown as arithmetic means with error bars representing standard deviation. Mitochondrial activities significantly (p < 0.05) higher with respect to the control group are marked with *. No samples had mitochondrial activities significantly (p < 0.05) lower with respect to the control group.
Fig. 9.
The comparative effect of CAP powders with different particle morphologies on the mRNA expression of three different osteogenic markers: BGLAP, Runx2 and BSP-1 in osteoblastic MC3T3-E1 cells. mRNA expression was detected by quantitative RT-polymerase chain reaction relative to the housekeeping gene ACTB. Data normalized to expression of ACTB are shown as averages with error bars representing standard deviation. Genes significantly (p < 0.05) upregulated with respect to the control group are marked with *. Genes significantly (p < 0.05) downregulated with respect to the control group are marked with +. The transcript levels of BSP-1 were multiplied 100-fold to fit the scale.
In our former study of the effect of the phase composition of CAP on the gene expression in osteoblastic cells6, we compared identical particle sizes (~ 100 nm) and came to conclusion that the highest upregulation of osteogenic markers was induced in the presence of not hydroxyapatite, but monetite, presumably due to: (a) its comparatively high solubility and the consequent release of phosphate ions, potent mineralization inductors in MC3T3-E1 cell line, and (b) the mild acidification of the medium followed by the release of one proton per stoichiometric formula of the compound - this may signal an effect analogous to osteoclastic degradation of bone and trigger increased bone formation activity of the cells. Therefore, we cannot discard the possibility that the smallest particle size of the sample D, for which the greatest upregulation of osteogenic markers was observed, proved to be a more decisive factor in terms of its favorable bone growth effect in vitro than its spherical morphology.
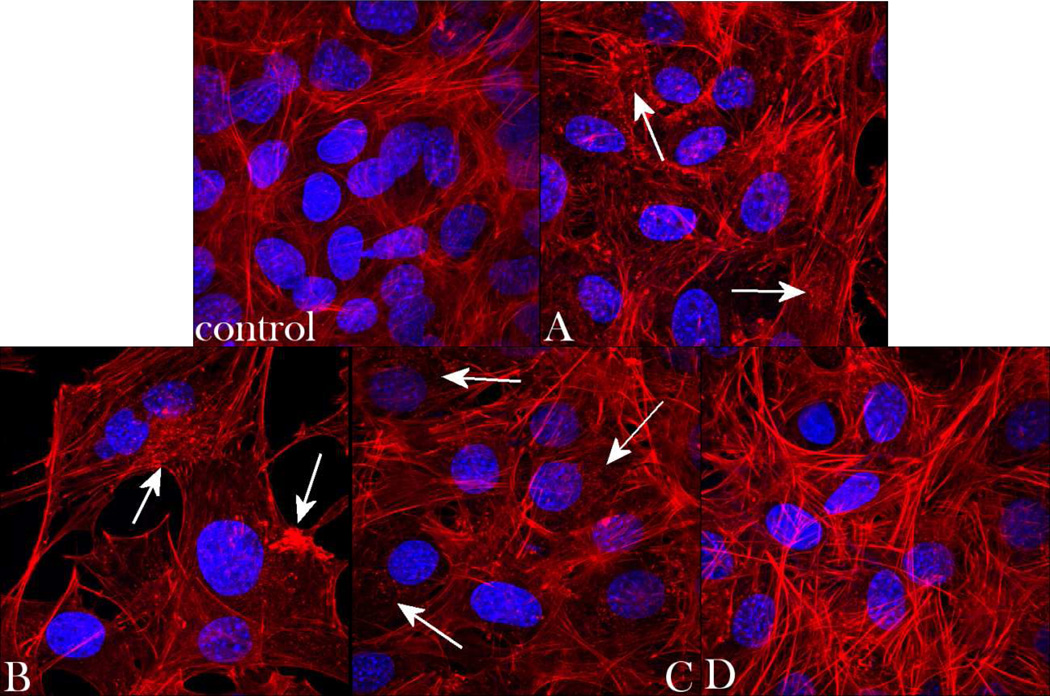
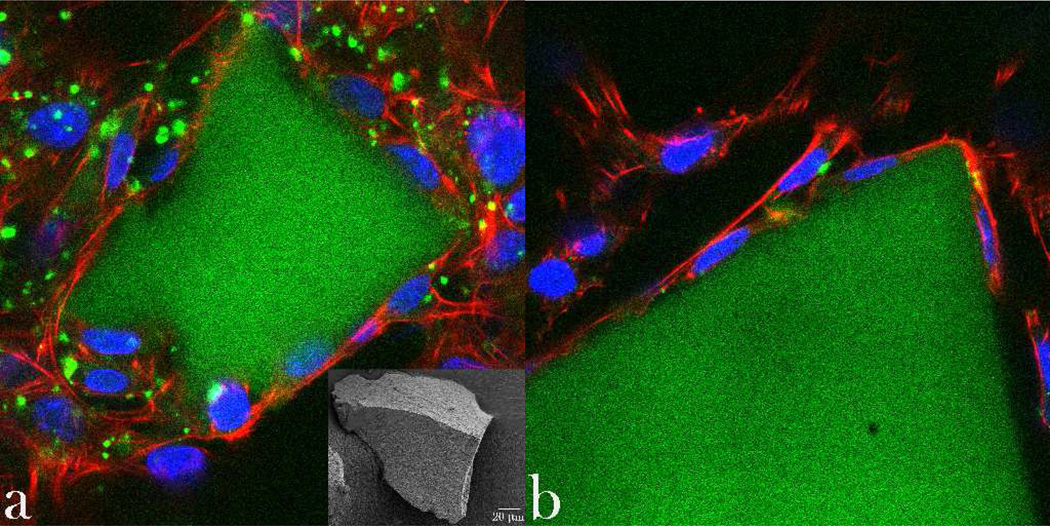
To assess the correlation between different CAP particle types and the cell morphology, optical confocal imaging was performed on MC3T3-E1 osteoblastic cells incubated with the different CAP powders, the results of which are shown in Figs.10–11. The healthy striation of the cytoskeleton of cells incubated with the powder D demonstrated the greatest level of semblance with respect to the control. In contrast, f-actin patterns of cells incubated with samples A–C displayed a phenotype characteristic of more stressed cytoskeleton, as evidenced by mildly disrupted striation and formation of intracellular flocci (Fig.10). Still, no directly observable damaging effects of any of the materials on cells was observed during this phenotypic assessment. Single-plane imaging of the interface between the cells and the microscopic particle conglomerates (Fig.11a) demonstrated good spreading of osteoblastic cells on their surface – the effect which is a direct morphological indicator of osteoconductivity of the given surface34 - and that particularly in case of the sample D (Fig.11a–b). Blue-stained cell nucleus was correspondingly observed elongated in the direction of the particle surface, while red-stained f-actin cytoskeleton fully enwrapped it, suggesting an intimate contact between the biological and the inorganic phase.
Fig. 10.
Volume rendered confocal optical micrographs of fluorescently stained osteoblastic MC3T3-E1 cells (f-actin - red; nucleus – blue) of the control sample and of those incubated with samples A, B, C and D, following 5 days of growth in differentiation media. Arrows indicate f-actin flocci of stressed cytoskeleton. The sizes of the images are 270 × 270 µm.
Fig. 11.
Single-plane confocal optical micrographs of fluorescently stained osteoblastic MC3T3-E1 cells (f-actin -red; nucleus – blue) in contact with CAP particle conglomerates (green; SEM image given as inlet in (a)) of sample D, following 5 days of growth in differentiation media. The sizes of the images are 270 × 270 µm.
Summary
Finding new ways to treat bone infection is of great interest for the medical community, including its orthopedic and dental branches. Deficiencies of the traditional ways to treat osteomyelitis include: (a) long-term therapies with systemically delivered antibiotics; and (b) skeletal disfigurements, biomechanical weakening and proneness to reoccurrence of the infection following surgical debridement. Alternative methods that would minimize these side effects by ensuring local and sustained delivery of the antibiotics together with the usage of osteogenic drug delivery carriers to regenerate the diseased bone are consequently sought. In this study we analyzed the effects of morphological variation in submicron-sized calcium phosphate particles, potentially applicable as a particulate carrier for delivery of antibiotics in the treatment of osteomyelitis, on (a) drug release profiles, (b) the bacterial growth inhibition, and (c) cell viability and osteogenic propensities in vitro. We have come to conclusion that (a) the largest drug loading and release capacity; (b) the most effective bacterial inhibition, (c) the highest cell viability, (d) the largest gene expression upregulation of three different osteogenic markers, BGLAP, Runx2 and BSP-1, as well as (e) the least disrupted cell cytoskeleton and cell morphologies were noticed for the calcium phosphate powder composed of smallest, spherical nanosized particles. The largest surface area among all the particle morphologies analyzed, vital in ensuring efficient capture of the antibiotic by adsorption, and the ridged topography of its agglomerates that provide anchoring points for the cells may present the crucial factors in explaining the greatest antibacterial and osteogenic potency of the given powder.
Prior to the onset of this study, plate-shaped calcium phosphate particles, already present in bone as such, although with smaller dimensions than those tested in this study, were thought to be possibly more osteoconductive than the spherical. In contrast, there were also reasons to expect that elongated calcium phosphate particles with high aspect ratio - associated with the components of atherosclerotic plaque and other products of pathological crystallization throughout the body35–37 and potentially exhibiting asbestos-like toxic effects38, 39 - might be less viable for the cells, especially in view of a comparatively large abovementioned body of research that has suggested their Occasional negative effects on biological entities. Our results, however, show that spherical nanoparticles with circa 10 nm in diameter lead to more viable cell responses compared to any of the orthogonal particle shapes. At the same time, no negative effects of particle flattening or elongation were observed, be it on cells or on the ability to act as an effective antibiotic delivery agent. A more rigorous comparative study of this type would be based on applying particles of identical sizes and surface areas, something that future studies of ours or other research groups may accomplish.
Acknowledgments
Presented were the results of a study supported by the NIH/NIDCR grant K99-DE021416. Confocal microscopy data were acquired at the Nikon Imaging Center at UCSF. HRTEM analyses were performed at the National Center for Electron Microscopy supported by the Office of Science, Office of Basic Energy Sciences of the US Department of Energy under Contract No. DE-AC02-05CH11231. The authors acknowledge the assistance of Chengyu Song.
References
- 1.Del Pozo JL, Patel R. New Eng. J. Med. 2009;361:787–794. doi: 10.1056/NEJMcp0905029. [DOI] [PMC free article] [PubMed] [Google Scholar]
- 2.Spiegel DA, Penny JN. Tech. Orthop. 2005;20:142–152. [Google Scholar]
- 3.Jones HW, Beckles VLL, Akinola B, Stevenson AJ, Harrison WJ. J. Bone Joint Surg. Br.B. 2011;93:1005–1010. doi: 10.1302/0301-620X.93B8.25951. [DOI] [PubMed] [Google Scholar]
- 4.Breithaupt H. In: Septic Bone and Joint Surgery. Schnettler R, Steinau H-U, editors. Stuttgart: Thieme; 2010. pp. 71–92. [Google Scholar]
- 5.Uskokovié V, Desai TA. J. Biomed. Mat. Res. A. 2013 in press, doi: 10: 1002/jbm.a.34426 (accessed March 11, 2013). [Google Scholar]
- 6.Uskokovié V, Desai TA. J. Biomed. Mat. Res. A. 2013 in press, doi: 10:1002/jbm.a.34437 (accessed March 11, 2013) [Google Scholar]
- 7.Kihara T, Zhang Y, Hu Y, Mao Q, Tang Y, Miyake J. J. Biosci. Bioeng. 2011;111:725–730. doi: 10.1016/j.jbiosc.2011.01.017. [DOI] [PubMed] [Google Scholar]
- 8.Stoehr LC, Gonzalez E, Stampfl A, Casals E, Duschl A, Puntes V, Oostingh GJ. Part. Fibre Toxicol. 2011;8:1–15. doi: 10.1186/1743-8977-8-36. [DOI] [PMC free article] [PubMed] [Google Scholar]
- 9.Xu Z, Liu C, Wei J, Sun J. J. Appl. Toxicol. 2012;32:429–435. doi: 10.1002/jat.1745. [DOI] [PubMed] [Google Scholar]
- 10.Grandjean-Laquerriere A, Laquerriere P, Guenounou M, Laurent-Maquin D, Phillips TM. Biomaterials. 2005;26:2361–2369. doi: 10.1016/j.biomaterials.2004.07.036. [DOI] [PubMed] [Google Scholar]
- 11.Zhao X, Ng S, Heng BC, Guo J, Ma L, Tan TT, Ng KW, Loo SC. Arch. Toxicol. 2012 doi: 10.1007/s00204-012-0827-1. in press, doi: 10: 1007/s00204-012-0827-1 (accessed January 11, 2013) [DOI] [PubMed] [Google Scholar]
- 12.Scheel J, Weimans S, Thiemann A, Heisler E, Hermann M. Toxicol. In Vitro. 2009;23:531–538. doi: 10.1016/j.tiv.2009.01.007. [DOI] [PubMed] [Google Scholar]
- 13.Desai TA, Chu WH, Rasi G, Sinibaldi-Vallebona P, Guarino E, Ferrari M. Biomed Microdevices. 1999;1:131–138. doi: 10.1023/A:1009948524686. [DOI] [PubMed] [Google Scholar]
- 14.Park J, Bauer S, van der Mark K, Schmuki P. Nano Letters. 2007;7:1686–1691. doi: 10.1021/nl070678d. [DOI] [PubMed] [Google Scholar]
- 15.Brammer KS, Oh S, Cobb CJ, Bjursten LM, van der Heyde H, Jin S. Acta Biomat. 2009;5:3215–3223. doi: 10.1016/j.actbio.2009.05.008. [DOI] [PubMed] [Google Scholar]
- 16.Ayala P, Desai TA. Integr. Biol. (Camb.) 2011;3:733–741. doi: 10.1039/c1ib00012h. [DOI] [PubMed] [Google Scholar]
- 17.Shaw WHR, Bordeaux JJ. J. Am. Chem. Soc. 1955;77:4729–4733. [Google Scholar]
- 18.Kim SW, Her SJ, Park SJ, Kim D, Park KS, Lee HK, Han BH, Kim MS, Shin CS, Kim SY. Bone. 2005;37:359–369. doi: 10.1016/j.bone.2005.04.020. [DOI] [PubMed] [Google Scholar]
- 19.Rousseau M, Boulzaguet H, Biagianti J, Duplat D, Milet C, Lopez E, Bedouet L. J Biomed. Mat. Res. A. 2007;85:487–497. doi: 10.1002/jbm.a.31553. [DOI] [PubMed] [Google Scholar]
- 20.Celetti A, Testa D, Staibano S, Merolla F, Guarino V, Castellone MD, Iovine R, Mansueto G, Somma P, De Rosa G, Galli V, Melillo RM, Santoro M. Clin. Cancer Res. 2005;11:1019–1027. doi: 10.1158/1078-0432.CCR-05-0641. [DOI] [PubMed] [Google Scholar]
- 21.Pfaffl MW. Nucleic Acids Res. 2001;29:2002–2007. doi: 10.1093/nar/29.9.e45. [DOI] [PMC free article] [PubMed] [Google Scholar]
- 22.Gratton SEA, Ropp PA, Pohlhaus PD, Luft JC, Madden VJ, Napier ME, DeSimone JM. PNAS. 2008;105:11613–11618. doi: 10.1073/pnas.0801763105. [DOI] [PMC free article] [PubMed] [Google Scholar]
- 23.Uskokovié V, Li W, Habelitz S. J. Bionic Eng. 2011;8:114–121. doi: 10.1016/S1672-6529(11)60017-6. [DOI] [PMC free article] [PubMed] [Google Scholar]
- 24.Orme CA, Giocondi JL. In: Handbook of Biomineralization. Behrens P, Bäuerlein E, editors. Vol.2. Weinheim: Wiley; 2007. pp. 135–157. [Google Scholar]
- 25.Leontidis E. Curr. Op. Colloid Interface Sci. 2002;7:81–91. [Google Scholar]
- 26.Filankembo A, Giorgio S, Lisiecki I, Pileni MP. J. Phys. Chem. B. 2003;107:7492–7500. [Google Scholar]
- 27.Penel G, Leroy G, Rey C, Bres E. Calc. Tissue Int. 1998;63:475–481. doi: 10.1007/s002239900561. [DOI] [PubMed] [Google Scholar]
- 28.Casciani F, Condrate RA. J. Solid State Chem. 1980;34:385–388. [Google Scholar]
- 29.Iafisco M, Sabatino P, Lesci IG, Prat M, Rimondini L, Roveri N. Colloids Surf. B Biointerfaces. 2010;81:274–284. doi: 10.1016/j.colsurfb.2010.07.022. [DOI] [PubMed] [Google Scholar]
- 30.Van der Vreken NMF, Pieters IY, Declerq HA, Cornelissen MJ, Verbeeck RMH. Acta Biomat. 2010;6:617–625. doi: 10.1016/j.actbio.2009.07.038. [DOI] [PubMed] [Google Scholar]
- 31.Carbonare LD, Innamorati G, Valenti MT. Stem Cell Rev. 2012;8:891–897. doi: 10.1007/s12015-011-9337-4. [DOI] [PubMed] [Google Scholar]
- 32.Lian JB, Stein GS, Stein JL, van Wijnen AJ. J. Cell Biochem. Suppl. 1998;30–31:62–72. [PubMed] [Google Scholar]
- 33.Sodek J, Ganss B, McKee MD. Crit. Rev. Oral Biol. Med. 2000;11:279–303. doi: 10.1177/10454411000110030101. [DOI] [PubMed] [Google Scholar]
- 34.Haders DJ, Kazanecki CC, Denhardt DT, Riman RE. J. Mater. Sci.: Mater. Med. 2010;21:1531–1542. doi: 10.1007/s10856-010-4031-7. [DOI] [PubMed] [Google Scholar]
- 35.Cham BE. Eur. J. Clin. Invest. 2001;31:467–468. doi: 10.1046/j.1365-2362.2001.00852.x. [DOI] [PubMed] [Google Scholar]
- 36.Laird DF, Mucalo MR, Yokogawa Y. J. Colloid Interface Sci. 2006;295:348–363. doi: 10.1016/j.jcis.2005.09.013. [DOI] [PubMed] [Google Scholar]
- 37.Uskokovié V. Steroids. 2008;73:356–369. doi: 10.1016/j.steroids.2007.12.005. [DOI] [PubMed] [Google Scholar]
- 38.Belitskaya-Levy I, Hajjou M, Su WC, Yie TA, Tchou-Wong KM, Tang MS, Goldberg JD, Rom WN. J. Environ. Pathol. Toxicol. Oncol. 2007;26:281. doi: 10.1615/jenvironpatholtoxicoloncol.v26.i4.50. [DOI] [PubMed] [Google Scholar]
- 39.Han YG, Xu J, Li ZG, Ren GG, Yang Z. Neurotoxicology. 2012;33:1128. doi: 10.1016/j.neuro.2012.06.004. [DOI] [PubMed] [Google Scholar]


