

Abstract
The Lsr2 protein of Mycobacterium leprae and its synthetic peptides have been shown to elicit lymphoproliferation and gamma interferon (IFN-γ) release by peripheral blood mononuclear cells (PBMCs) of patients with lepromatous leprosy (M. Chaduvula, A. Murtaza, N. Misra, N. P. Narayan, V. Ramesh, H. K. Prasad, R. Rani, R. K. Chinnadurai, I. Nath, Infect. Immun. 80:742–752, 2012). PBMCs from 16 patients with lepromatous leprosy who were undergoing erythema nodosum leprosum (ENL) (type 2) and 5 patients with reversal reactions (RR) (type 1) were stimulated with M. leprae, recombinant Lsr2, and six end-to-end synthetic peptides (A through F) spanning the Lsr2 sequence. During the reaction all patients with ENL showed lymphoproliferation (stimulation index, >2) in response to peptides A and F, with other peptides eliciting responses in 75 to 88% of the subjects. In PBMC cultures, both lymphoproliferation and IFN-γ release for peptide E were significantly higher than for peptides B and C and recombinant Lsr2 (P < 0.05, Wilcoxon signed-rank test). Five patients with RR also showed enhanced lymphoproliferative responses and IFN-γ release in response to Lsr2, M. leprae, and peptide E. Six months postreaction, 14 patients with ENL continued to exhibit responses to Lsr2 and its peptides, with the highest responses being elicited by peptide E. However, 5 subjects showed no lymphoproliferation and had reduced IFN-γ release in response to Lsr2 peptides (P < 0.001, Kruskal-Wallis test) but responded to recombinant Lsr2. Six patients with ENL had HLA-A*68.01, which the STFPEITHI program showed to have high peptide-binding scores of 20 to 21 for peptides E, B, and C. Eleven patients had HLA-DRB1*1501 and HLA-DRB1*1502, which had high binding scores for peptides C and E. Thus, Lsr2 and its peptides are recognized in leprosy reactions during and well after the subsidence of clinical signs.
INTRODUCTION
Lsr2, a 15-kDa basic protein of Mycobacterium leprae, has been reported to be immunodominant in leprosy (1, 2, 3). As M. leprae is not cultivable by conventional means, it became feasible to study the biological functions of Lsr2 after homologues were identified in cultivable strains of mycobacteria. In recent years, Lsr2 has been reported in all sequenced mycobacteria (4, 5) and mycobacteriophages (6, 7). That lsr2 is an essential gene was shown in Mycobacterium tuberculosis, an important human pathogen for which lsr2 deletion was not compatible with survival (8, 9). Lsr2 is a transcription regulator and influences gene expression. It binds to AT-rich regions of chromosomal DNA (9, 10) and physically protects the DNA from damage by reactive oxidative intermediates (11), targets virulence genes (9, 12), influences cell wall synthesis and biofilm formation (4), and affects drug resistance (8). Lsr2 is upregulated under stress conditions such as iron increase (13), nutrient starvation (14), and high temperatures (15).
The protein encoded by the lsr2 gene is recognized by antibodies and T cells of leprosy patients (1, 2, 3, 16, 17, 18). Leprosy is characterized by a clinicopathological spectrum wherein some patients present with localized depigmented hypoanesthetic skin patches (polar tuberculoid [TT] and borderline tuberculoid [BT] leprosy), whereas other patients have generalized involvement and show bacilli (polar lepromatous [LL] and borderline lepromatous [BL] leprosy) in lesions; a fifth form, called borderline borderline (BB), also shows bacilli (19). It is now established that lepromatous leprosy patients have antibody responses but not CD4+ T cell-mediated responses to the causative organism. The T cell unresponsiveness is uniquely directed against M. leprae and not against other mycobacteria/antigens. Though many patients remain clinically stable throughout the disease period, about 15 to 20% of patients with leprosy suffer from two types of leprosy reactions. Reversal reactions (RR) (type 1) occur mainly in borderline types of leprosy (BT, BB, and BL), and episodes termed erythema nodosum leprosum (ENL) (type 2) reactions occur in both borderline and polar lepromatous leprosy (20). Whereas RR is localized to the skin lesions and neighboring peripheral nerves, patients with ENL present with generalized signs of fever, disseminated skin nodules, and joint pains. Selective sequences of Lsr2, as determined by synthetic peptides, were uniquely recognized by antibodies of leprosy patients undergoing episodes of ENL (16). While the antigen-specific anergy to M. leprae has been intensely investigated, it is of interest that during reactional episodes such patients show transient Th1 responses to specific M. leprae antigens (21).
Some patients with lepromatous leprosy who showed unresponsiveness to M. leprae nevertheless responded to recombinant Lsr2 and its peptides (1), which indicated the possibility in these patients of restitution of T cell responses by selective epitopes of M. leprae. The present investigation was undertaken with end-to-end Lsr2 peptides with a view to dissecting the T cell recognition of Lsr2 during the natural immunological perturbations that occur in leprosy reactions. Peripheral blood mononuclear cells (PBMCs) from patients with ENL and RR were stimulated with M. leprae and recombinant Lsr2, and six end-to-end synthetic peptides (A through F) spanning the Lsr2 sequence were evaluated as in vitro correlates of CD4+ T cell function with assays of lymphoproliferation and gamma interferon (IFN-γ) release.
MATERIALS AND METHODS
Subjects.
A total of 21 patients with multibacillary leprosy attending the Voluntary Health Services (VHS) Leprosy Project, Shaktinagar, Periyar District, Tamil Nadu, India, were included in the investigation (Table 1). The study was approved by the institutional ethics committees of VHS and the All India Institute of Medical Sciences. Informed consent was obtained from the patients before the collection of samples. Subjects who met the inclusion criteria were adult patients who consented to the study, gave assurance for regular clinical follow-up, and showed no clinical evidence of hypertension, diabetes, and other infectious diseases such as tuberculosis, HIV, or helminth infections. Exclusion criteria were age below 15 years, pregnancy, and anemia.
Table 1.
Clinical details of 21 leprosy patients with RR (type 1) and ENL (type 2) included in the study prior to administration of antireaction therapya
| Type of reaction and patient no. | Age (yrs) | Sex | Leprosy typeb | BIc | Duration of leprosy (yrs) | No. of previous reaction episodes | Duration of reaction prior to study (d) | Duration of MDTd prior to the study (mos) |
|---|---|---|---|---|---|---|---|---|
| ENL | ||||||||
| 1 | 49 | M | LL | 2.5 | 1.5 | 1 | 0 | 6 |
| 2 | 40 | M | LL | 1.2 | 5 | 1 | 2 | 11 |
| 3 | 35 | M | LL | 3.7 | 3 | 1 | 2 | 12 |
| 4 | 28 | M | LL | 3.1 | 2 | 1 | 4 | 12e |
| 5 | 37 | F | LL | 4 | 3.4 | 3 | 0 | 24e |
| 6 | 35 | M | LL | 0.7 | 1.1 | 1 | 3 | 3 |
| 7 | 20 | F | LL | 1.3 | 3 | 3 | 2 | 6 |
| 8 | 26 | M | LL | 4 | 2 | 1 | 1 | 1.2 |
| 9 | 42 | M | BL | 3.5 | 3 | 1 | 1 | 1.5 |
| 10 | 32 | M | BL | 3 | 0.5 | 0 | 2 | 2 |
| 11 | 42 | M | LL | 3 | 1.2 | 1 | 2 | 4 |
| 12 | 47 | M | LL | 3.2 | 8 | 2 | 1 | 12e |
| 13 | 35 | M | LL | 3 | 2 | 1 | 1 | 6 |
| 14 | 38 | M | BL | 3.5 | 0.5 | 0 | 1 | 1 |
| 15 | 47 | F | BL | 2.7 | 2 | 1 | 3 | 3 |
| 16 | 32 | F | LL | 5 | 2 | 0 | 2 | 1 |
| RR | ||||||||
| 17 | 57 | M | BL | 3 | 2 | 1 | 4 | 6 |
| 18 | 40 | F | LL | 2.5 | 0.5 | 0 | 1 | 0 |
| 19 | 52 | M | BL | 2 | 0.75 | 0 | 1 | 3 |
| 20 | 30 | M | BB | 3.5 | 5 | 4 | 3 | 3f |
| 21 | 52 | F | BL | 3 | 1.5 | 0 | 4 | 6 |
LL, BL, and BB indicate polar lepromatous, borderline lepromatous, and borderline borderline leprosy, respectively.
BI, mean bacillary index of skin sites.
MDT, multidrug therapy (see Materials and Methods).
Irregular treatment was received due to nonattendance at the clinic.
Received steroids during the last reaction episode, which was 14 months prior to the present study.
Among the patients with leprosy reaction included in the study, the leprosy in 13 patients was classified as polar lepromatous leprosy (LL), in 7 patients as borderline lepromatous leprosy (BL), and in 1 patient as borderline borderline leprosy (BB). Five and 16 patients, respectively, had RR and ENL leprosy reactions (16 males and 5 females aged 20 to 57 years). All patients with ENL were studied during the reaction episode (time [t] = 0) and at 0.5 and 1 year after the onset of reaction. Patients with RR were investigated only at the time of reaction. Patients were investigated within 4 days of the onset of reaction and before receiving antireaction therapy. The follow-up studies were undertaken well after the therapy was completed. The patients were classified for the type of leprosy and reaction types on the basis of clinical and histopathological examination of the skin lesions per the Ridley Jopling classification (19, 20). Patients 14 and 15 were also investigated at 4 and 3 months prior to the onset of ENL and patients 5 and 6 at 5 and 1.5 years post-ENL episode.
The patients received antileprosy multidrug therapy (MDT) consisting of 100 mg of dapsone daily, 100 mg clofazamine on alternate days, and 600 mg of rifampin monthly prior to and during reactions, as indicated in Table 1. During the reaction episodes, the patients received additional steroids for 12 weeks per WHO guidelines, which consisted of tapering doses of corticosteroids every 2 weeks starting at 40 mg daily and ending at 5 mg daily for weeks 11 and 12.
Antigens.
Heat-killed integral M. leprae was kindly provided by P. J. Brennan (Colorado State University, Fort Collins, CO). The Lsr2 protein obtained from the pQE9 clone was kindly provided by Josie Clarke Curtiss, Washington University, St. Louis, MO, and purified as described earlier (1). In brief, the His-tagged Lsr2 protein was purified from lysates in a slurry of Ni-iminodiacetic acid (IDA) resin with buffer containing various concentrations of imidazole per the manufacturer's instructions (Qiagen Inc., Chatsworth, CA). The pooled dialyzed fractions were suspended in endotoxin-free phosphate-buffered saline (PBS) and checked for purity in 12% SDS-PAGE gels and for reactivity by Western blotting using lepromatous sera as described earlier (1). Endotoxin contamination was 0.3 EU/ml as evaluated by chromogenic Limulus amebocyte lysate assay (Lonza, Walkersville, MD). Six end-to-end synthetic peptides were designed by M. E. Pattarayo (Institute de Immunologia, Bogotá, Columbia) on the basis of the Lsr2 sequence (GenBank accession no. M67510) using algorithms for T cell epitopes. They were synthesized by solid phase using the N-tert-butoxycarbonyl (t-BOC) method as described earlier (1). The six peptides with an amino acid (aa) location in the Lsr2 sequence (given in parentheses) were peptide A (aa 1 to 23) (MAKKVTVTLVDDFDGAGAADETV), peptide B (aa 24 to 42) (EFGLDGVTYEIDLTNKNAA), peptide C (aa 43 to 60) (KLRGDLRQWVSAGRRVGG), peptide D (aa 61 to 80) (RRRGRSNSGRGRGAIDREQS), peptide E (aa 81 to 100) (AAIREWARRNGHNVSTRGRI), and peptide F (aa 101 to 112) (PADVIDAFHAAT).
Ex vivo PBMC cultures.
Heparinized peripheral blood obtained by venipuncture was transported by air and processed within 10 to 12 h of bleeding.
(i) Lymphoproliferation assay.
As described earlier (1), PBMCs were separated by density gradient centrifugation on Histopaque (Sigma-Aldrich, St. Louis, MO), washed in Hank's balanced salts solution (HBSS) and resuspended in RPMI 1640 (Gibco-BRL, MD), with 10% AB serum, 2 mM l-glutamine, 100 units of penicillin (Alembic Chemicals, India), and 100 μg streptomycin (Sarabhai Chemicals, India). Staining with 0.2% trypan blue dye exclusion showed 95 to 98% cell viability. We dispensed 1 × 10⁵ cells/well of PBMCs in triplicate at a volume of 100 μl into 96-well sterile flat-bottom culture plates (Nunc, Intermed, Kampstrup, Denmark) as cells alone or with 25 μl each of integral heat-killed armadillo-derived M. leprae at a concentration of 5 × 10⁶ bacilli/ml, Lsr2 at 1 μg/ml, or synthetic peptides at a concentration of 50 μg/ml. The optimal concentrations of antigens and time periods of cultures had been determined as reported earlier for 5 healthy individuals and 10 patients with tuberculoid and 10 with lepromatous leprosy (1). Cultures were incubated for 5 days at 37°C in humidified air containing 5% CO2. The cultures were pulsed with [3H]thymidine (2 Ci/mM; Amersham International, Buckinghamshire, United Kingdom) for 16 to 18 h prior to harvesting on glass fiber discs (Whatman GF/C, Maidstone, England, United Kingdom), by a semiautomatic PHD cell harvester (Cambridge Technology, Inc., Cambridge, MA). The incorporated radioactivity was assessed by liquid scintillation counting on an LKB Rackbeta 1209 counter (Piscataway, NJ) using toluene-based scintillation counting fluid. The counts per minute (cpm) were obtained, and the results are given as the mean change in cpm (Δcpm) ± the standard deviation (SD), the mean cpm of stimulated cultures minus the mean cpm of unstimulated cultures, and the stimulation index (SI) (mean cpm of stimulated cultures/mean cpm of unstimulated cultures). An SI value of >2 was considered a positive response based on a P value of <0.001 obtained using receiver operating characteristic (ROC) analysis.
(ii) IFN-γ.
PBMCs were cultured as described above for 48 h, which was found to be the optimum time in preliminary experiments undertaken in patients with tuberculoid and lepromatous leprosy as described earlier (1). The supernatants were centrifuged to remove cell debris and stored at −20°C until further use. IFN-γ was assayed in triplicate per the manufacturer's instructions (Quantikine enzyme-linked immunosorbent assay [ELISA]; R&D Systems Europe, Ltd., Abingdon, United Kingdom), with a sensitivity of 8 pg/ml.
Identification of IFN-γ-producing cells was established by flow cytometry using Lsr2 and M. leprae as the antigens in 3 representative patients with ENL undergoing reactions. PBMCs were cultured as above at 37°C for 48 h in the presence of Lsr2 and M. leprae. Golgi Stop (BD Biosciences, San Diego, CA) was added 8 h prior to harvest, and then cells were washed three times and resuspended in stain buffer. Aliquots of 50 μl of 1 × 10⁶/ml cells were first incubated for surface staining for 30 min on ice with fluorescent conjugated antibodies (BD Biosciences) consisting of anti-human CD3 (peridinin chlorophyll protein/PerCP-Cy 5.5 labeled), anti-human CD4 (allophycocyanin/APC-H7 labeled) and anti-human CD8 (phycoerythrin [PE]/PE-Cy 7 labeled). Cells were washed as before and then fixed and permeabilized in Cytofix/Cytoperm (BD Biosciences), followed by intracellular cytokine staining using fluorescein isothiocyanate (FITC)-labeled anti-IFN-γ per the manufacturer's instructions. Flow cytometry was performed using BD FACS Aria (BD Biosciences). Stained cells were gated for CD3+ cells and analyzed for intracellular IFN-γ containing CD4+ and CD8+ phenotypes.
(iii) HLA-A, -B, and -DRB1 polymorphisms.
Alleles of HLA-A, HLA-B, and HLA-DRB1 were studied using PCR followed by hybridization with sequence-specific oligonucleotide probes as described earlier (22, 23) using a bead-based technology (Luminex, Austin, TX) following the manufacturer's instructions (LABType SSO kit from One Lambda, Canoga Park, CA). Briefly, 40 ng of DNA was amplified in master mix, primers, and 2 μl of Taq DNA polymerase (5 units/μl) in a PerkinElmer 2700 thermal cycler. The amplified product was run on 1% agarose gel to confirm amplification, and then 5 μl of amplified product was hybridized with an appropriate amount of multiplex beads conjugated with oligonucleotide probes in hybridization buffer at 60°C for 15 min followed by washing and incubation with 50 μl 1× streptavidin phycoerythrin (SAPE) solution at 60°C for 5 min. Fluorescence of the labeled beads was acquired on a Luminex 2.2 flow cytometer (Luminex Corporation, Austin, TX). Acquired data were analyzed using LABType software (One Lambda) for analysis of HLA alleles. The latest nomenclature for the HLA system was used to designate the alleles of the three loci studied (24).
Statistical analysis.
The nonparametric statistical analyses used to evaluate significance were one-way analysis of variance (ANOVA), the Kruskal-Wallis test, the Wilcoxon signed-rank test, the two-tailed Mann-Whitney test, and Spearman's rank correlation coefficient, performed using GraphPad prism version 5. The differences were considered statistically significant at two-sided P values of <0.05.
RESULTS
That unresponsiveness to M. leprae may be overcome by selective constituents of the leprosy bacillus was indicated by earlier studies, wherein recombinant Lsr2 and its synthetic peptides were recognized in T cell assays performed in patients with lepromatous leprosy (1). To further identify the regions of Lsr2 that are involved in T cell reactivity, Lsr2 and six end-to-end synthetic peptides (A to F) spanning its sequence were investigated in 21 patients undergoing leprosy reactions (Table 1). Sixteen patients with ENL belonging to multibacillary polar (LL) and borderline lepromatous (BL) leprosy types were serially examined during an active reaction (t = 0) and 0.5 and 1 year following the reaction, with care being taken to avoid the influence of steroids administered as antireaction therapy. Five patients with RR were investigated only during the reaction episode.
ENL reactions. (i) Ex vivo lymphoproliferative responses of PBMCs.
Sixteen patients with ENL (4 with BL and 12 with LL) were included in the study. Thirteen of the patients had previous episodes of ENL and had bacilli in skin lesions at the time of the study (Table 1). Figure 1 provides data on individual subjects and Table 2 overall data on the clinical group studied at 3 time points. It may be observed that, in general, patients with active ENL (t = 0) showed lymphoproliferation in response to recombinant Lsr2 and Lsr2 peptides A through F as well as to M. leprae (Fig. 1). Whereas 69% and 94% of patients showed responses to the whole recombinant Lsr2 protein and M. leprae, respectively (SI range, <2 to 10.5), peptides A and F elicited lymphoproliferation in 100% (SI, 2.1 to 15.7 and 2.0 to 13.2, respectively) and B, C, and D in >75% of patients with ENL, indicating that T cell epitopes of the leprosy bacilli are recognizable during ENL episodes (Table 2). Peptide E was of interest; although it was recognized in only 88% of patients, it elicited the highest Δcpm and SI values among the antigens (Table 2; P of <0.05 to <0.001, ANOVA).
Fig 1.

Individual lymphoproliferative responses of PBMC to end-to-end Lsr2 peptides A through F, recombinant Lsr2, and heat-killed armadillo-derived M. leprae (ML) in 16 patients with erythema nodosum leprosum (ENL)/type 2 leprosy reactions, expressed as stimulation index (SI). The same patients (1 to 16) were investigated at the time of reaction (t = 0), 6 months (0.5 year), and 1 year. Boxes show SI graded as 20 to 40 (black), 10 to 19.9 (dark gray), 5 to 9.9 (hatched), 2 to 4.9 (light gray), and <2 (white). The percentages of responders with an SI of ≥2 to each antigen are shown on the right.
Table 2.
Lymphoproliferative responses of PBMCs from 16 patients with ENL to heat-killed M. leprae, Lsr2, and its peptides A through F at the time of diagnosis and at 0.5 and 1 yeara
| PBMC response | Time (yr) |
||
|---|---|---|---|
| 0 (diagnosis) | 0.5 | 1 | |
| Mean Δcpm ± SD (range) | |||
| Peptide A | 5,117 ± 3,950 (785–15,739) | 2,763 ± 1,866 (808–7,907) | 1,610 ± 1,813 (600–8,282) |
| Peptide B | 4,201 ± 8,760 (850–36,859) | 2,185 ± 1,740 (508–7,738) | 1,499 ± 728 (596–2,968) |
| Peptide C | 3,978 ± 4,195 (554–16,523) | 2,833 ± 2045 (242–7,642) | 1,453 ± 998 (491–4,222) |
| Peptide D | 5,324 ± 4,752 (641–19,065 | 3,229 ± 2,144 (909–7,590) | 1,335 ± 601 (767–2,786) |
| Peptide E | 7,753 ± 7,033 (1,046–2,2591) | 6,375 ± 7,529 (606–31,164) | 2,387 ± 3,422 (847–14,726) |
| Peptide F | 4,638 ± 3,665 (961–14,632) | 3,110 ± 2,102 (823–8,184) | 1,655 ± 764 (847–3,492) |
| Lsr2 | 3,263 ± 3,965.1 (496–15,379) | 2,977 ± 2,002.6 (1,074–7,589) | 2,092 ± 976.37 (972–3915) |
| M. leprae | 4,245 ± 3,882.4 (926–17,794) | 2,658 ± 1,479 (908–5,916) | 1,832 ± 949.98 (887–4,158) |
| Mean SI ± SD (range) | |||
| Peptide A | 6.5 ± 5.2 (2.1–15.7) | 4.3 ± 3.0** (1.4–11.56) | 2.4 ± 2.8** (1.2–10.2) |
| Peptide B | 4.5 ± 6.9 (1.1–10.6) | 3.3 ± 2.6 (1.9–8.9) | 2.0 ± 1.0 (0.69–4.1) |
| Peptide C | 4.9 ± 6.8 (1.2–17) | 4.6 ± 4.4* (1.5–14.2) | 2.1 ± 2.0* (0.86–8.2) |
| Peptide D | 6.3 ± 4.5 (0.9–13.94) | 5.0 ± 3.3** (1.1–11.5) | 2.1 ± 1.8** (0.85–8.6) |
| Peptide E | 12.62 ± 14*** (1.6–41) | 9.7 ± 10.6* (0.5–14) | 3.2 ± 4.3* (0.9–18.5) |
| Peptide F | 6.8 ± 8 (2–13.2) | 5.2 ± 3.8* (1.5–11.2) | 2.3 ± 1.5** (1.7- 4.5) |
| Lsr2 | 4.2 ± 3.5 (0.76–2.1) | 4.5 ± 2.8 (1.3–9.8) | 2.8 ± 1.2 (1.3–4.7) |
| M. leprae | 6.7 ± 5.0* (1.8–11.0) | 4.3 ± 3.1** (1.2–10) | 2.4 ± 1.0* (1.3–4.58) |
Asterisks indicate the statistical significance of the stimulation index at 0 versus 0.5 and 1 year (*, P < 0.01, and **, P < 0.001, Wilcoxon signed-rank test) and peptide E versus B, C, and Lsr2 (***, P < 0.05 to 0.01, one-way analysis of variance).
Individual subjects with ENL showed variations in the magnitude of SI and the number of antigens recognized (Fig. 1). Thus, patients 5, 6, and 13 showed relatively higher SIs to all antigens (SI, <10). These patients had suffered previous ENL episodes (Table 1) but otherwise appeared to show no clinical or histopathological differences to explain the heightened responses. The observed response levels were much higher than those reported earlier in the same population of patients with lepromatous leprosy but without reactions (1).
With a view to understanding the duration of heightened T cell responses, we investigated the same patients at 6 months (0.5 year) and 1 year following the episodes, when no clinical evidence of reaction was discernible. This time period amounted essentially to 3 and 9 months, respectively, after the conclusion of 12 weeks of antireaction therapy with steroids, and thus steroid-induced immune modulation was ruled out. In general, it was noticed that at 0.5 years, patients with ENL continued to show various levels of peptide stimulation ranging from >2.1 to 41, except for patients 14 and 15, who became unresponsive to all peptides (Fig. 1). It is of interest that these patients had been examined 3 to 4 months prior to the present reaction episode and had shown nonresponsiveness to whole antigens as well as the peptides (data not provided). No statistically significant responses were observed for any of the peptides between time zero and the 0.5-year responses (two-tailed Mann-Whitney and Wilcoxon signed-rank tests).
By 1 year, there was a general decrease in lymphoproliferation, with individual patients showing lower SIs or SIs of <2 to different peptides. Five patients lost responsiveness to all peptides, although two of them responded to whole antigens (Fig. 1). Comparison of responses to Lsr2 and its peptides at the 0- and 1-year time points showed significant decreases in the SI and Δcpm values (Table 2) (P <0.01 to 0.004, Wilcoxon signed-rank test). The percentages of responders to M. leprae (63%) and Lsr2 (75%) remained high, whereas the percentages of responders to peptides were reduced to 25 to 44% (Fig. 1), which was within the range reported earlier for the same peptides in stable lepromatous patients from the same population (1). Patients 5 and 6 were also investigated at 5 and 1.5 years, respectively, when responses were not seen for any of the peptides and M. leprae. However, Lsr2 continued to be recognized in patient 5 (data not shown). These results indicate that in some patients the flux in T cell responses continues even after clinical signs of reaction have subsided, whereas in other patients no/reduced lymphoproliferation is seen. The group showing continued responses had suffered from recurrent episodes of ENL.
(ii) IFN-γ release in stimulated PBMC cultures.
The IFN-γ levels were concurrently investigated in the same patients at time zero and 1 year after their ENL episodes. ELISA was used to determine secreted IFN-γ levels in culture supernatants of antigen-stimulated PBMCs, which were analyzed at both the individual subject (Fig. 2) and ENL group (Fig. 3) levels for each antigen. During ENL episodes in general, stimulated PBMC cultures for all subjects showed IFN-γ release. In agreement with lymphoproliferative data, IFN-γ responses also showed wide variation for the same antigen. Some patients responded to all antigens with similar levels of IFN-γ, whereas other patients showed variable levels (Fig. 2 and 3) (range, 52 to 1,842 pg/ml). Cytokine levels correlated well with lymphoproliferation (two-tailed Spearman correlation test) in the patient group. There was highly significant correlation between the two assays (P < 0.0001 with r = 0.8861 for SI and P < 0.0001 with r = 0.6510 for Δcpm). The r value for the two assays was best for peptide E (P < 0.0001 and r = 0.84 for SI, P < 0.0005 and r = 0.76 for Δcpm) compared to other peptides and antigens. There were significant decreases in the levels of IFN-γ at 1 year after the ENL episode (Fig. 2 and 3) for peptides A, C, D, and E (P < 0.001, Kruskal-Wallis test) and for peptide B and M. leprae (P < 0.01), with some subjects showing the lowest detectable level of 8 pg/ml. During ENL and at 1 year post-ENL, patient 12 had IFN-γ responses for peptide E that were similar to the responses that patients 1 and 3 had for M. leprae. At these two time points Lsr2 did not show statistically significant reductions in the cytokine levels in the patient groups.
Fig 2.

Mean ΔIFN-γ levels (pg/ml) estimated by ELISA in duplicate samples of supernatants from PBMC cultures from 16 ENL patients stimulated with Lsr2 peptides A through F and whole antigens as described in the legend to Fig. 1. Black bars indicate IFN-γ levels during active ENL reaction, and gray bars indicate values obtained under the same conditions in the same patients 1 year later for the same peptide. Values are given in a log2 scale on the y axis. Significant reductions in IFN-γ levels were noted in the 1 year post-ENL group of patients for peptides and M. leprae (P < 0.001, Kruskal-Wallis test) but not for Lsr2. Unstimulated cultures showed mean IFN-γ levels of <8 to 5 pg/ml, and each value was subtracted from the value for paired stimulated cultures to obtain ΔIFN-γ values. The sensitivity of the assay was 8 pg/ml.
Fig 3.
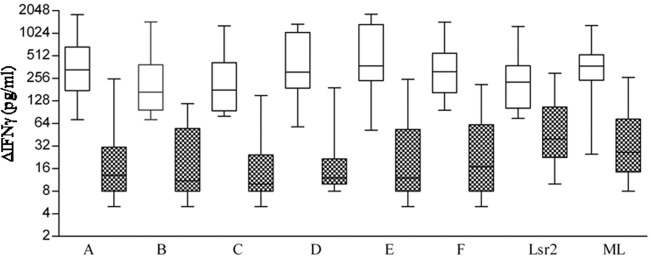
ΔIFN-γ levels in supernatants of antigen-stimulated PBMC cultures from the ENL group of patients as given in the legend to Fig. 1. White boxes indicate values during reaction episodes and patterned boxes values obtained 1 year after reaction episode. Each box-and-whisker plot shows the range (whiskers), interquartile range (box), and median (horizontal line). Significant reductions of IFN-γ were noted at 1 year post-ENL episodes for peptides A, C, D, and E (P < 0.001) and peptide B and M. leprae (P < 0.01, ANOVA with post-Kruskal-Wallis test).
The responses of the whole ENL group were next analyzed for each of the antigens. Figure 3, which presents the data as box plots with whiskers, confirms the wide variation in the groups for each antigen. The highest median values of ΔIFN-γ were noted with peptide E (375.5 pg/ml), followed in decreasing order by peptides A (332.5 pg/ml), F (313.5 pg/ml), D (311 pg/ml), C (179 pg/ml), and B (168 pg/ml). However, due to wide variations in values (ANOVA), statistically significant differences were not found between the peptides or whole antigens. Recombinant Lsr2 elicited lower median IFN-γ values (229 pg/ml) compared to peptides and M. leprae (374 pg/ml). The ENL group as a whole also showed a decrease in IFN-γ levels 1 year after the reaction episode. Peptides A to F elicited significantly lower levels of IFN-γ, with median values ranging from 10 to 17 pg/ml for peptides A through F (P <0.001 to <0.0001 by Kruskal-Wallis test). Lsr2 and M. leprae, respectively, elicited 40 pg/ml and 26.5 pg/ml.
With a view to evaluating the major histocompatibility complex (MHC) binding potential of the above peptides, ENL patients were checked for their HLA genotypes for the HLA-A, -B, and -DRB1 loci. Of interest were four patients who had HLA-A*68:01. Three of the responders (patients 1, 2, and 4) who responded to all the peptides had HLA-A*68:01 along with HLA-A*02 alleles. Patient 7 responded to a few peptides and had HLA-A*68:01 along with HLA-A*23:02. Patient 11 also responded to a few peptides and did not have HLA-A*68:01. These results suggest that these peptides may bind to the HLA-A locus allele HLA-A*68:01, a finding which also is in consensus with the in silico HLA-binding data obtained from the SYFPEITHI program (http://www.ebi.ac.uk/cgi-bin/imgt/HLA/align.cgi), which showed the best binding to sequences in peptide E (81 to 89 aa), with a score of 21, followed by peptide B (35 to 43 aa) and peptide C (53 to 61), with scores of 20. Eleven ENL patients showed HLA-DRB1*1501 and HLA-DRB1*1502, with three patients also having HLA-DR13 and one having HLA-DR3 as the second allele. We previously described a similar HLA-DR profile in patients with leprosy from this population. Using HLAPred software (http://www.imtech.res.in/raghava/hlapred/), we demonstrated that the binding thresholds for peptides C and E for HLA-DRB1*1502 were 7 and 6, respectively, whereas the binding threshold of HLA-DRB1*1501 to peptide C was 7 (1).
The phenotype of Lsr2-induced IFN-γ-producing T cells was established by flow cytometry in representative PBMC cultures from 3 patients with active ENL (Fig. 4). The predominant population with intracellular IFN-γ was the CD3+ CD4+ phenotype, which was found in 73.5 to 82.4% of T cells, whereas the CD3+ CD8+ phenotype was found in 11.2 to 15.3%. M. leprae-stimulated cultures also showed intracellular IFN-γ in 60 to 68% of CD3+ CD4+ T cells, with 27 to 31% being of the CD3+ CD8+ phenotype. That the CD4+/CD8+ ratio was altered by Lsr2 stimulation is indicated by the data shown in Fig. 4, which demonstrate that the ratios for Lsr2- and M. leprae-stimulated cultures were, respectively, 7.03 and 2.2. It may be noted that both antigens also elicited intracellular IFN-γ in the CD3− population (6.1 and 5.4% for Lsr2 and M. leprae, respectively). Thus, it would appear that there is a flux in T cell responses, with different peptides/Lsr2 sequences being recognized in patients with ENL compared to patients from the same population with nonreaction lepromatous leprosy.
Fig 4.

Identification of IFN-γ-producing cells in stimulated ex vivo PBMC cultures from a representative patient with ENL. Flow cytometry analysis was undertaken after 48 h of culture with Lsr2 and heat-killed M. leprae (ML) with the addition of Golgi Stop 8 h prior to harvest, as described in Materials and Methods. Cells were surface stained with PerCP-Cy5-5A-labeled anti-CD3, allophycocyanin (APC-H7) anti-CD4, and phycoerythrin (PE-Cy7)-labeled anti-CD8. Surface-stained cells were then subjected to intracellular cytokine staining with FITC-labeled anti-IFN-γ after permeabilization of the cells. (A) IFN-γ-containing CD3 population after antigen stimulation. The CD3+ population was gated and subsequently analyzed for CD4+ (B) and CD8+ (C) phenotypes with intracellular IFN-γ.
Reversal reactions. (i) Ex vivo lymphoproliferation.
Five patients with a leprosy background of BB, BL, and LL developed RR limited to the lesions and neighboring nerves, with two having suffered from a previous reaction episode (Table 1). Table 3 shows lymphoproliferation and IFN-γ release in PBMCs stimulated with Lsr2 peptides, M. leprae, and recombinant Lsr2. Commensurate with the findings in ENL, 4/5 patients showed lymphoproliferation to all peptides, Lsr2, and M. leprae. Individual responses showed variations in Δcpm and SI for the same peptide. Reduced responses to all peptides except peptide E were observed in patients 17 and 19. Peptide E was recognized in all RR patients, with SI values ranging from 7.4 to 38.
Table 3.
Lymphoproliferative and IFN-γ release responses in supernatants of antigen-stimulated PBMC cultures from leprosy patients with type 1 leprosy reactionsa
| PBMC response | Patient no. |
||||
|---|---|---|---|---|---|
| 17 | 18 | 19 | 20 | 21 | |
| Mean Δcpm ± SD (SI) for responses to: | |||||
| Peptide A | 951 ± 856 (1.3) | 11,569 ± 1875 (14.4) | 1,003 ± 253 (1.8) | 885 ± 104 (2.3) | 3,373 ± 185 (6.1) |
| Peptide B | 385 ± 230 (0.98) | 12,034 ± 2012 (10.5) | 448 ± 92 (1.8) | 808 ± 85 (2.1) | 2,297 ± 201 (5.1) |
| Peptide C | 2,097 ± 245 (1.8) | 11,930 ± 1252 (10.4) | 1,540 ± 155 (2.0) | 1,694 ± 235 (4.4) | 5,136 ± 127 (10.2) |
| Peptide D | 1,398 ± 230 (1.6) | 10,091 ± 1254 (8.9) | 492 ± 88 (1.5) | 847 ± 35 (2.2) | 6,672 ± 327 (12) |
| Peptide E | 17,852 ± 2130 (7.4) | 17,471 ± 1275 (12.8) | 12,182 ± 2340 (9.2) | 14,630 ± 1824 (38) | 3,515 ± 97 (7.3) |
| Peptide F | 1,147 ± 127 (1.5) | 3,936 ± 203 (4.1) | 393 ± 54 (1.5) | 809 ± 203 (2.1) | 6,370 ± 1450 (12.3) |
| Lsr2 | 1,851 ± 230 (2.5) | 17,010 ± 203 (12.4) | 1,950 ± 156 (2.3) | 1,386 ± 167 (3.6) | 5,824 ± 203 (11.4) |
| M. leprae | 820 ± 102 (2.3) | 2,910 ± 128 (2.4) | 722 ± 56 (2.3) | 848 ± 150 (2.2) | 6,777 ± 1295 (13.1) |
| Mean IFN-γ ± SD (pg/ml) for responses to: | |||||
| Peptide A | 205 ± 7.5 | 540 ± 13.0 | 102 ± 6.5 | 175 ± 1.5 | 562 ± 10.4 |
| Peptide B | 75 ± 2.2 | 735 ± 12.0 | 182 ± 6.4 | 315 ± 8.5 | 523 ± 12.5 |
| Peptide C | 128 ± 7.5 | 450 ± 12.5 | 205 ± 3.5 | 507 ± 5.5 | 645 ± 11.0 |
| Peptide D | 82 ± 2.5 | 452 ± 12.0 | 267 ± 7.5 | 312 ± 5.5 | 726 ± 10.2 |
| Peptide E | 746 ± 8.4 | 620 ± 13.2 | 820 ± 10.6 | 1982 ± 11.2 | 567 ± 10.2 |
| Peptide F | 205 ± 7.5 | 180 ± 6.2 | 120 ± 2.5 | 275 ± 8.5 | 845 ± 13.1 |
| Lsr2 | 215 ± 2.5 | 825 ± 2.7 | 218 ± 3.8 | 259 ± 9.7 | 925 ± 12.6 |
| M. leprae | 102 ± 4.5 | 230 ± 5.7 | 245 ± 6.5 | 205 ± 8.6 | 1,024 ± 13.4 |
Peptides A through F are peptides of Lsr2, M. leprae, and heat-killed M. leprae. Unstimulated culture supernatants showed mean IFN-γ levels ranging from 8 to 10 pg/ml. Numbers in parentheses indicate the stimulation index, as described in Materials and Methods.
(ii) IFN-γ release in stimulated PBMC cultures.
In agreement with lymphoproliferation data, IFN-γ release was also detected in stimulated PBMCs (Table 3). Peptide E stimulated higher levels of IFN-γ compared to other peptides.
There were no statistically significant differences in lymphoproliferation and IFN-γ levels between patients with ENL and those with RR (two-tailed Mann-Whitney test).
DISCUSSION
Leprosy reactions which appear episodically in a proportion of patients have high morbidity and are of immediate clinical concern, as they lead to peripheral nerve damage. These reactions are also of interest because immunological reconstitution has been shown to occur in anergic lepromatous leprosy during these episodes (25, 26). ENL, earlier thought to be predominantly due to immune complexes (27, 28), was shown in the 1980s (25, 26, 29, 30) to be associated with the transient emergence of T cell functions. RR has also been associated with increases in delayed-type hypersensitivity (31). Lsr2 peptides had been reported to elicit T cell responses in PBMC cultures of some patients with stable lepromatous leprosy who were nonresponsive to heat-killed M. leprae (1). Moreover, sequence-specific antibodies to Lsr2 peptides were also observed in patients with ENL (16). The present investigation was undertaken to investigate whether T cells of patients undergoing leprosy reactions also show recognition of selective Lsr2 peptides.
T cell responses to Lsr2 and its peptides occurred during both RR and ENL reactions. In general, patients with ENL showed lymphoproliferation in response to many of the peptides as well as recombinant Lsr2 and M. leprae (Fig. 1 and Table 2). Some individuals showed universally high SI values for all peptides (Fig. 1). The median SI values were highest for peptide E compared to Lsr2 and other peptides (P < 0.01 by ANOVA). It is of interest that there was a change in peptide recognition in patients with ENL compared to those with stable, nonreaction lepromatous leprosy from the same population (1). Whereas all patients with ENL responded to peptides A and F, recognition or these peptides occurred in only 26 and 28%, respectively, of patients with stable nonreaction LL who were in the same population (1). The other peptides also elicited lymphoproliferation in a greater number of patients with ENL (75 to 88%) compared not only to those with stable lepromatous leprosy but also to those with tuberculoid leprosy and healthy contacts (1). Peptide E, which elicited responses in 88% of patients with ENL, had elicited responses in only 29% of the group of patients with nonreaction lepromatous leprosy (1). Moreover, peptide E showed the highest SI values among all the antigens examined. We next explored selective binding of peptides to MHC alleles by using both in silico programs and HLA typing of patients with ENL. Of interest was the finding of HLA-A*68:01 in four patients in whom all or most of the peptides were recognized, which was further confirmed by high MHC binding scores obtained using the SYFPEITHI program. However, patient 11, who responded to all of the peptides, did not have this HLA-A locus allele, suggesting that other alleles may present these peptides. Eleven patients with ENL showed HLA-DR B1*1501 and HLA-DR B1*1502. Using HLAPred software, we showed that HLA-DR B1*1501 and HLA-DR B1*1502 have high binding scores for peptides C and E. However, these alleles also have been reported in this population in both patients with nonreaction leprosy and healthy subjects (1). The CD4+ T cells secreting peptide-specific IFN-γ may be restricted by the MHC class II alleles DRB1*15:01 and DRB1*15:02.
Further evidence for the engagement of functional T cells in ENL was the high secretion of IFN-γ in culture supernatants of stimulated PBMC cultures (Fig. 2). In agreement with the lymphoproliferative responses, some patients showed high IFN-γ in response to all peptides, with the highest level being elicited by peptide E, followed in decreasing order by peptides D and A. IFN-γ-producing cells in Lsr2-stimulated PBMC cultures were predominantly of the CD3+ CD4+ T cell phenotype, as indicated by flow cytometry (Fig. 4). Thus, not only was antigen-specific T cell recognition observed during reactions, but there was also a shift in the peptide recognition of Lsr2, for which peptides A, F, and E showed high numbers of responders. These peptides had been shown earlier to have high transporter-associated protein (TAP)-binding scores, with the sequence of AAIREW in peptide E showing a score of 8.602 (1). The RGR sequence seen in the D and E peptides has been also reported to be critical for the binding of Lsr2 to the AT region of the DNA minor groove of M. tuberculosis-derived Lsr2 (10).
The duration of the T cell responses in ENL was studied in the same patients at 6 months and 1 year after the onset of the reaction and months after the cessation of antireaction steroid therapy. It was not possible to study these responses prior to onset of the reaction except in 2 patients who had shown unresponsiveness to all antigens. Although lymphoproliferative responses were reduced by 6 months in 2 patients, the others continued to show SI values of >2 for all peptides. By 1 year there were significant reductions in both lymphoproliferation and IFN-γ levels to Lsr2 and all peptides, with P values ranging from <0.05 to 0.001 (two-tailed Mann-Whitney test, Fig. 2 and Table 2). Two patients with recurrent ENL showed nonresponsiveness to all peptides at 1.5 years and 5 years, with one of the patients continuing to show lymphoproliferation and IFN-γ release in response to recombinant Lsr2. Thus, it would appear that even after the clinical signs of reaction have subsided, T cell responses to Lsr2 and its peptides continue to be detectable, with the extent of peptide recognition decreasing over time in many patients. In five patients with RR, similar results were observed with regard to lymphoproliferation and IFN-γ secretion, for which peptide E elicited the highest responses among the peptides. We were unable to undertake serial investigations in this group. There were no statistically significant differences in the T cell responses during reactions in patients with RR and ENL (two-tailed Mann-Whitney test). It is of interest that reactions emerged in patients receiving clofazamine as part of the antileprosy MDT regimen, as clofazamine is considered to have anti-inflammatory anti-tumor necrosis factor alpha (TNF-α) properties, suggesting the complexity of mechanisms underlying leprosy reactions.
The recurrent ENL observed in many patients with lepromatous leprosy suggests that in response to selective epitopes of M. leprae antigen-specific T cell functions emerge periodically which may be revealed during bacterial killing. The characteristic immunoreactive T cells associated with transient and limited proliferative responses with high levels of IFN-γ production and cytotoxic function have been linked to a subset of effector memory (TEM) cells in antigen-primed individuals (32–34). Repetitive antigen exposure is known to activate TEM cells. Continuous exposure to antigens is observed in bacilliferous lepromatous leprosy due to the chronicity of the disease, slow clearance of bacilli, and release of antigenic fragments from degraded bacilli following MDT treatment. Moreover, in areas where this disease is endemic, it is not possible to rule out the possibility of reinfection with bacilli from other infected patients. The present study showing restitution of lymphoproliferation and IFN-γ production after Lsr2 and peptide stimulation is suggestive of a role for TEM cells. Their reactivation may explain the recurrent reactions seen in multibacillary lepromatous leprosy and the associated pathology unique to these episodes. Interestingly, HIV patients who had received retroviral therapy (highly active antiretroviral therapy [HAART]) presented with leprosy reactions as the first indicator of latent leprosy, which was interpreted to be a result of immune reconstitution inflammatory syndrome (IRIS) (35, 36). This further endorses the natural or iatrogenic emergence of immune responses in leprosy.
Sequences of peptide E showed homology in M. avium, M. intracellulare, and M. tuberculosis (1). T cell epitopes in M. tuberculosis are evolutionarily hyperconserved, suggesting a coevolution of host-pathogen adaptation (37). Lsr2, with increasing reports of homologues and orthologues, suggests such an evolution and makes this protein a promising candidate to be explored as a disease marker/predictor in leprosy reactions. Additional studies are required to narrow down the critical Lsr2 residues recognized during and before the onset of leprosy reactions.
ACKNOWLEDGMENTS
This work received financial support from the Indian Council of Medical Research (ICMR) and the Department of Science and Technology (DST), Government of India. I.N. was supported as a Raja Ramanna Fellow and C.S. as a Senior Research Fellow by DST.
Footnotes
Published ahead of print 27 February 2013
REFERENCES
- 1. Chaduvula M, Murtaza A, Misra N, Narayan NP, Ramesh V, Prasad HK, Rani R, Chinnadurai RK, Nath I. 2012. Lsr2 peptides of Mycobacterium leprae show hierarchical responses in lymphoproliferative assays, with selective recognition by patients with anergic lepromatous leprosy. Infect. Immun. 80: 742–752 [DOI] [PMC free article] [PubMed] [Google Scholar]
- 2. Laal S, Sharma YD, Prasad HK, Murtaza A, Singh S, Tangri S, Misra RS, Nath I. 1991. Recombinant fusion protein identified by lepromatous sera mimics native Mycobacterium leprae in T-cell responses across the leprosy spectrum. Proc. Natl. Acad. Sci. U. S. A. 88: 1054–1058 [DOI] [PMC free article] [PubMed] [Google Scholar]
- 3. Sela S, Thole JE, Ottenhoff TH, Clark-Curtiss JE. 1991. Identification of Mycobacterium leprae antigens from a cosmid library: characterization of a 15-kilodalton antigen that is recognized by both the humoral and cellular immune systems in leprosy patients. Infect. Immun. 59: 4117–4124 [DOI] [PMC free article] [PubMed] [Google Scholar]
- 4. Chen JM, German GJ, Alexander DC, Ren H, Tan T, Liu J. 2006. Roles of Lsr2 in colony morphology and biofilm formation of Mycobacterium smegmatis. J. Bacteriol. 188: 633–641 [DOI] [PMC free article] [PubMed] [Google Scholar]
- 5. Oftung F, Mustafa AS, Wiker HG. 2000. Extensive sequence homology between the mycobacterium leprae LSR (12 kDa) antigen and its Mycobacterium tuberculosis counterpart. FEMS Immunol. Med. Microbiol. 27 87–89 [DOI] [PubMed] [Google Scholar]
- 6. Hatfull GF, Jacobs-Sera D, Lawrence JG, Pope WH, Russell DA, Ko CC, Weber RJ, Patel MC, Germane KL, Edgar RH, Hoyte NN, Bowman CA, Tantoco AT, Paladin EC, Myers MS, Smith AL, Grace MS, Pham TT, O'Brien MB, Vogelsberger AM, Hryckowian AJ, Wynalek JL, Donis-Keller H, Bogel MW, Peebles CL, Cresawn SG, Hendrix RW. 2010. Comparative genomic analysis of 60 Mycobacteriophage genomes: genome clustering, gene acquisition, and gene size. J. Mol. Biol. 397: 119–143 [DOI] [PMC free article] [PubMed] [Google Scholar]
- 7. Pedulla ML, Ford ME, Houtz JM, Karthikeyan T, Wadsworth C, Lewis JA, Jacobs-Sera D, Falbo J, Gross J, Pannunzio NR, Brucker W, Kumar V, Kandasamy J, Keenan L, Bardarov S, Kriakov J, Lawrence JG, Jacobs WR, Jr, Hendrix RW, Hatfull GF. 2003. Origins of highly mosaic mycobacteriophage genomes. Cell 113: 171–182 [DOI] [PubMed] [Google Scholar]
- 8. Colangeli R, Helb D, Vilcheze C, Hazbon MH, Lee CG, Safi H, Sayers B, Sardone I, Jones MB, Fleischmann RD, Peterson SN, Jacobs WR, Jr, Alland D. 2007. Transcriptional regulation of multi-drug tolerance and antibiotic-induced responses by the histone-like protein Lsr2 in M. tuberculosis. PLoS Pathog. 3: e87 doi:10.1371/journal.ppat.0030087 [DOI] [PMC free article] [PubMed] [Google Scholar]
- 9. Gordon BR, Li Y, Wang L, Sintsova A, van Bakel H, Tian S, Navarre WW, Xia B, Liu J. 2010. Lsr2 is a nucleoid-associated protein that targets AT-rich sequences and virulence genes in Mycobacterium tuberculosis. Proc. Natl. Acad. Sci. U. S. A. 107: 5154–5159 [DOI] [PMC free article] [PubMed] [Google Scholar]
- 10. Gordon BR, Li Y, Cote A, Weirauch MT, Ding P, Hughes TR, Navarre WW, Xia B, Liu J. 2011. Structural basis for recognition of AT-rich DNA by unrelated xenogeneic silencing proteins. Proc. Natl. Acad. Sci. U. S. A. 108: 10690–10695 [DOI] [PMC free article] [PubMed] [Google Scholar]
- 11. Summers ELM, Uson K, Mitra I, Radjainia AK, Colangeli M, Alland R, Arcus DVL. 2012. The structure of the oligomerization domain of Lsr2 from Mycobacterium tuberculosis reveals a mechanism for chromosome organization and protection. PLoS One 7: e38542 doi:10.1371/journal.pone.0038542 [DOI] [PMC free article] [PubMed] [Google Scholar]
- 12. Coros A, Callahan B, Battaglioli E, Derbyshire KM. 2008. The specialized secretory apparatus ESX-1 is essential for DNA transfer in Mycobacterium smegmatis. Mol. Microbiol. 69: 794–808 [DOI] [PMC free article] [PubMed] [Google Scholar]
- 13. Wong DK, Lee BY, Horwitz MA, Gibson BW. 1999. Identification of fur, aconitase, and other proteins expressed by Mycobacterium tuberculosis under conditions of low and high concentrations of iron by combined two-dimensional gel electrophoresis and mass spectrometry. Infect. Immun. 67: 327–336 [DOI] [PMC free article] [PubMed] [Google Scholar]
- 14. Betts JC, Lukey PT, Robb LC, McAdam RA, Duncan K. 2002. Evaluation of a nutrient starvation model of Mycobacterium tuberculosis persistence by gene and protein expression profiling. Mol. Microbiol. 43: 717–731 [DOI] [PubMed] [Google Scholar]
- 15. Stewart GR, Wernisch L, Stabler R, Mangan JA, Hinds J, Laing KG, Young DB, Butcher PD. 2002. Dissection of the heat-shock response in Mycobacterium tuberculosis using mutants and microarrays. Microbiology 148: 3129–3138 [DOI] [PubMed] [Google Scholar]
- 16. Singh S, Jenner PJ, Narayan NP, Ramu G, Colston MJ, Prasad HK, Nath I. 1994. Critical residues of the Mycobacterium leprae LSR recombinant protein discriminate clinical activity in erythema nodosum leprosum reactions. Infect. Immun. 62: 5702–5705 [DOI] [PMC free article] [PubMed] [Google Scholar]
- 17. Singh S, Narayanan NP, Jenner PJ, Ramu G, Colston MJ, Prasad HK, Nath I. 1994. Sera of leprosy patients with type 2 reactions recognize selective sequences in Mycobacterium leprae recombinant LSR protein. Infect. Immun. 62: 86–90 [DOI] [PMC free article] [PubMed] [Google Scholar]
- 18. Oftung F, Lundin KE, Meloen R, Mustafa AS. 1999. Human T cell recognition of the Mycobacterium leprae LSR antigen: epitopes and HLA restriction. FEMS Immunol. Med. Microbiol. 24: 151–159 [DOI] [PubMed] [Google Scholar]
- 19. Ridley DS, Jopling WH. 1966. Classification of leprosy according to immunity. A five-group system. Int. J. Lepr. Other Mycobact. Dis. 34: 255–273 [PubMed] [Google Scholar]
- 20. Ridley DS. 1969. Reactions in leprosy. Lepr Rev. 40: 77–81 [DOI] [PubMed] [Google Scholar]
- 21. Nath I, Mehervani C. 2010. Immunological aspects, p 60–73 In Kar HK, Kumar B. (ed), IAL textbook of leprosy. Jaypee Brothers Medical Publishers, Pvt. Ltd., New Delhi, India. [Google Scholar]
- 22. Israni N, Goswami R, Kumar A, Rani R. 2009. Interaction of vitamin D receptor with HLA DRB1 0301 in type 1 diabetes patients from North India. PLoS One 4: e8023 doi:10.1371/journal.pone.0008023 [DOI] [PMC free article] [PubMed] [Google Scholar]
- 23. Singh A, Sharma P, Kar HK, Sharma VK, Tembhre MK, Gupta S, Laddha NC, Dwivedi M, Begum R, Gokhale RS, Rani R. 2012. HLA alleles and amino-acid signatures of the peptide-binding pockets of HLA molecules in vitiligo. J. Investig. Dermatol. 132: 124–134 [DOI] [PubMed] [Google Scholar]
- 24. Marsh SG, Albert ED, Bodmer WF, Bontrop RE, Dupont B, Erlich HA, Fernandez-Vina M, Geraghty DE, Holdsworth R, Hurley CK, Lau M, Lee KW, Mach B, Maiers M, Mayr WR, Muller CR, Parham P, Petersdorf EW, Sasazuki T, Strominger JL, Svejgaard A, Terasaki PI, Tiercy JM, Trowsdale J. 2010. Nomenclature for factors of the HLA system. Tissue Antigens 76: 501–508 [DOI] [PMC free article] [PubMed] [Google Scholar]
- 25. Laal S, Bhutani LK, Nath I. 1985. Natural emergence of antigen-reactive T cells in lepromatous leprosy patients during erythema nodosum leprosum. Infect. Immun. 50: 887–892 [DOI] [PMC free article] [PubMed] [Google Scholar]
- 26. Sreenivasan P, Wilfred MRD, Nath I. 1998. Lepromatous leprosy patients show T helper 1-like cytokine profile with differential expression of interleukin-10 during type 1 and 2 reactions. Immunology 95: 529–536 [DOI] [PMC free article] [PubMed] [Google Scholar]
- 27. Wemambu SN, Turk JL, Waters MF, Rees RJ. 1969. Erythema nodosum leprosum: a clinical manifestation of the arthus phenomenon. Lancet ii: 933–935 [DOI] [PubMed] [Google Scholar]
- 28. Moran CJ, Ryder G, Turk JL, Waters MF. 1972. Evidence for circulating immune complexes in lepromatous leprosy. Lancet ii: 572–573 [DOI] [PubMed] [Google Scholar]
- 29. Modlin RL, Mehra V, Wong L, Fujimiya Y, Chang WC, Horwitz DA, Bloom BR, Rea TH, Pattengale PK. 1986. Suppressor T lymphocytes from lepromatous leprosy skin lesions. J. Immunol. 137: 2831–2834 [PubMed] [Google Scholar]
- 30. Lockwood DNJ, Sagili KD, Chaduvula M, Mohammed I, van Brakel W, Smith WC, Nicholls P, Suneetha S. 2011. Cytokine and protein markers of leprosy reactions in skin and nerves: baseline results for the North Indian INFIR cohort. PLoS Negl. Trop. Dis. 5: e1327 doi:10.1371/journal.pntd.0001327 [DOI] [PMC free article] [PubMed] [Google Scholar]
- 31. Kar HK, Sharma P. 2010. Leprosy reactions, p 269–289 In Kar HK, Kumar B. (ed), IAL textbook of leprosy, vol 1 Jaypee Brothers Medical Publishers, Pvt. Ltd., New Delhi, India [Google Scholar]
- 32. Macchia I, Gauduin MC, Kaur A, Johnson RP. 2006. Expression of CD8alpha identifies a distinct subset of effector memory CD4+ T lymphocytes. Immunology 119: 232–242 [DOI] [PMC free article] [PubMed] [Google Scholar]
- 33. Appay V, van Lier RA, Sallusto F, Roederer M. 2008. Phenotype and function of human T lymphocyte subsets: consensus and issues. Cytometry A 73: 975–983 [DOI] [PubMed] [Google Scholar]
- 34. Adekambi T, Ibegbu CC, Kalokhe AS, Yu T, Ray SM, Rengarajan J. 2012. Distinct effector memory CD4+ T cell signatures in latent Mycobacterium tuberculosis infection, BCG vaccination and clinically resolved tuberculosis. PLoS One 7: e36046 doi:10.1371/journal.pone.0036046 [DOI] [PMC free article] [PubMed] [Google Scholar]
- 35. Cusini A, Weber GHR, Huber M, Kamarashev J, Bertisch B, Peter S, Beck B. 2009. Lepromatous leprosy with erythema nodosum leprosum as immune reconstitution inflammatory syndrome in an HIV-1 infected patient after initiation of antiretroviral therapy. BMJ Case Rep. doi:10.1136/bcr.05.2009.1904 [DOI] [PMC free article] [PubMed] [Google Scholar]
- 36. Pereira GA, Stefani MM, Araujo Filho JA, Souza LC, Stefani GP, Martelli CM. 2004. Human immunodeficiency virus type 1 (HIV-1) and Mycobacterium leprae co-infection: HIV-1 subtypes and clinical, immunologic, and histopathologic profiles in a Brazilian cohort. Am. J. Trop. Med. Hyg. 71: 679–684 [PubMed] [Google Scholar]
- 37. Comas I, Chakravartti J, Small PM, Galagan J, Niemann S, Kremer K, Ernst JD, Gagneux S. 2010. Human T cell epitopes of Mycobacterium tuberculosis are evolutionarily hyperconserved. Nat. Genet. 42: 498–503 [DOI] [PMC free article] [PubMed] [Google Scholar]