

Abstract
Virulence of Cryptococcus neoformans for mammals, and in particular its intracellular style, was proposed to emerge from evolutionary pressures on its natural environment by protozoan predation, which promoted the selection of strategies that allow intracellular survival in macrophages. In fact, Acanthamoeba castellanii ingests yeast cells, which then can replicate intracellularly. In addition, most fungal factors needed to establish infection in the mammalian host are also important for survival within the amoeba. To better understand the origin of C. neoformans virulence, we compared the transcriptional profile of yeast cells internalized by amoebae and murine macrophages after 6 h of infection. Our results showed 656 and 293 genes whose expression changed at least 2-fold in response to the intracellular environments of amoebae and macrophages, respectively. Among the genes that were found in both groups, we focused on open reading frame (ORF) CNAG_05662, which was potentially related to sugar transport but had no determined biological function. To characterize its function, we constructed a mutant strain and evaluated its ability to grow on various carbon sources. The results showed that this gene, named PTP1 (polyol transporter protein 1), is involved in the transport of 5- and 6-carbon polyols such as mannitol and sorbitol, but its presence or absence had no effect on cryptococcal virulence for mice or moth larvae. Overall, these results are consistent with the hypothesis that the capacity for mammalian virulence originated from fungus-protozoan interactions in the environment and provide a better understanding of how C. neoformans adapts to the mammalian host.
INTRODUCTION
Cryptococcus neoformans is an opportunistic pathogen often found in soils contaminated with bird excreta (1). Infection by C. neoformans, which occurs through inhalation of propagules from the environment by the host, seems to be accidental since C. neoformans is a saprophytic fungus that does not require an animal host for replication and survival (2). In the case of human exposure to C. neoformans, the establishment of infection and subsequent development of cryptococcosis depend both on the host's immune response and the virulence of the fungus (3) One of the first lines of defense in the lung are alveolar macrophages, which are able to phagocytose C. neoformans efficiently (4). Phagocytosis is followed by phagosome acidification and fusion of lysosomes (5). However, this process does not always result in the death of yeast cells and C. neoformans can survive and replicate within macrophages in vivo, as shown by Feldmesser et al. (6).
The ability of C. neoformans to survive in the intracellular environment of phagocytes might have a critical role in disease progression and probably contributes to the propensity of the fungus to cause chronic and latent infections (3, 7, 8). However, it is known that the intracellular microenvironment of phagocytes is extremely inhospitable to internalized microorganisms due to nutritional and oxidative stress and exposure to antimicrobial peptides and hydrolytic enzymes (9, 10, 11). To survive the harsh environment of the phagosome, C. neoformans is able to reprogram its gene expression profile. Twenty-four hours after phagocytosis by murine macrophages, C. neoformans responds to carbon starvation by upregulating genes that encode sugar transporters and proteins involved in the utilization of alternative carbon sources, including enzymes of the glyoxylate cycle and fatty acid metabolism. Genes related to the oxidative stress response were also induced (4).
Since C. neoformans is a free-living fungus, its mammalian intracellular lifestyle is particularly curious, given that this organism has no obvious requirement for animal virulence in its life cycle. In this sense, the evolutionary origin and the maintenance of virulence strategies that allow for survival of C. neoformans within macrophages have been an issue of interest, and the investigation of the C. neoformans ecological niche may be informative in this regard. Steenbergen et al. (12) suggested that the competence of C. neoformans to proliferate within mammalian phagocytic cells was initially selected to confer an advantage against environmental predators. This idea was supported by the fact that interaction of C. neoformans with the amoeba Acanthamoeba castellanii results in the ingestion of the fungus followed by its intracellular replication and the accumulation of vesicles containing polysaccharide in the cytoplasm of amoeboid cells (12). This result is similar to those previously observed in the interaction of C. neoformans with macrophages. Furthermore, mutant strains defective in capsule and phospholipase production, two important virulence factors of C. neoformans, are unable to survive within A. castellanii (12), indicating that virulence factors known to be required for the persistence of the fungus in animals can also be required for persistence in environmental predators (13, 14). Additional supportive data for this hypothesis came from the interaction of C. neoformans with the free-living slime mold Dictyostelium discoideum, which significantly increases the virulence of the fungus in a murine model of infection (15). Thus, it has been postulated that the intracellular survival strategy used by C. neorfomans in mammalian macrophages is a consequence of evolutionary selection for fungus survival within soil protozoa.
We hypothesize that this adaptive convergence is a result of the similarity between the intracellular environments of macrophages and amoebae. Consequently, we have compared the transcriptional profiles of C. neoformans after 6 h of interaction with A. castellanii or murine macrophages. Our results suggest a conserved metabolic response of C. neoformans to the microenvironments of both cells.
MATERIALS AND METHODS
Cell lines and media.
The H99 strain of C. neoformans var. grubii (serotype A) was used as the wild-type strain for microarray experiments. The C. neoformans serotype A strain KN99α was used to generate the ptp1Δ mutant and the ptp1Δ::ptp1 complemented strains for the CNAG_05662 open reading frame (ORF). We also used the D1307 mutant strain depleted for the CNAG_05662 reading frame obtained from a C. neoformans mutant library (16) purchased from ATCC. All strains were maintained at −80°C. Cultures were initiated by streaking YPD agar plates (containing 1% yeast extract, 2% Bacto peptone, and 2% dextrose [pH 6.8]) and incubating them for 2 days at 30°C, followed by seeding a single colony in YPD liquid medium and incubating it at 30°C overnight with agitation. The murine macrophage line J774A.1 was maintained at 37°C in 5% CO2 in Dulbecco's modified Eagle's medium (DMEM) (11965; GibcoBRL) supplemented with 10% heat-inactivated fetal calf serum (Gibco BRL), 10% NCTC-109 medium (GibcoBRL; 21340) and 1% nonessential amino acids (GibcoBRL; 11140). The Acanthamoeba castellanii 30234 strain (ATCC) was maintained in the dark at 28°C on PYG medium (2% peptone, 0.1% yeast extract, 1.8% glucose [pH 7.2]).
Phagocytosis assay.
Approximately 1 × 10⁵ cells of the J774A.1 macrophage line or 2 × 10⁵ cells of A. castellanii were added to each well of 96-well tissue culture plates with 200 μl/well of DMEM or PYG medium, respectively. Amoebae and macrophages were cultured for 18 h at 28°C and 37°C in 5% CO2, respectively. Subsequently, the culture supernatant was removed, the remaining cells were washed with sterile 1× phosphate-buffered saline (PBS), and 1 × 10⁶ yeast cells of C. neoformans were added to each well. In both cases, the effector-to-target ratio was about 5:1. For macrophage infections, the monoclonal antibody (MAb) 18B7 was included at 10 μg/ml as an opsonin. The cocultures of C. neoformans with amoebae or macrophages were then incubated for 15 min, 30 min, 1 h, 2 h, 4 h, or 6 h at 28 or 37°C, respectively, in 5% CO2. At each time, the culture supernatant was discarded and wells were washed, fixed with cold methanol, and stained with Giemsa. Using optical microscopy, 100 to 200 cells of amoebae or macrophages were counted per well to determine the percentage of phagocytosis at each interval postinfection. The experiments were performed in quadruplicate. GraphPad Prism 5.0 (GraphPad Software) was used for statistical analyses. The paired two-tailed Student's t test was used, and a P value of ≤0.05 was considered significant. In addition, multiple group comparisons were conducted by one-way analysis of variance (ANOVA) followed by the Bonferroni's correction, as appropriate.
RNA preparation.
For the microarray analysis, C. neoformans yeast cells were grown in YPD for 24 h at 30°C. The cells were harvested by centrifugation, washed twice with 1× PBS, and counted using a hemocytometer. Amoebae and macrophages were each grown in 175-cm2 culture flasks (BD Molecular Biotechnology) with 75 ml of PYG medium or DMEM, respectively, until near confluence. H99 yeast cells were added to each flask at an approximate effector-to-target ratio of 5:1 (108 yeast cells/flask). For macrophage infection, the MAb 18B7 was added at 10 μg/ml. Flasks were incubated for 6 h at 37°C in 5% CO2 (macrophages) or 28°C (amoebae). As controls, H99 cells were cultured in vitro in the same medium under the same temperature and incubation conditions as the macrophage and amoeba cocultures. At 6 h postinfection, extracellular C. neoformans cells and detached phagocytic cells were rinsed off with 1× PBS, and attached amoebae and macrophages were lysed by the addition of 25 mM deoxycholate. This treatment preserves fungal cells (data not shown). Yeast cells were recovered by centrifugation and used for total RNA extraction with TRIzol reagent (Invitrogen) following the manufacturer's recommendations. To minimize contamination with genomic DNA, total RNA was further purified with the RNAeasy kit (Qiagen). The concentration and purity of total RNA were assessed by measuring the 260/280-nm absorbance ratio, and its quality was determined by an Agilent 2100 bioanalyzer (Agilent Technologies) according to the manufacturer's recommendations.
Microarray.
The microarray assay was performed by the Genome Technology Access Center (GTAC) at Washington University in St. Louis (https://gtac.wustl.edu). First-strand cDNA was generated by oligo(dT)-primed reverse transcription (Superscript II; Invitrogen) utilizing the 3DNA Array 350 kit (Genisphere). Modified oligo-dT primers were utilized in which a fluorophore/dendrimer-specific oligonucleotide sequence was attached to the 5′ end of the dT primer. For cDNA synthesis, 1 μl of fluorophore-specific oligo(dT) primer was added to 8 μg of total RNA and the solution was incubated at 80°C for 10 min and then cooled on ice for 2 min. To each sample were added RNase inhibitor (Superase-In; Ambion) (1 μl), 5× first-strand buffer (4 μl), deoxynucleoside triphosphate (dNTP) mix (10 mM each dATP, dCTP, dGTP, and dTTP) (1 μl), 0.1 M dithiothreitol (DTT) (2 μl), and Superscript II RNase H− reverse transcriptase (1 μl). Reverse transcription was carried out at 42°C for 2 h. The reaction was terminated by adding 0.5 M NaOH–50 mM EDTA (3.5 μl) and incubation at 65°C for 15 min and then neutralized with 1 M Tris-HCl (pH 7.5) (5 μl). For RNA expression-level comparison, samples were paired and concentrated using Microcon YM30 microconcentrators (Millipore) according to the manufacturer's protocol. Each sample pair (∼20 μl) was suspended in formamide-based hybridization buffer (vial 7; Genisphere) (26 μl), Array 50dT blocker (Genisphere) (2 μl), and RNase/DNase-free water (4 μl). Two hybridizations were carried out in a sequential manner. The primary hybridization was performed by adding 48 μl of sample to the microarray under a supported glass coverslip (Erie Scientific) at 43°C for 16 to 20 h at high humidity. Prior to the secondary hybridization, slides were gently submerged into 2× SSC (1× SSC is 0.15 M NaCl plus 0.015 M sodium citrate)–0.2% SDS (at 43°C) for 11 min, transferred to 2× SSC (at room temperature) for 11 min, transferred to 0.2× SSC (at room temperature) for 11 min, and then spun dry by centrifugation. Secondary hybridization was carried out using the complementary capture reagents provided in the 3DNA Array 350 kit (Genisphere). For each reaction, the following were added: 3DNA capture reagent with Cy3 (2.5 μl), 3DNA capture reagent with Cy5 (2.5 μl), SDS-based hybridization buffer (vial 6; Genisphere) (26 μl), and RNase/DNase-free water (21 μl). The secondary hybridization solution was incubated in the dark at 80°C for 10 min followed by 50°C for 15 min. Hybridization was performed by adding 48 μl secondary hybridization solution to the slide under a supported glass coverslip at 65°C for 3 h at high humidity in the dark. At hybridization termination, arrays were gently submerged into 2× SSC–0.2% SDS (at 65°C) for 11 min, transferred to 2× SSC (at room temperature) for 11 min, transferred to 0.2× SSC (at room temperature) for 11 min, and then spun dry by centrifugation. To prevent fluorophore degradation, the arrays were treated with Dyesaver (Genisphere). For data analysis, slides were scanned on an Axon 4000B scanner (Molecular Devices) to detect Cy3 and Cy5 fluorescence. Laser power was kept constant for Cy3/Cy5 scans, and the photomultiplier tube (PMT) setting was varied for each experiment based on optimal signal intensity with the lowest possible background fluorescence. A low-PMT-setting scan was also performed to recover signals from saturated elements. Gridding and analysis of images were performed using Genepix v6.1 (Molecular Devices). After background subtraction, median values were imported into the Partek genomics statistical analysis software. Values were log2 transformed, normalized by quantile, and readings lower than 10 were corrected to 10. For fold change and statistical validation of differences, we used two-way ANOVA, taking into account treatment and batch effects. Genes were considered differentially expressed if they presented a fold change equal to or higher than 2 and a P value of ≤0.05.
qRT-PCR.
To validate the microarray data generated by the methodology, quantitative real-time PCR (qRT-PCR) was performed using the same RNA samples used for microarray experiments. For first-strand cDNA synthesis, equal amounts of total RNA (1 μg) were reverse transcribed (Superscript II; Invitrogen) using oligo(dT)12–18 as primer. This cDNA was then used as the template in a qRT-PCR using SYBR green PCR reagents (Applied Biosystems) according to the manufacturer's recommendations. The amplification assays were performed on the ABI PRISM 7900HT sequence detection system (Applied Biosystems) in 8-μl reaction mixtures containing 0.5 μl of each primer (10 μM each), 4 μl of SYBR green PCR reagents (2×) (Applied Biosystems), and 0.2 μl of cDNA. After initial denaturation at 95°C for 10 min, amplifications were performed for 40 cycles at 95°C for 15 s, 58°C for 15 s, and 72°C for 20 s. To confirm the specificity of amplification, melting curves of PCR products were analyzed. The method applied in the analysis of the data from qRT-PCR was the threshold cycle (CT) method, described by Livak and Schmittgen (17). The results were normalized to the expression of the housekeeping gene ACT1, which encodes the protein actin from C. neoformans. The experiment was performed in triplicate for all genes analyzed. All primers used are listed in Table 1.
Table 1.
Primers for C. neoformans genes used in real-time PCR experiments
| Primer | Gene product | Sequence (5′→3′) |
|---|---|---|
| Act F | Actin | TTGTCCTCCCCAATCTTCAC |
| Act R | CGGCGACTTCTTCTTCCATA | |
| Ptp1 F | Polyol transporter protein 1 | TACCGTCCCCATCTTCTCTG |
| Ptp1 R | ATACCAGCAACGACCCAAAG | |
| Cat3 F | Catalase 3 | GTTAAACCAAGCCGCCAATA |
| Cat3 R | CTGATACCTTGACCCCGAAA | |
| Ths F | Trehalose synthase | GCCCAAAGAAGTGGAGATCA |
| Ths R | AGAGCTCCATTGCTCCAGAA | |
| Plc F | Phospholipase C | GTCTTTGTCATGGGCGACTT |
| Plc R | TAGCCGAAGGATGAACTTGG | |
| Gbe F | 1,4-α-Glucan-branching enzyme | ATCCTTGGCTGGAACCTTTT |
| Gbe R | CTTTGAGAATTCGGCGAGAC | |
| Aox F | Alternative oxidase | CCCATTTACACCGAGAAGGA |
| Aox R | AGGAACTTGACGGTCCTGTG | |
| Erg3 F | C-5 sterol desaturase | CCCAGTCCCTTCCTTACCAT |
| Erg3 R | TCATATCACCGTCGTGGATG | |
| Erg11 F | Lanosterol 14 α-demethylase | TCCCATCCACTCGATCTACC |
| Erg11 R | CCCTTGGGGATGATGTATTG | |
| Mls F | Malate synthase | AAACATGGTTCTCGGACAGG |
| Mls R | AGGTCGAACCAAAAGCACAG |
Generation of ptp1Δ mutant strain.
Targeted deletion of the PTP1 gene was accomplished following the double-joint PCR strategy of Kim et al. (18). Briefly, we used PCR to fuse 5′- and 3′-flanking regions of the PTP1 ORF to overlapping, incomplete segments of an expression cassette for the hygromycin phosphotransferase (HYG) gene under the control of the C. neoformans β-actin gene promoter. The two amplicons obtained were then simultaneously transformed in equimolar quantities into the C. neoformans KN99α strain following the biolistics procedure outlined by Toffaletti et al. (19). Transformants were picked under selection by hygromycin and the deletion of PTP1 by homologous recombination with the two amplicons was confirmed by PCR. Southern blotting was used to confirm that a sole insertion event in the targeted locus had occurred. A qRT-PCR was also performed to confirm that the ptp1Δ mutant strain did not express the gene. Reconstitution of the native locus was achieved by simultaneous biolistic transformation of the mutants with an amplicon of the whole wild-type locus plus flanking regions and the plasmid pJAF1 containing the G418 (NEO) resistance cassette. G418+ strains in which the HYG cassette had been expelled by the recombination event that restored PTP1 were selected by their inability to grow on hygromycin.
Phenotype microarray.
Phenotype microarray experiments (Biolog, Hayward, CA) were done as described previously by Nielsen et al. (20). Briefly, after overnight growth in YPD liquid medium, cells were collected by centrifugation, washed with sterile distilled H2O, and resuspended at 105 cells/ml in 12% yeast nitrogen base liquid medium supplemented with histidine, leucine, and uracil. IFY-0 supplemented with 5 mg/ml ammonium sulfate, 0.85 mg/ml potassium phosphate monobasic, 0.15 mg/ml potassium phosphate dibasic, and 0.5 mg/ml magnesium sulfate was the inoculating fluid for the PM1 and PM2 phenotype microarray plates used (http://www.biolog.com/pdf/pm_lit/PM1-PM10.pdf). Cells were combined with supplemented IFY-0 at a ratio of 1:11, and 100 μl of this mixture was added to each well. All phenotype microarrays were incubated at 30°C, and the growth rate of each strain was checked by measuring the change in optical density at 492 nm (OD492) over the course of 72 h. The phenotype microarray results were confirmed by growing the C. neoformans KN99α, ptp1Δ, and ptp1Δ::ptp1 strains in minimal medium (10 mM MgSO4, 29.3 mM KH2PO4, 13 mM glycine, 3 mM thiamine [pH 5.5]) with 1% glucose or mannitol as the only carbon source. C. neoformans D1307 mutant and H99 wild-type strains were compared for the growth rate in minimal medium with 1% of the chosen carbon source, 10 mM MgSO4, 29.3 mM KH2PO4, 13 mM glycine, and 3 mM thiamine (pH 5.5). The sole carbon sources used were glucose, mannose, galactose, xylose, mannitol, sorbitol, dulcitol, ribitol, arabitol, and maltitol. Cultures were incubated for 48 h at 30°C, and growth was checked by measuring the change in optical density at 630 nm every 12 h.
Evaluation of virulence factors expression in vitro.
We used 24-h exponential-phase cultures of the fungus growing in liquid YPD at 30°C under moderate (100-rpm) rotation. Resistance to different stressing agents was tested by serial, five-step 10-fold dilutions of the fungus, starting from 5 × 10⁴ cells per agar spot. To evaluate thermoresistance, the growth rates of wild-type and mutant strains at 37°C were compared as follows. To test for resistance to cell wall-destabilizing agents, the fungus was grown on solid YPD containing Congo red (1% [mass/vol]) or calcofluor white (250 μg/ml) at 37°C or SDS (0.1% [mass/vol]) at 30°C. For resistance to salt stress, the fungus was grown on 1.5 M NaCl in solid YPD at 30°C. The ability to produce phospholipase and urease was tested by spotting 10-μl suspensions containing 103 cells onto solid YPD containing 8% (vol/vol) egg yolk (21) and Christensen's urea agar (0.1% peptone, 0.5% NaCl, 0.2% KH2PO4, 0.1% glucose, 2% urea, 0.0016% phenol red), respectively. To evaluate melanin production, C. neoformans strains were grown in chemically defined minimal medium (15 mM dextrose, 10 mM MgSO4, 29.4 mM KH2PO4, 13 mM glycine, 3 μM thiamine [pH 5.5]) with 1 mM l-DOPA (l-3,4-dihydroxyphenylalanine) (Sigma-Aldrich) and incubated at 30°C in the dark.
Capsule size measurements.
C. neoformans wild-type and mutant strains were grown for 24 h in YPD medium at 30°C, collected by centrifugation, washed twice with 1× PBS, and cultured for 48 h in minimal medium (10 mM MgSO4, 29.3 mM KH2PO4, 13 mM glycine, 3 mM thiamine [pH 5.5]) with 1% glucose or mannitol as only carbon source. Cultures of C. neoformans were diluted in 1× PBS, and an aliquot of each sample was mixed with a drop of India ink (BD Biosciences, NJ). Inspection was performed in an Axiovert 200 M inverted microscope (Carl Zeiss Micro Imaging, NY). Capsule size was measured with the ImageJ 1.39g software (National Institutes of Health, Bethesda, MD) as the distance between the capsule border and the cell wall, corresponding to the India ink exclusion zone. The size of the cell body was also measured. At least 150 yeast cells were evaluated for each experimental condition.
Measurement of mannitol secretion by C. neoformans cells.
C. neoformans cells were inoculated in YPD medium and grown overnight at 30°C. On the following day, the cells were washed 3 times and inoculated at 1.8 × 10⁸ cells/ml in 10 mM potassium phosphate buffer containing glucose at 100 mM and incubated at 30°C with agitation for 3 h, as described before (22). Samples were collected at 0, 1, and 3 h, centrifuged, filtered through a 0.2-μm membrane to remove cells, and analyzed for mannitol in a Shimadzu high-performance liquid chromatography (HPLC) system (Kyoto, Japan) equipped with a refractive index detector. The analysis was performed in isocratic mode at 85°C using a Bio-Rad Aminex HPX-87P column and Milli-Q water as the mobile phase at a flow rate of 0.6 ml/min. A 4-level calibration standard curve was created for commercial glucose and mannitol. The amounts of mannitol and glucose in each sample were calculated using the LCsolution software (Shimadzu, Kyoto, Japan).
Mouse virulence studies.
Groups of 6- to 8-week-old female BALB/c mice (10 mice per group) were obtained from the National Cancer Institute. Intratracheal infection was performed as previously described by Feldmesser and Casadevall (23). Briefly, strains of C. neoformans were cultured in YPD liquid medium (24 h, 30°C, 150 rpm), collected by centrifugation (1,800 × g for 10 min), washed, and resuspended in 1× PBS to a final cell concentration of 2 × 10⁷ cells/ml. Mice were intraperitoneally anesthetized with 100 mg/kg ketamine and 10 mg/kg xylazine. Fifty microliters of the fungal suspension was slowly injected into the previously exposed trachea. The number of live mice was monitored daily. The experiment was repeated twice. The data presented here are from a representative experiment. All animal experiments were previously approved by the Institutional Animal Care and Use Committee of Albert Einstein College of Medicine.
Quantitative analysis of tissue fungal burden.
Groups of 4- to 6-week-old female BALB/c mice (five mice per strain) infected intratracheally with C. neoformans strains were sacrificed by CO2 inhalation at 10 days postinfection. The lungs and brains were removed, weighed, and homogenized in 5 ml sterile 1× PBS. Serial dilutions of the organ samples were plated on Sabouraud agar plates and incubated at 30°C for 48 h. Colony counts were performed and adjusted to reflect the total number of CFU/g tissue.
Galleria mellonella survival experiments.
Galleria mellonella infection was performed as previously described by Garciá-Rodas et al. (24). Briefly, G. mellonella larvae (Vanderhorst Wholesale, Inc., St. Marys, OH, and Mous Livebait R.J., The Netherlands) were inoculated with 10 μl of a 106-cell/ml yeast suspension by an injection in the last left pro-leg using a sterile 26-gauge needle-fitted Hamilton syringe. Infected larvae were incubated at 25 or 37°C, and the number of dead caterpillars was scored daily. A group of G. mellonella larvae was inoculated with 1× PBS as a control for physical injury; another group without any manipulation was set as an untreated control. This experiment was repeated twice. The data presented here are from a representative experiment.
Statistical analyses.
GraphPad Prism 5.0 (GraphPad Software) was used for statistical analyses. The paired two-tailed Student's t test was performed for phenotype microarray, capsule size measurement, and CFU experiments. The log rank test was performed to evaluate statistical differences on survival curves. A P value of ≤0.05 was considered significant.
Microarray data accession number.
The microarray data generated by this study have been deposited into the Gene Expression Omnibus (GEO) (http://www.ncbi.nlm.nih.gov/geo/) under accession no. GSE45027.
RESULTS
Kinetics of C. neoformans phagocytosis by amoebae and murine macrophages.
We carried out an analysis of the kinetics of C. neoformans internalization by the amoeba A. castellanii and murine macrophages to ascertain the optimal time intervals for carrying out experiments. After 4 h of coculture with macrophages, more than 90% contained yeast cells (Fig. 1C). This percentage decreased after 6 h, possibly due to exocytosis of the fungus, which can occur with or without lysis of the host cell (25, 26). The percentage of phagocytosis of C. neoformans by amoebae, however, increased progressively throughout the period evaluated. After 6 h, about 30% of amoebae contained yeasts (Fig. 1C). Encapsulated C. neoformans cells are known to resist ingestion by amoeba (27), and given the low efficiency of phagocytosis by A. castellanii in vitro, 6 h was chosen as the time point for gene expression profiling of C. neoformans recovered from phagocytic cells. Figures 1A and B are representative photomicrographs of macrophages and amoebae, respectively, after 6 h of infection with C. neoformans.
Fig 1.
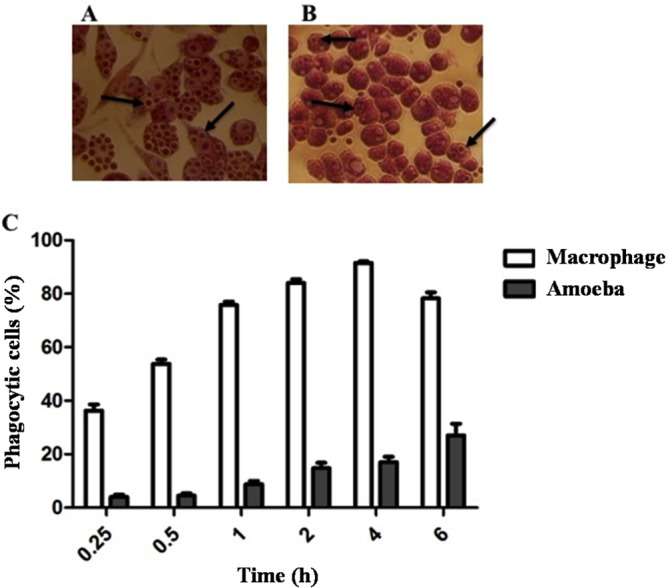
Kinetics of C. neoformans phgocytosis by amoeba and murine macrophages over 6 h. Yeast cells were incubated with amoebae (28°C) or macrophages (37°C and 5% CO2 atmosphere) in a ratio of five C. neoformans yeast cells per host cell. Microphotographs (×40) representing results 6 h postinfection of macrophages (A) and amoebae (B) with C. neoformans are shown above the histogram. The arrows show internalized fungal yeast cells. (C) Percentages of macrophages (white bars) and amoebae (gray bars) containing internalized C. neoformans. These experiments were performed in quadruplicate (mean ± standard error of the mean [SEM]).
Transcriptional profile of C. neoformans inside amoebae and macrophages.
The microarray was used to compare the transcriptional profiles of C. neoformans cells upon interaction with A. castellanii and murine macrophages. Total RNA was extracted from fungal cells either internalized by phagocytes or grown in the corresponding culture medium (control) for 6 h. All RNA preparations satisfied the criteria of integrity, and no contamination with host cell RNA was detected (data not shown).
Analysis of the differential gene expression of C. neoformans during A. castellanii infection indicated modulation of 656 genes from a total of 7,775 genes represented in the microarray assay. (For a complete list, see the supplemental material.) Of these, 322 genes were upregulated more than 2-fold, including genes encoding proteins related to nutrient transport, general metabolism, and oxidative stress response (Fig. 2A), while 334 genes were downregulated (Fig. 2B). Among the latter were genes encoding proteins involved in transcription, translation, and ergosterol biosynthesis. Additionally, genes encoding well-established C. neoformans virulence factors for mammalian hosts were also modulated during amoeba infection.
Fig 2.

Classification of C. neoformans genes modulated after intracellular residence in A. castellanii and murine macrophages. C. neoformans genes induced (A) or repressed (B) after internalization by A. castellanii. C. neoformans genes induced (C) or repressed (D) after internalization by murine macrophages.
A similar analysis was performed to evaluate the transcriptional profile of C. neoformans interacting with murine macrophages for 6 h. The results showed a total of 293 genes whose expression was modulated more than 2-fold in response to the macrophage microenvironment (for a complete list see the supplemental material). The 222 genes of C. neoformans with increased expression included those encoding transporters, chaperones, and proteins involved in the oxidative stress response and metabolism (Fig. 2C). Genes related to ergosterol biosynthesis and oxidative phosphorylation were suppressed, as shown in Fig. 2D.
To validate the data obtained by the microarray assay, qRT-PCR analysis was performed for some C. neoformans genes previously identified in our microarray studies to be modulated in response to the phagocytes' intracellular niches. To correct for differences in RNA quantity among the samples, the gene encoding the actin protein was used as a control. The expression profiles for all genes analyzed by qRT-PCR matched the microarray results with respect to direction (up or down) of modulation (Fig. 3).
Fig 3.

Validation of microarray data by real-time PCR. C. neoformans gene expression after 6 h interaction with A. castellanii (A) and murine macrophages (B). The products of the genes shown are as follows: THS, trehalose synthase; CAT3, catalase 3; GBE, 1,4-α-glucan branching enzyme; PLC, phosphoryl inositol sphingolipid phospholipase C; MLS, malate synthase; PTP1, polyol transporter protein 1; ERG11, lanosterol 14 α-demethylase; ERG3, C-5 sterol desaturase; and AOX, alternative oxidase.
A comparative analysis of transcriptional changes in amoebae and macrophages showed that 111 genes were similarly modulated in response to both intracellular environments. This represents 38% of all genes differentially expressed by C. neoformans during macrophage interaction. Of these genes, 63.1% were induced, while 20.7% were repressed in both intracellular niches. Among the genes whose expression was increased in both macrophages and amoebae, those involved in nutrient transport, oxidative stress response, and general metabolism stand out. In fact, the metabolic responses of C. neoformans to interaction with macrophages and amoebae were very similar. Overall, our results indicate a metabolic switch from glycolysis to gluconeogenesis and fatty acid degradation for conversion to glucose via the glyoxylate cycle (Fig. 4). Conversely, genes related to ergosterol biosynthesis were suppressed after internalization of C. neoformans by both phagocytic cells (Table 2).
Fig 4.

C. neoformans reprogramming of carbon metabolism in response to phagocytosis by amoeba and macrophages. The metabolic pathway scheme shows the differential modulation of several transcripts of enzymes active in gluconeogenesis, glyoxylate cycle, and β-oxidation after C. neoformans internalization by amoebae (A) and macrophages (M).
Table 2.
C. neoformans genes with similar modulation patterns after interaction of the fungus with amoebae and murine macrophages
| Category | Accession no.a | Predicted function | Fold change in: |
|
|---|---|---|---|---|
| Amoebae | Macrophages | |||
| Ergosterol biosynthesis | CNAG_04687 | Stearoyl-CoA 9-desaturase | −2.82949 | −2.5887 |
| CNAG_01737 | C-4 methyl sterol oxidase | −5.10666 | −2.1578 | |
| Oxidative phosphorylation | CNAG_05626 | h-sco1 | −3.39215 | −2.02884 |
| Glyoxylate cycle | CNAG_05303 | Isocitrate lyase | 3.32005 | 12.9474 |
| CNAG_05653 | Malate synthase | 2.09609 | 2.26303 | |
| Oxidative stress | CNAG_02147 | Cytochrome c peroxidase | 3.59838 | 5.1284 |
| CNAG_01846 | Flavoprotein | 3.11961 | 2.0610 | |
| CNAG_05169 | Cytochrome b2 | 2.68905 | 2.7162 | |
| Transcription | CNAG_04345 | RNA polymerase II transcription factor | 2.59053 | 2.40314 |
| Transport | CNAG_07869 | Sugar transporter | 24.5501 | 5.20518 |
| CNAG_05662 | Sugar transporter | 17.4444 | 16.8462 | |
| CNAG_01384 | bodown198 | 8.88579 | 4.86666 | |
| CNAG_01936 | Sugar transporter | 6.84072 | 7.29332 | |
| CNAG_03772 | Glucose transporter | 6.70411 | 11.1359 | |
| CNAG_03910 | d-Xylose-proton symporter | 6.64142 | 2.84406 | |
| CNAG_03060 | Multidrug resistance protein | 6.03422 | 2.11251 | |
| CNAG_01925 | Conserved hypothetical protein | 4.10947 | 2.45472 | |
| CNAG_05685 | Neutral amino acid transporter | 3.44863 | 2.77709 | |
| CNAG_05929 | MFS maltose permease MalP | 2.95817 | 3.30233 | |
| CNAG_02288 | Succinate:fumarate antiporter | 2.68543 | 4.94611 | |
| CNAG_07367 | Amino acid transporter | 2.42433 | 3.12233 | |
| CNAG_04795 | Adenine nucleotide transporter | 2.26578 | 2.83099 | |
| CNAG_07387 | Siderophore-iron transporter Str3 | −2.04064 | −2.56502 | |
| CNAG_03438 | Hexose transporter | −3.94741 | −2.56777 | |
| Pentose phosphate pathway | CNAG_00827 | Ribose 5-phosphate isomerase | 3.00641 | 7.41447 |
| Amino acid metabolism | CNAG_03128 | Lincomycin-condensing protein lmbA | 2.27524 | 2.19625 |
| Carbohydrate metabolism | CNAG_04621 | Glycogen synthase | 5.22439 | 2.17416 |
| CNAG_03067 | Pyruvate carboxyltransferase | 3.79568 | 2.66549 | |
| CNAG_00393 | 1.4-α-Glucan-branching enzyme | 3.33816 | 2.70596 | |
| CNAG_04659 | Pyruvate decarboxylase | −3.97919 | −2.58975 | |
| Lipid metabolism | CNAG_03019 | Long-chain-fatty-acid-CoA ligase | 5.87013 | 2.70475 |
| CNAG_06431 | Acyl-CoA oxidase | 5.64239 | 6.20667 | |
| CNAG_00490 | Acetyl-CoA C-acyltransferase | 5.09895 | 5.5079 | |
| CNAG_03666 | Acyl-CoA dehydrogenase | 5.08676 | 5.62055 | |
| CNAG_06551 | Carnitine O-acetyltransferase | 4.5781 | 5.56428 | |
| CNAG_07747 | Acyl-CoA oxidase I | 4.54934 | 2.41408 | |
| CNAG_02562 | Acyl-CoA dehydrogenase | 4.19328 | 2.79301 | |
| CNAG_02045 | Acetoacyl-CoA synthetase | 3.65055 | 2.95075 | |
| CNAG_03393 | Acyl-CoA thiolesterase | 3.56595 | 2.11571 | |
| CNAG_05721 | Peroxisomal hydratase-dehydrogenase-epimerase | 3.16504 | 3.29229 | |
| CNAG_01116 | β-Ketoacyl reductase | 3.06954 | 2.80628 | |
| CNAG_04392 | Sterol-binding protein | 2.83953 | 3.82553 | |
| CNAG_00537 | Carnitine acetyltransferase | 2.7752 | 3.02984 | |
| CNAG_04238 | 2.4-Dienoyl-CoA reductase | 2.71898 | 2.7285 | |
| CNAG_00371 | Enoyl-CoA hydratase | 2.34604 | 3.14993 | |
| CNAG_04308 | Short-chain 3-hydroxyacyl-CoA dehydrogenase | 2.32894 | 2.66174 | |
| CNAG_01671 | Acetyl/propionyl CoA carboxylase | 2.12004 | 3.93367 | |
| CNAG_00499 | Carnitine/acyl carnitine carrier | 2.10977 | 3.88855 | |
| CNAG_06628 | Aldehyde dehydrogenase | 2.74167 | 6.49193 | |
| CNAG_02087 | Sphingosine N-acyltransferase | −7.58831 | −3.75872 | |
| Nitrogen metabolism | CNAG_03243 | 2-Nitropropane dioxygenase | 3.40319 | 3.0279 |
| CNAG_05644 | 2-Nitropropane dioxygenase | 2.16675 | 4.29356 | |
| Secondary metabolism | CNAG_06623 | myo-Inositol oxygenase | 2.52692 | 2.13304 |
| Redox processes | CNAG_05299 | Oxidoreductase | 3.16418 | 3.35935 |
| CNAG_00541 | Dimethylaniline monooxygenase | −3.47134 | −2.62673 | |
| CNAG_01939 | fmHP | −5.14025 | −2.08856 | |
| CNAG_02577 | Oxidoreductase | −5.33935 | −2.63942 | |
| Other | CNAG_01702 | Integral membrane protein | 11.4333 | 3.68741 |
| CNAG_05229 | Stomatin family protein | 5.47933 | 2.29192 | |
| CNAG_02295 | Phosphotransferase enzyme family domain-containing protein | 4.64925 | 2.60426 | |
| CNAG_07862 | Fumarate reductase | 3.94316 | 9.98097 | |
| CNAG_01252 | Thiosulfate sulfurtransferase | 3.08677 | 2.65488 | |
| CNAG_01794 | 2-Hydroxyacid dehydrogenase | 2.68166 | 2.99315 | |
| CNAG_04096 | Racemase | 2.09515 | 2.30145 | |
| CNAG_02674 | dJ347H13.4 | 2.05302 | 2.52509 | |
| CNAG_04103 | DUF895 domain membrane protein | 2.02542 | 2.75068 | |
| CNAG_02264 | AFG1-family ATPase | −2.25762 | −2.26571 | |
| CNAG_05370 | Integral membrane protein | −4.69223 | −2.34957 | |
| Hypothetical protein | CNAG_04837 | 7.15172 | 6.35904 | |
| CNAG_03394 | 4.22103 | 2.59575 | ||
| CNAG_02405 | 3.51154 | 3.46188 | ||
| CNAG_02978 | 3.17452 | 3.07828 | ||
| CNAG_01847 | 3.06055 | 2.00546 | ||
| CNAG_06583 | 2.76876 | 2.92177 | ||
| CNAG_04394 | 2.75153 | 2.64509 | ||
| CNAG_00079 | 2.74434 | 2.5312 | ||
| CNAG_05784 | 2.67849 | 2.69336 | ||
| CNAG_06355 | 2.65531 | 2.26161 | ||
| CNAG_02044 | 2.3962 | 4.54104 | ||
| CNAG_07708 | 2.33125 | 2.78776 | ||
| CNAG_07912 | 2.01817 | 3.91411 | ||
| CNAG_00315 | 2.00838 | 2.82288 | ||
| CNAG_03857 | −2.04111 | −2.09241 | ||
| CNAG_00349 | −2.05716 | −2.90138 | ||
| CNAG_07568 | −2.19254 | −2.23732 | ||
| CNAG_02910 | −2.45926 | −2.39798 | ||
| CNAG_00814 | −4.9423 | −2.36478 | ||
| CNAG_07920 | −5.37886 | −3.4471 | ||
| CNAG_04891 | −5.38601 | −2.13027 | ||
| CNAG_01803 | −5.56394 | −2.8793 | ||
| CNAG_05741 | −5.82377 | −2.40385 | ||
| CNAG_01369 | −8.89767 | −2.03519 | ||
| CNAG_06590 | −11.3003 | −3.06825 | ||
Accession numbers of genes listed in the homepage of the Cryptococcus neoformans var. grubii genome assembled by the Broad Institute of MIT and Harvard (http://www.broadinstitute.org/annotation/genome/cryptococcus_neoformans).
Although the majority of yeast genes (83.8%) commonly expressed during interaction with both phagocytes were similarly modulated, suggesting that the intracellular environments of amoeba and macrophages are quite comparable, 16.2% of the identified genes were differently modulated (Table 3). Most of them encode hypothetical proteins (39%), transporters (22.2%), and proteins related to metabolism (11.1%), suggesting differences in nutrient availability within phagosomes of macrophages and amoebae.
Table 3.
C. neoformans genes with different modulation patterns after interaction of the fungus with amoeba and murine macrophages
| Category | Accession no.a | Predicted function | Fold change in: |
|
|---|---|---|---|---|
| Amoebae | Macrophages | |||
| Amino acid metabolism | CNAG_05676 | Tyrosine aminotransferase | −3.30706 | 3.31586 |
| Lipid metabolism | CNAG_00984 | Glucose and ribitol dehydrogenase protein | 3.2289 | −2.10481 |
| Redox processes | CNAG_04085 | Oxidoreductase | −4.76438 | 3.27837 |
| CNAG_00876 | Ferric-chelate reductase | −2.39397 | 2.68318 | |
| Translation | CNAG_03563 | Aspartate-tRNA ligase | 2.02203 | −2.59223 |
| Transport | CNAG_04758 | Ammonium transporter | 2.41737 | −2.39166 |
| CNAG_04210 | Sugar transporter | −2.3879 | 2.78891 | |
| CNAG_03426 | GDP-mannose transporter | −2.94678 | 3.16533 | |
| CNAG_00895 | Zinc ion transporter | −4.53653 | 2.67154 | |
| Other | CNAG_03759 | Conidiation-specific protein 6 | 5.73768 | −4.86503 |
| CNAG_06576 | Allergen | 2.38555 | −2.92608 | |
| Hypothetical protein | CNAG_03068 | 9.56139 | −2.24987 | |
| CNAG_02694 | 4.11009 | −2.25959 | ||
| CNAG_00848 | 3.1508 | −2.19634 | ||
| CNAG_02362 | 2.74084 | −2.04115 | ||
| CNAG_06396 | 2.15314 | −2.57459 | ||
| CNAG_01865 | −2.36364 | 4.66234 | ||
| CNAG_00813 | −5.87379 | 4.67373 | ||
Accession numbers of genes listed in the homepage of the Cryptococcus neoformans var. grubii genome assembled by the Broad Institute of MIT and Harvard (http://www.broadinstitute.org/annotation/genome/cryptococcus_neoformans).
Functional study of the C. neoformans ORF CNAG_05662.
The comparison of C. neoformans transcriptomes upon internalization by amoebae and macrophages allowed the identification of genes potentially related to its survival inside host cells. The presumed importance of those genes in C. neoformans adaptation to the harsh phagosome environment translates into a potential role in virulence. Based on the expression levels of C. neoformans genes during interaction with host cells, some were selected for future assessment of their relevance in the establishment of cryptococcosis. Among them, the ORF CNAG_05662, which codes for a sugar transport motif (http://motif.genome.jp/) of 631 amino acids, was particularly interesting since it was strongly induced, by 17.4- and 16.8-fold in amoebae and macrophages, respectively (Table 2). Additionally, the quantitative analysis by qRT-PCR revealed induction levels on the order of 250- and 150-fold upon internalization by amoebae and macrophages, respectively (Fig. 3).
To characterize the function of the ORF CNAG_05662 and investigate its role in the virulence of the fungus, both a strain in which this gene has been mutated (ptp1Δ) and a strain in which this gene has been complemented (ptp1Δ::ptp1) were generated. Southern blotting was performed to confirm a sole insertion event in the targeted locus, and qRT-PCR was performed to confirm that the mutant strain did not express the CNAG_05662 gene, while the complemented strain did (data not shown).
Since the predicted function for the product of CNAG_05662 was related to sugar transport, a phenotype microarray was performed to compare the growth of wild-type (WT), mutant (Mut), and complemented (Rec) strains after 72 h of culture in various carbon sources. Using the PM1 and -2 assays (Biolog, Hayward, CA), we observed that the mutant strain was not able to grow when the carbon source was in the form of polyols, such as d-mannitol, d-sorbitol, dulcitol, arabitol, and adonitol (Fig. 5). This suggested that CNAG_05662 coded for a protein related to the transport of 5- and 6-carbon polyols. In contrast, the fungus was able to grown when erythritol and maltitol were used as carbon sources, suggesting that this gene is not involved in the transport of molecules of 4 and 12 carbons, respectively (Fig. 5). The microarray phenotype was validated assessing the growth curve of the wild-type (WT), mutant (Mut), and complemented (Rec) strains using glucose or mannitol as the carbon source (see Fig. S1 in the supplemental material). Alternatively, we compared the results for the mutant constructed in this work with those for a strain (D1307) obtained from a mutant library constructed by Liu et al. (16) in which the same ORF was deleted. The lack of expression of the gene in the D1307 mutant strain was confirmed by qRT-PCR (data not shown). Incubation of the D1307 strain in different carbon sources for 48 h revealed no growth when mannitol, sorbitol, dulcitol, ribitol, and arabitol were used as the sole carbon sources (see Fig. S2 in the supplemental material), confirming the function of the gene. Consequently, we have named the product of CNAG_05662 “polyol transporter protein 1” (Ptp1).
Fig 5.

Growth rate of KN99α (wild type [W/T]), mutant (Mut), and complemented (Rec) strains of C. neoformans in media with different polyols as sole carbon sources. Yeast cells were cultivated at 30°C for 72 h, and the growth rate was verified by monitoring for color change in the wells and by measuring the variation of optical density at 492 nm as described for the phenotype microarray assay. The t test was performed using GraphPad Prism 5. *, P < 0.05.
Next we assessed whether Ptp1 function was related to mannitol transport out of the cell by inducing and quantifying its secretion by the wild-type, mutant, and reconstituted strains in vitro. Our results showed no statistically significant difference in mannitol secretion levels among them (data not shown), suggesting that Ptp1 is only involved in the transport of polyols into the cell.
Role of the PTP1 gene in the virulence of C. neoformans.
To assess whether expression of PTP1 is related to virulence in C. neoformans, we evaluated the ability of the mutant strain to express known virulence factors in vitro. Our results showed no differences in several phenotypes implicated in virulence, such as growth at 37°C, melanin production, and urease and phospholipase synthesis. The deletion of PTP1 did not result in changes in capsule size when yeast cells were grown in glucose as the only carbon source. However, in contrast to the wild-type strain, the ptp1Δ mutant strain did not increase capsule size in response to mannitol (Fig. 6).
Fig 6.

Capsule diameter of C. neoformans KN99α (wild-type [W/T]) and mutant (Mut) strains grown in glucose or mannitol as unique carbon sources. The capsule diameter was calculated as the difference between the whole-cell size and the cell body size. The capsule size of 150 yeast cells was measured for each condition. The t test was performed using GraphPad Prism 5. *, P < 0.05.
The role of Ptp1 in the virulence of C. neoformans in vivo was investigated comparing the pathogenic potentials of KN99α and ptp1Δ strains using mice and G. mellonella as infection models. The results suggest that these two strains are equivalent in their abilities to establish cryptococcosis in both standard models, since no difference in survival rates of mammalian and invertebrate hosts was observed (Fig. 7A to C). To confirm that KN99α and ptp1Δ strains cause disease in the same way, as suggested by the survival results, we checked the CFU numbers in the lungs and brains of mice at an intermediate time point in the infection (10 days). As shown in Fig. 7D and E, no differences were observed in lung and brain fungal burdens.
Fig 7.

Assessment of in vivo virulence of the ptp1Δ mutant strain. (A) Survival curve of mice infected with KN99α (wild-type [W/T]) and mutant (Mut) strains of C. neoformans. BALB/c mice (10 per group) were intratracheally infected with 106 yeast cells, and mortality was monitored daily. No statistical difference was found by comparing the curves for wild-type and mutant strains. (B and C) Survival curves of Galleria mellonella infected with the KN99α (W/T) and mutant (Mut) strains of C. neoformans. Larvae were infected with 104 yeast cells and maintained at 25°C (A) or 37°C (B). (D and E) Tissue burden of C. neoformans wild-type (W/T) and mutant (Mut) strains. BALB/c mice (five per group) were infected with 106 cells intratracheally, and organs were removed after 10 days of infection. Serial dilutions were plated to determine the number of yeast cells present in the tissue homogenates, expressed by CFU per gram of lung (D) or brain (E).
To assess the role of the PTP1 gene C. neoformans, macrophages and amoebae were infected with both KN99α and ptp1Δ strains for 6 h, and the survival rate of internalized yeast cells was calculated by the number of fungal CFU obtained from lysed host cells. The results show that the ptp1Δ strain exhibited no significant difference in survival compared to the wild type (data not shown). Also, the abilities of macrophages and amoebae to ingest the KN99α and ptp1Δ strains were similar, as measured by the phagocytosis kinetic assay (data not shown).
DISCUSSION
The capacity of the saprophytic fungus C. neoformans for mammalian pathogenesis has been suggested to arise by selection of traits that function in virulence through the interaction with soil predators (28), among which amoebae are of particular interest, since they share certain characteristics with mammalian phagocytic cells, such as macrophages. In fact, the amoebae have been shown to be predators of C. neoformans that influence its survival in soils (29, 30). Several studies have shown parallels in the interaction of C. neoformans with macrophages and amoebae (12, 27, 31). Although these reports support the environmental selection hypothesis, no study to date has focused on the molecular mechanisms central to the adaptation of C. neoformans to the intracellular environment of soil predators that may have allowed it to survive inside mammalian host cells.
If the amoeba hypothesis is correct, one might predict similar C. neoformans transcriptional profiles when it interacts with macrophages and protozoa. To test this prediction, we compared the transcriptional profiles of C. neoformans 6 h after phagocytosis by the amoeba A. castellanii and by murine macrophages. In planning our experimental design, we needed to take into account that the interactions between C. neoformans and amoeba and macrophages occur in very different environments. C. neoformans-amoeba interactions occur at ambient temperatures in soils, which are usually acidic. In contrast, C. neoformans-macrophage interactions occur at 37°C in near-neutral pHs. Thinking through our experimental options, we considered carrying out amoeba-cryptococcus interactions at higher temperatures and or macrophage-cryptococcus interactions at lower temperatures to harmonize the physical conditions but opted against such experiments because they would have represented a highly constrained comparison with little or no relevance to reality. Instead, we focused on comparing these interactions under conditions that approximated the natural interactions, fully aware that differences in temperature and media would introduce additional variables. However, by focusing only on the subset of gene responses induced or repressed by both amoeba and macrophage interactions relative to those outside, we avoided focusing on transcriptional differences resulting from different environmental conditions. We note that classic experiments such as those showing that bacteria use similar virulence genes for plants and animals also required infection of their hosts at different temperatures (32).
Our transcriptional analysis showed totals of 656 and 293 induced genes in C. neoformans ingested by amoebae and macrophages, respectively, whose expression was changed at least 2-fold relative to nonphagocytosed cells. These results allowed us to compare the adaptation of C. neoformans to the intracellular environment of the two hosts on a molecular level. It is interesting that the number of C. neoformans genes induced by the interaction with amoebae was more than two times greater than the number induced upon interaction with macrophages. Although the mechanism responsible for this difference is not understood, we note that an amoeba is a free-living organism that feeds by microbial predation and that it must encounter a very diverse microbiota in soils. Consequently, amoebae may have more versatile microbial killing and digesting mechanisms than macrophages, which would submit C. neoformans to greater stress, leading to a more extensive transcriptional response. Alternatively, the number of genes induced after the interaction with macrophages may be smaller than that observed with the amoeba because C. neoformans-macrophage experiments were carried out at 37°C and the higher temperature can itself induces stress on fungal cells. Despite these differences, the overall categorization of the protein-coding genes revealed a very similar gene expression profile of the fungus inside either phagocyte. We have analyzed the transcriptional response by focusing on gene functional categories.
Gene functional categories. (i) Genes related to the transport of ions and small molecules.
Although little is known concerning the nutritional composition of the phagosome, it is assumed that this organelle is poor in carbon and amino acid sources (33, 34). This nutritional stress induces an adaptive response in intracellular pathogens to allow for survival within phagocytes (4, 9, 35, 36). For example, expression of genes encoding transporter proteins can be translated into more effective assimilation of available nutrients. In agreement with the notion that C. neoformans residence in the phagosome translates into a starvation state, our results show that about 10% of the genes modulated after internalization by amoebae and 13.7% of those genes modulated in response to the macrophage are related to nutrient transport. Fan et al. (4) also reported the transcriptional induction of various C. neoformans transporters after 2 and 24 h of cocultivation with activated macrophages. In addition, Hu et al. (37) identified a large amount of transporters potentially important for the growth of C. neoformans in the lungs of infected mice.
One of the most highly differentially expressed genes by C. neoformans in macrophages and amoebae was the ORF CNAG_05662, which was deduced to be a sugar transporter based on amino acid homology to known proteins. Functional experiments determined that this gene encoded a protein related to the transport of 5- and 6-carbon polyols, which was named Ptp1 (polyol transporter protein 1). The evidence that the PTP1 gene product is involved with mannitol transport was particularly interesting since some studies have correlated the secretion of this polyol by C. neoformans with progression of pathogenesis. The production of d-mannitol by C. neoformans occurs both in vitro (38) and in vivo and contributes to the pathogenesis of meningoencephalitis (39) and virulence in mice (40). Ptp1 appeared to have a role only in the transport of mannitol into the fungal cell and was not involved in its secretion by C. neoformans. Disruption of the PTP1 gene had no effect on the expression of virulence factors by C. neoformans in vitro, such as melanin, urease, and phospholipase. The capsule size of the mutant strain was only affected during growth in mannitol as the sole carbon source. Mannitol is a potent inducer of C. neoformans capsule (41), and as the mutant strain is unable to transport it into the cell, it does not respond to the induction mediated by this polyol. Furthermore, the virulence of the strain lacking PTP1 did not differ from that of the wild-type strain in vitro, in macrophages and amoeba, or in vivo, in mouse and G. mellonella models of infection. These results suggest that, despite its upregulation by C. neoformans inside phagocytic cells, disruption of this gene does not impair the establishment of fungal infection. The absence of an effect in virulence could be explained by the fact that 5- and 6-carbon polyols are unlikely to be sources of energy in vivo, since they have not been reported in animal tissues.
(ii) Genes related to C. neoformans metabolic adaptation to nutritional stress.
Inside the phagosome, intracellular parasites adapt by modulating the expression of genes related to metabolic pathways. For example, the yeast Candida albicans modifies its metabolism to assimilate alternative carbon sources after phagocytosis by macrophages, which is reflected by the induction of the gluconeogenesis, glyoxylate cycle, and β-oxidation pathways (35). Furthermore, C. albicans and Paracoccidioides brasiliensis show a strong reduction in the expression of genes involved in glycolysis in response to the glucose shortage inside the phagosome (35, 36). Similar patterns of expression were also observed for C. neoformans in response to the interaction with both host cells in this study. The switch from glycolysis to gluconeogenesis upon phagocytosis by amoebae and macrophages can be observed in the induction of the genes encoding the enzymes fructose-1,6-bisphosphatase (Fbp1) and phosphoenolpyruvate carboxykinase (Pck1), respectively. C. neoformans cells defective for the PCK1 gene were avirulent in an animal model of infection (42).
The activation of the glyoxylate cycle is another important adaptation of many intracellular pathogens to the phagosomal microenvironment (34, 35, 43). Consistent with those observations, our results showed strong activation of the expression of its two regulatory enzymes, isocitrate lyase (Icl) and malate synthase (Mls), upon interaction of C. neoformans with both amoebae and macrophages. Additionally, our results suggest that acetyl coenzyme A (acetyl-CoA) generated from the oxidation of fatty acids drives the glyoxylate cycle. Transcripts related to enzymes of all steps of the C. neoformans β-oxidation pathway were induced upon internalization by amoebae and macrophages. Furthermore, genes related to peroxisome biogenesis, the organelle associated with cellular functions such as β-oxidation and hydrogen peroxide detoxification, were upregulated. Fatty acid oxidation is also required by other microorganisms after internalization by macrophages, such as C. albicans (35), and by C. neoformans in the lungs of infected mice (37). Taken together, our results show that C. neoformans cells responded similarly to nutritional stress within both amoebae and macrophages.
(iii) Genes related to oxidative/nitrosative stress and the electron transport chain.
We identified seven and four C. neoformans genes related to the oxidative stress response that were upregulated after phagocytosis by A. castellanii and murine macrophages, respectively. Among them, the genes coding for catalases and cytochrome c peroxidase are of particular significance. C. neoformans has four genes that encode distinct catalases, and we showed that two of them were more expressed in response to the interaction with amoebae. Although it is proposed that catalases play an important role in the adaptation of the fungus to the intracellular environment of phagocytes, none of the four isoforms is required for virulence (44), probably due to the redundancy of the antioxidant system in C. neoformans. This may also explain why the enzyme cytochrome c peroxidase, which also acts in the detoxification of H2O2, has no role in the virulence of C. neoformans in mice (45). However, our results showed that its expression was induced after the interaction of the fungus with both hosts, in another case of disconnection between upregulation of gene expression in the presence of the host and role in virulence.
In addition to the oxidative stress, nitrosative stress acts as an antimicrobial mechanism by phagocytic cells. In C. neoformans, the enzyme thioredoxin reductase (Trr1) has been associated with protection from nitrosative stress (46), and we have found its gene upregulated upon phagocytosis by both cells, again suggesting that their microenvironments are similar.
Genes related to the electron transport chain were also modulated by both phagocytes. For example, the gene encoding cytochrome c oxidase (COX1) was downregulated in response to the interaction of C. neoformans with A. castellanii. Cox1 corresponds to the complex IV of the electron transport chain, reducing oxygen into water. This process is essential for cellular energy production but requires oxygen as the final acceptor of electrons. The intracellular environment presents C. neoformans with low levels of oxygen, which can explain the negative regulation of COX1. In agreement with our data, a hypoxic environment represses COX1 expression in Saccharomyces cerevisiae (47). In contrast, there was no decrease in the COX1 expression in macrophages, which may be explained by the fact that this gene is induced at 37°C (48). The evidence that both intracellular environments are low in oxygen was supported by the upregulation of the gene FRD, which encodes the enzyme fumarate reductase. This enzyme uses fumarate as the final acceptor of the electron transport chain, establishing an alternative pathway for energy generation in the absence of oxygen (49). In Mycobacterium tuberculosis, expression of FrdA from the fumarate reductase complex is induced in response to interaction with macrophages (34), and in Mycobacterium phlei, the activity of the Frd complex increases 4-fold when this bacterium is grown under oxygen restriction (50).
(iv) Genes related to thermal stress.
Thermotolerance is critical for the virulence of human pathogens and the trehalose synthesis pathway is crucial for the infectivity of such pathogenic fungi as C. albicans (51, 52) and C. neoformans (53). In C. neoformans, the gene for trehalose synthase is induced at 37°C (54) and knockout strains of C. neoformans for the TPS1 and TPS2 genes, which encode trehalose-phosphate synthase and trehalose-phosphate phosphatase, respectively, are avirulent and unable to grow at 37°C (53). Curiously, our results showed that the TPS1 gene is induced upon interaction of C. neoformans with amoebae at 25°C. Moreover, the Tps1 knockout strain of C. neoformans is less virulent in Caenorhabditis elegans at 25°C (53). These results suggest that the trehalose pathway may be involved in the response to stress conditions other than high temperature. In accordance with this, trehalose plays an important role in tolerance to desiccation (55) and hypoxia (56).
(v) Genes related to ergosterol.
The biosynthesis of one molecule of ergosterol from squalene consumes 12 molecules of oxygen, which represents about 25% of the oxygen not used in the respiratory chain in Saccharomyces cerevisiae (57). Thus, it is expected that the concentration of oxygen in the environment affects ergosterol biosynthesis by fungi. Under hypoxic conditions, the concentration of ergosterol in the membrane of S. cerevisiae is only 25% of the concentration found in normoxia (58). Therefore, hypoxia in the intracellular environment of phagocytes may explain the downregulation of several genes related to ergosterol biosynthesis in C. neoformans after internalization by amoebae and macrophages.
(vi) Genes related to virulence.
Steenbergen et al. (12) reported that strains defective in capsule synthesis and phospholipase B production were unable to survive inside amoebae, suggesting that they were required for persistence of the fungus in both mammalian and soil predator cells. In our experiments, we observed the induction of the genes ISC1 and CAP64, which encode the enzyme C-inositol phosphosphingolipid phospholipase and a protein necessary for the synthesis of polysaccharide capsule, respectively, in response to C. neoformans internalization by A. castellanii. ISC1 is important for C. neoformans survival within macrophages since it protects against nitrosative and oxidative stresses and the acidic pH found in the phagolysosome. Furthermore, ISC1 is crucial for C. neoformans to spread to the central nervous system (59). Likewise, CAP64 seems to be important for C. neoformans virulence since knockout strains are avirulent (60). However, the precise function of CAP64 in capsule formation is unknown (61). The upregulation of ISC1 and CAP64 by C. neoformans in response to A. castellanii suggests a convergence of adaptive mechanisms employed by this fungus to persist in amoebae and mammalian host cells.
Another gene of C. neoformans modulated in response to interaction with A. castellanii coded for the enzyme glucosylceramide synthase (Gcs). GSC is a pathogenesis regulator that ensures the growth of C. neoformans in neutral/alkaline pH and physiological concentrations of CO2, a condition typically found in alveolar spaces. However, GCS has no involvement in fungal growth at acidic pH, as well as in fungal survival inside macrophages (62). In our microarray data, we found a decrease in the GCS transcript level after internalization of yeasts by A. castellanii, implying that this gene is not implicated in the persistence of C. neoformans inside amoebae either. Moreover, this result suggests that the intracellular environment of A. castellanii is acidic, as described for macrophages.
Overall, our results show that the transcriptional responses of C. neoformans to the hostile microenvironments of macrophages and amoebae are similar. The transcriptional profile in response to both phagocytes suggests an adaptive pattern to the stress of ingestion and phagosomal attack. The mechanisms of adaptation to phagocytic cells included the remodeling of central carbon metabolism, the expression of specific nutrient acquisition systems, and a response to the harsh conditions of the phagosome. Analysis of a highly expressed gene led to the identification and characterization of the C. neoformans PTP1. The fact that it was highly activated but irrelevant for murine or moth virulence is consistent with the notion that the transcriptional response to phagocytosis is a general stress response, which would necessarily include many genes that are not important in virulence. Although the transcriptional modulation of a specific gene of C. neoformans within phagocytic cells itself does not necessarily indicate a role in virulence, the comparative transcriptional profile provides insights into the adaptation of the fungus to key features of the host environment. In fact, the similarities between the transcriptional responses to ingestion by amoebae and macrophages are consistent with the view that cryptococcal virulence for mammals was selected by interactions with phagocytic predators in the environment and include adaptation to the intracellular milieu of eukaryotic phagocytic cells.
Supplementary Material
ACKNOWLEDGMENTS
We thank Mike Heinz and Seth Crosby from the Microarray Core Facility of the Washington University School of Medicine for technical assistance. We also thank André Nicola for relevant suggestions.
We thank CNPq and FAP/DF for financial support. L.S.D. was supported by a fellowship from CNPq. A.C. was supported by Public Health Service awards HL059842-3, A1033774, A1052733, and AI033142.
Footnotes
Published ahead of print 22 March 2013
Supplemental material for this article may be found at http://dx.doi.org/10.1128/EC.00073-13.
REFERENCES
- 1. Ellis DH, Pfeiffer TJ. 1990. Ecology, life cycle, and infectious propagule of Cryptococcus neoformans. Lancet 336:923–925 [DOI] [PubMed] [Google Scholar]
- 2. Hogan LH, Klein BS, Levitz SM. 1996. Virulence factors of medically important fungi. Clin. Microbiol. Rev. 9:469–488 [DOI] [PMC free article] [PubMed] [Google Scholar]
- 3. Alanio A, Desnos-Ollivier M, Dromer F. 9 August 2011. Dynamics of Cryptococcus neoformans-macrophage interactions reveal that fungal background influences outcome during cryptococcal meningoencephalitis in humans. mBio 2(4):e00158-11 doi:10.1128/mBio.00158-11 [DOI] [PMC free article] [PubMed] [Google Scholar]
- 4. Fan W, Kraus PR, Boily MJ, Heitman J. 2005. Cryptococcus neoformans gene expression during murine macrophage infection. Eukaryot. Cell 4:1420–1433 [DOI] [PMC free article] [PubMed] [Google Scholar]
- 5. Levitz SM, Nong SH, Seetoo KF, Harrison TS, Speizer RA, Simons ER. 1999. Cryptococcus neoformans resides in an acidic phagolysosome of human macrophages. Infect. Immun. 67:885–890 [DOI] [PMC free article] [PubMed] [Google Scholar]
- 6. Feldmesser M, Kress Y, Novikoff P, Casadevall A. 2000. Cryptococcus neoformans is a facultative intracellular pathogen in murine pulmonary infection. Infect. Immun. 68:4225–4237 [DOI] [PMC free article] [PubMed] [Google Scholar]
- 7. Casadevall A, Perfect JR. 1998. Cryptococcus neoformans: molecular pathogenesis and clinical management. ASM Press, Washington, DC [Google Scholar]
- 8. Feldmesser M, Tucker S, Casadevall A. 2001. Intracellular parasitism of macrophages by Cryptococcus neoformans. Trends Microbiol. 9:273–278 [DOI] [PubMed] [Google Scholar]
- 9. Amer AO, Swanson MS. 2002. A phagosome of one's own: a microbial guide to life in the macrophage. Curr. Opin. Microbiol. 5:56–61 [DOI] [PubMed] [Google Scholar]
- 10. Lorenz MC, Fink GR. 2002. Life and death in a macrophage: role of the glyoxylate cycle in virulence. Eukaryot. Cell 1:657–662 [DOI] [PMC free article] [PubMed] [Google Scholar]
- 11. Romanini L. 2004. Immunity to fungal infections. Nat. Rev. Immunol. 4:1–23 [DOI] [PubMed] [Google Scholar]
- 12. Steenbergen JN, Shuman HA, Casadevall A. 2001. Cryptococcus neoformans interactions with amoebae suggest an explanation for its virulence and intracellular pathogenic strategy in macrophages. Proc. Natl. Acad. Sci. U. S. A. 98:15245–15250 [DOI] [PMC free article] [PubMed] [Google Scholar]
- 13. Steenbergen JN, Casadevall A. 2003. The origin and maintenance of virulence for the human pathogenic fungus Cryptococcus neoformans. Microbes Infect. 5:667–675 [DOI] [PubMed] [Google Scholar]
- 14. Casadevall A, Steenbergen JN, Nosanchuk JD. 2003. ‘Ready made’ virulence and ‘dual use’ virulence factors in pathogenic environmental fungi—the Cryptococcus neoformans paradigm. Curr. Opin. Microbiol. 6:332–337 [DOI] [PubMed] [Google Scholar]
- 15. Steenbergen JN, Nosanchuk JD, Malliaris SD, Casadevall A. 2003. Cryptococcus neoformans virulence is enhanced after growth in the genetically malleable host Dictyostelium discoideum. Infect. Immun. 71:4862–4872 [DOI] [PMC free article] [PubMed] [Google Scholar]
- 16. Liu OW, Chun CD, Chow ED, Chen C, Madhani HD, Noble SM. 2008. Systematic genetic analysis of virulence in the human fungal pathogen Cryptococcus neoformans. Cell 135:174–188 [DOI] [PMC free article] [PubMed] [Google Scholar]
- 17. Livak KJ, Schmittgen TD. 2001. Analysis of relative gene expression data using real-time quantitative PCR and the 2−ΔΔCT method. Methods 25:402–408 [DOI] [PubMed] [Google Scholar]
- 18. Kim MS, Kim SY, Yoon JK, Lee YW, Bahn YS. 2009. An efficient gene-disruption method in Cryptococcus neoformans by double-joint PCR with NAT-split markers. Biochem. Biophys. Res. Commun. 390:983–988 [DOI] [PubMed] [Google Scholar]
- 19. Toffaletti DL, Rude TH, Johnston SA, Durack DT, Perfect JR. 1993. Gene transfer in Cryptococcus neoformans by use of biolistic delivery of DNA. J. Bacteriol. 175:1405–1411 [DOI] [PMC free article] [PubMed] [Google Scholar]
- 20. Nielsen K, Cox GM, Litvintseva AP, Mylonakis E, Malliaris SD, Benjamin DK, Jr, Giles SS, Mitchell TG, Casadevall A, Perfect JR, Heitman J. 2005. Cryptococcus neoformans α strains preferentially disseminate to the central nervous system during coinfection. Infect. Immun. 73:4922–4933 [DOI] [PMC free article] [PubMed] [Google Scholar]
- 21. Chen SC, Wright LC, Santangelo RT, Muller M, Moran VR, Kuchel PW, Sorrell TC. 1997. Identification of extracellular phospholipase B, lysophospholipase, and acyltransferase produced by Cryptococcus neoformans. Infect. Immun. 65:405–411 [DOI] [PMC free article] [PubMed] [Google Scholar]
- 22. Niehaus WG, Flynn T. 1994. Regulation of mannitol biosynthesis and degradation by Cryptococcus neoformans. J. Bacteriol. 176:651–655 [DOI] [PMC free article] [PubMed] [Google Scholar]
- 23. Feldmesser M, Casadevall A. 1997. Effect of serum IgG1 to Cryptococcus neoformans glucuronoxylomannan on murine pulmonary infection. J. Immunol. 158:790–799 [PubMed] [Google Scholar]
- 24. García-Rodas R, Casadevall A, Rodríguez-Tudela JL, Cuenca-Estrella M, Zaragoza O. 2011. Cryptococcus neoformans capsular enlargement and cellular gigantism during Galleria mellonella infection. PLoS One 6:e24485 doi:10.1371/journal.pone.0024485 [DOI] [PMC free article] [PubMed] [Google Scholar]
- 25. Ma H, Croudace JE, Lammas DA, May RC. 2006. Expulsion of live pathogenic yeast by macrophages. Curr. Biol. 16:2156–2160 [DOI] [PubMed] [Google Scholar]
- 26. Alvarez M, Casadevall A. 2006. Phagosome extrusion and host-cell survival after Cryptococcus neoformans phagocytosis by macrophages. Curr. Biol. 16:2161–2165 [DOI] [PubMed] [Google Scholar]
- 27. Zaragoza O, Chrisman CJ, Castelli MV, Frases S, Cuenca-Estrella M, Rodríguez-Tudela JL, Casadevall A. 2008. Capsule enlargement in Cryptococcus neoformans confers resistance to oxidative stress suggesting a mechanism for intracellular survival. Cell. Microbiol. 10:2043–2057 [DOI] [PMC free article] [PubMed] [Google Scholar]
- 28. Casadevall A. 2012. Amoeba provides insight into the origin of virulence in pathogenic fungi. Adv. Exp. Med. Biol. 710:1–10 [DOI] [PubMed] [Google Scholar]
- 29. Bunting LA, Neilson JB, Bulmer GS. 1979. Cryptococcus neoformans: gastronomic delight of a soil ameba. Sabouraudia 17:225–232 [DOI] [PubMed] [Google Scholar]
- 30. Ruiz A, Neilson JB, Bulmer GS. 1982. Control of Cryptococcus neoformans in nature by biotic factors. Sabouraudia 20:21–29 [PubMed] [Google Scholar]
- 31. Chrisman CJ, Albuquerque P, Guimaraes AJ, Nieves E, Casadevall A. 2011. Phospholipids trigger Cryptococcus neoformans capsular enlargement during interactions with amoebae and macrophages. PLoS Pathog. 7:e1002047 doi:10.1371/journal.ppat.1002047 [DOI] [PMC free article] [PubMed] [Google Scholar]
- 32. Rahme LG, Tan MW, Le L, Wong SM, Tompkins RG, Calderwood SB, Ausubel FM. 1997. Use of model plant hosts to identify Pseudomonas aeruginosa virulence factors. Proc. Natl. Acad. Sci. U. S. A. 94:13245–13250 [DOI] [PMC free article] [PubMed] [Google Scholar]
- 33. Lorenz MC, Fink GR. 2001. The glyoxylate cycle is required for fungal virulence. Nature 412:83–86 [DOI] [PubMed] [Google Scholar]
- 34. Schnappinger D, Ehrt S, Voskuil MI, Liu Y, Mangan JA, Monahan IM, Dolganov G, Efron B, Butcher PD, Nathan C, Schoolnik GK. 2003. Transcriptional adaptation of Mycobacterium tuberculosis within macrophages: insights into the phagosomal environment. J. Exp. Med. 198:693–704 [DOI] [PMC free article] [PubMed] [Google Scholar]
- 35. Lorenz MC, Bender JA, Fink GR. 2004. Transcriptional response of Candida albicans upon internalization by macrophages. Eukaryot. Cell 3:1076–1087 [DOI] [PMC free article] [PubMed] [Google Scholar]
- 36. Tavares AH, Silva SS, Dantas A, Campos EG, Andrade RV, Maranhão AQ, Brígido MM, Passos-Silva DG, Fachin AL, Teixeira SM, Passos GA, Soares CM, Bocca AL, Carvalho MJ, Silva-Pereira I, Felipe MS. 2007. Early transcriptional response of Paracoccidioides brasiliensis upon internalization by murine macrophages. Microbes Infect. 9:583–590 [DOI] [PubMed] [Google Scholar]
- 37. Hu G, Cheng PY, Sham A, Perfect JR, Kronstad JW. 2008. Metabolic adaptation in Cryptococcus neoformans during early murine pulmonary infection. Mol. Microbiol. 69:1456–1475 [DOI] [PMC free article] [PubMed] [Google Scholar]
- 38. Onishi H, Suzuki T. 1968. Production of d-mannitol and glycerol by yeasts. Appl. Microbiol. 16:1847–1852 [DOI] [PMC free article] [PubMed] [Google Scholar]
- 39. Wong B, Perfect JR, Beggs S, Wright KA. 1990. Production of the hexitol d-mannitol by Cryptococcus neoformans in vitro and in rabbits with experimental meningitis. Infect. Immun. 58:1664–1670 [DOI] [PMC free article] [PubMed] [Google Scholar]
- 40. Chaturvedi V, Flynn T, Niehaus WG, Wong B. 1996. Stress tolerance and pathogenic potential of a mannitol mutant of Cryptococcus neoformans. Microbiology 142:937–943 [DOI] [PubMed] [Google Scholar]
- 41. Guimarães AJ, Frases S, Cordero RJ, Nimrichter L, Casadevall A, Nosanchuk JD. 2010. Cryptococcus neoformans responds to mannitol by increasing capsule size in vitro and in vivo. Cell. Microbiol. 12:740–753 [DOI] [PMC free article] [PubMed] [Google Scholar]
- 42. Panepinto J, Liu L, Ramos J, Zhu X, Valyi-Nagy T, Eksi S, Fu J, Jaffe HA, Wickes B, Williamson PR. 2005. The DEAD-box RNA helicase Vad1 regulates multiple virulence associated genes in Cryptococcus neoformans. J. Clin. Invest. 115:632–641 [DOI] [PMC free article] [PubMed] [Google Scholar]
- 43. Derengowski LS, Tavares AH, Silva S, Procópio LS, Felipe MS, Silva-Pereira I. 2008. Upregulation of glyoxylate cycle genes upon Paracoccidioides brasiliensis internalization by murine macrophages and in vitro nutritional stress condition. Med. Mycol. 46:125–134 [DOI] [PubMed] [Google Scholar]
- 44. Giles SS, Stajich JE, Nichols C, Gerrald QD, Alspaugh JA, Dietrich F, Perfect JR. 2006. The Cryptococcus neoformans catalase gene family and its role in antioxidant defense. Eukaryot. Cell 5:1447–1459 [DOI] [PMC free article] [PubMed] [Google Scholar]
- 45. Giles SS, Perfect JR, Cox GM. 2005. Cytochrome c peroxidase contributes to the antioxidant defense of Cryptococcus neoformans. Fungal Genet. Biol. 42:20–29 [DOI] [PubMed] [Google Scholar]
- 46. Missall TA, Lodge JK. 2005. Thioredoxin reductase is essential for viability in the fungal pathogen Cryptococcus neoformans. Eukaryot. Cell 4:487–489 [DOI] [PMC free article] [PubMed] [Google Scholar]
- 47. Dagsgaard C, Taylor LE, O'Brien KM, Poyton RO. 2001. Effects of anoxia and the mitochondrion on expression of aerobic nuclear COX genes in yeast: evidence for a signaling pathway from the mitochondrial genome to the nucleus. J. Biol. Chem. 276:7593–7601 [DOI] [PubMed] [Google Scholar]
- 48. Toffaletti DL, Del Poeta M, Rude TH, Dietrich F, Perfect JR. 2003. Regulation of cytochrome c oxidase subunit 1 (COX1) expression in Cryptococcus neoformans by temperature and host environment. Microbiology 149:1041–1049 [DOI] [PubMed] [Google Scholar]
- 49. Li AH, Lam WL, Stokes RW. 2008. Characterization of genes differentially expressed within macrophages by virulent and attenuated Mycobacterium tuberculosis identifies candidate genes involved in intracellular growth. Microbiology 154:2291–2303 [DOI] [PubMed] [Google Scholar]
- 50. Gillespie J, Barton LL, Rypka EW. 1988. Influence of oxygen tension on the respiratory activity of Mycobacterium phlei. J. Gen. Microbiol. 134:247–252 [DOI] [PubMed] [Google Scholar]
- 51. Gancedo C, Flores CL. 2004. The importance of a functional trehalose biosynthetic pathway for the life of yeasts and fungi. FEMS Yeast Res. 4:351–359 [DOI] [PubMed] [Google Scholar]
- 52. Zaragoza O, de Virgilio C, Pontón J, Gancedo C. 2002. Disruption in Candida albicans of the TPS2 gene encoding trehalose-6-phosphate phosphatase affects cell integrity and decreases infectivity. Microbiology 148:1281–1290 [DOI] [PubMed] [Google Scholar]
- 53. Petzold EW, Himmelreich U, Mylonakis E, Rude T, Toffaletti D, Cox GM, Miller JL, Perfect JR. 2006. Characterization and regulation of the trehalose synthesis pathway and its importance in the pathogenicity of Cryptococcus neoformans. Infect. Immun. 74:5877–5887 [DOI] [PMC free article] [PubMed] [Google Scholar]
- 54. Kraus PR, Boily MJ, Giles SS, Stajich JE, Allen A, Cox GM, Dietrich FS, Perfect JR, Heitman J. 2004. Identification of Cryptococcus neoformans temperature-regulated genes with a genomic-DNA microarray. Eukaryot. Cell 3:1249–1260 [DOI] [PMC free article] [PubMed] [Google Scholar]
- 55. Hottiger T, Boller T, Wiemken A. 1987. Rapid changes of heat and desiccation tolerance correlated with changes of trehalose content in Saccharomyces cerevisiae cells subjected to temperature shifts. FEBS Lett. 220:113–115 [DOI] [PubMed] [Google Scholar]
- 56. Chen Q, Haddad GG. 2004. Role of trehalose phosphate synthase and trehalose during hypoxia: from flies to mammals. J. Exp. Biol. 207:3125–3129 [DOI] [PubMed] [Google Scholar]
- 57. Rosenfeld E, Beauvoit B. 2003. Role of the non-respiratory pathways in the utilization of molecular oxygen by Saccharomyces cerevisiae. Yeast 20:1115–1144 [DOI] [PubMed] [Google Scholar]
- 58. Shobayashi M, Mitsueda S, Ago M, Fujii T, Iwashita K, Iefuji H. 2005. Effects of culture conditions on ergosterol biosynthesis by Saccharomyces cerevisiae. Biosci. Biotechnol. Biochem. 69:2381–2388 [DOI] [PubMed] [Google Scholar]
- 59. Shea JM, Kechichian TB, Luberto C, Del Poeta M. 2006. The cryptococcal enzyme inositol phosphosphingolipid-phospholipase C confers resistance to the antifungal effects of macrophages and promotes fungal dissemination to the central nervous system. Infect. Immun. 74:5977–5988 [DOI] [PMC free article] [PubMed] [Google Scholar]
- 60. Wilder JA, Olson GK, Chang YC, Kwon-Chung KJ, Lipscomb MF. 2002. Complementation of a capsule deficient Cryptococcus neoformans with CAP64 restores virulence in a murine lung infection. Am. J. Respir. Cell Mol. Biol. 26:306–314 [DOI] [PubMed] [Google Scholar]
- 61. Chang YC, Penoyer LA, Kwon-Chung KJ. 1996. The second capsule gene of Cryptococcus neoformans, CAP64, is essential for virulence. Infect. Immun. 64:1977–1983 [DOI] [PMC free article] [PubMed] [Google Scholar]
- 62. Rittershaus PC, Kechichian TB, Allegood JC, Merrill AH, Jr, Hennig M, Luberto C, Del Poeta M. 2006. Glucosylceramide synthase is an essential regulator of pathogenicity of Cryptococcus neoformans. J. Clin. Invest. 116:1651–1659 [DOI] [PMC free article] [PubMed] [Google Scholar]
Associated Data
This section collects any data citations, data availability statements, or supplementary materials included in this article.