Abstract
The intense physiologic demand to generate vast numbers of red blood cells requires the establishment of a complex genetic network by the master regulatory transcription factor GATA-1 and its coregulators. This network dictates the genesis of enucleated erythrocytes by orchestrating the survival, proliferation, and differentiation of progenitor cells. In addition to the crucial GATA-1 coregulator Friend of GATA-1 (FOG-1), a component of the Mediator complex, Med1, facilitates GATA-1-dependent transcription at select target genes and controls erythropoiesis. It is not known to what extent Med1 contributes to GATA-1 function or whether Med1 controls a large or restricted cohort of genes that are not regulated by GATA-1. Using a genetic complementation assay in GATA-1-null erythroid cells, we demonstrate that Med1 and another Mediator component, Med25, regulate a restricted cohort of genes that are predominantly not controlled by GATA-1. Most of these genes were not regulated by Med1 in fibroblasts. Loss-of-function analyses with GATA-1-independent Med1 target genes indicate that Rrad, which encodes a small GTPase induced during human erythropoiesis, conferred erythroid cell survival. Thus, while Med1 is a context-dependent GATA-1 coregulator, it also exerts specialized functions in erythroid cells to control GATA-1-independent, cell-type-specific genes, which include candidate regulators of erythroid cell development and function.
INTRODUCTION
Members of the GATA transcription factor family (GATA-1 to GATA-6) regulate a wide range of fundamental biological processes, including the development and homeostasis of the cardiovascular, vascular, neural, and hematopoietic systems (1–11). In the context of hematopoiesis, GATA-1 is essential for the development of erythrocytes, mast cells, megakaryocytes, and platelets (12, 13). GATA-1 knockout mice die at embryonic day 10.5 (E10.5) of severe anemia (14), and human GATA-1 mutations cause leukemias and anemias (15).
GATA proteins have a highly conserved dual zinc finger module that contains determinants for sequence-specific DNA binding and protein-protein interactions (16). The GATA-1 C-terminal zinc finger binds GATA motifs with a consensus of (A/T)GATA(A/G) within naked DNA (17–19) and (C/G)(A/T)GATA(A)(G/C/A)(G/A/C) in cells (20). The N-terminal finger binds the cell-type-restricted coregulator Friend of GATA-1 (FOG-1) (21–23) and broadly expressed coactivators CREB binding protein/p300 (24) and Med1 (25). Med1 is a component of the 30-subunit Mediator complex (26, 27), which is required for transcriptional activation in select contexts. Besides FOG-1, which mediates GATA-1-dependent activation and repression of most of its target genes (21, 23), the relative importance of other coregulators for establishing and maintaining the GATA-1-dependent genetic network is unclear. The coregulator requirements for the control of transcription by GATA-1 are locus specific, since FOG-1 has little to no role in the regulation of a small subset of GATA-1 target genes (23, 28). Although it is reasonable to assume that distinct ensembles of coregulators are operational at different GATA-1 target genes, depending on parameters such as the local chromatin environment and the subnuclear neighborhood (29, 30), the combinatorial usage of coregulators by GATA factors is not understood.
Given the GATA-1–Med1 interaction (25) and the broad importance of Mediator for controlling diverse cellular processes (31, 32), it is instructive to consider how Mediator might function in the context of GATA factor mechanisms/biology. Unlike many coregulators, Mediator subunits lack intrinsic chromatin-remodeling and -modifying activities (26, 27). However, many questions remain regarding the mechanisms underlying Mediator function and its role in establishing and maintaining cell-type-specific genetic networks.
Loss-of-function analyses have highlighted vital cell-type-specific Med1 functions in the control of development (25, 33–37). Med1 knockout mice die during embryogenesis, at E11.5. Homozygous mutant embryos are severely anemic and exhibit cardiac failure and hypervascularization (25, 34). These phenotypes imply that Med1 exerts essential functions only in select cell types. Med1-null murine hematopoietic precursors have strongly reduced erythroid and megakaryocytic differentiation potential in vivo and a reduced capacity to generate erythroid burst-forming units (BFU-E) in a colony assay (25). Myeloid colony generation is unaffected, suggesting that the erythropoiesis defect is cell autonomous. A rigorous erythroid-lineage-specific Med1 knockout confirmed this cell-autonomous activity (37).
The phenotypes of Med1-null mice resemble select phenotypes of mice deficient in GATA-1 (14), GATA-2 (1, 34), and GATA-3 (5, 38), which led to the proposal that Med1 is a GATA factor coactivator (34). Med1 binds GATA-1 and other GATA factors in a glutathione S-transferase (GST) pulldown assay, and Med1 overexpression enhances GATA-1-dependent reporter activity in a transient-transfection assay in mouse embryonic fibroblasts (MEFs) (25). Since physiological GATA-1 functions are often not recapitulated in transient assays, we had assessed endogenous Med1 function in a genetic complementation assay in GATA-1-null erythroid cells (39). G1E-ER-GATA-1 cells, derived from Gata1-null embryonic stem cells (40), stably express GATA-1 fused to the ligand-binding domain of the estrogen receptor (ER-GATA-1) and resemble normal proerythroblasts (41, 42). β-Estradiol activates ER-GATA-1, inducing a physiologically relevant erythroid genetic network and erythroid maturation (42). Since estradiol does not affect G1E cells lacking ER-GATA-1, these cells represent a powerful system for studying GATA-1 mechanisms. Previously, we demonstrated that Med1 is recruited to regulatory sites at all GATA-1-activated loci tested and is evicted upon GATA-1-mediated repression (39). GATA-1 recruited Med1 and FOG-1 with similar kinetics, although chromatin immunoprecipitation (ChIP) studies in Zfpm1−/− cells indicated that FOG-1 is not required for the recruitment of Med1 to GATA-1-bound sites (39). While FOG-1 knockdown nearly abolished GATA-1-mediated activation and repression and prevented maturation, Med1 knockdown only modestly impaired GATA-1 activity at select loci and did not affect erythroid maturation, based on Wright-Giemsa staining and the induction of genes encoding erythroid markers (39). These results raised the question of whether Med1 functions in erythroid cells principally to amplify GATA-1 activity or whether GATA-1-independent functions of Med1 contribute to its requirement for erythropoiesis.
To test these mechanistic issues and to identify Med1 targets with important erythroid cell functions, we conducted a loss-of-function analysis coupled with transcriptional profiling in G1E-ER-GATA-1 cells. These studies established the Mediator target gene ensemble, which includes candidate regulators of erythroid cell maturation and function. One member of this ensemble, Rrad, encodes the small G protein “Ras associated with diabetes,” which has important cardiovascular and metabolic functions but has not been studied in hematopoietic cells (43–47). Our studies revealed a new mode of Rrad function to confer erythroid cell survival, thus demonstrating the utility of mining erythroid Med1 genomic data sets in order to gain functional insights into erythroid cell biology.
MATERIALS AND METHODS
Cell culture.
G1E cells expressing ER-GATA-1 (48) were cultured in Iscove's modified Dulbecco's medium (Gibco) containing 1% antibiotic-antimycotic (penicillin–streptomycin–amphotericin B [Fungizone]) (Gemini Bioproducts), 2 U/ml erythropoietin (Epo), 120 nM monothioglycerol (Sigma), 0.6% conditioned medium from a Kit ligand-producing Chinese hamster ovary (CHO) cell line, 15% fetal bovine serum (FBS) (Gemini Bioproducts), and 1 μg/ml puromycin (Sigma). Mouse erythroleukemia (MEL) cells (49) were cultured in Dulbecco's modified Eagle's medium (Gibco) containing 5% bovine serum (Gibco) and 5% FBS (Gemini Bioproducts) (50). Mouse embryonic fibroblasts (MEFs) were cultured in Dulbecco's modified Eagle's medium (Gibco) containing 10% FBS (Gemini Bioproducts) and 1% penicillin-streptomycin. Zfpm1−/− hematopoietic precursor cells (51) were maintained in Iscove's modified Dulbecco's medium (Gibco) containing 15% FBS (Gemini), 1% antibiotic-antimycotic (Gibco), and 10 ng/ml interleukin 3 (IL-3) (R&D Systems).
Quantitative RT-PCR (qRT-PCR).
RNA was isolated using TRIzol (Invitrogen), and cDNA was prepared from 1 μg RNA as described previously (52). cDNAs were diluted to 150 μl, and 1 μl of cDNA was amplified in a 15-μl reaction volume by real-time PCR using Power SYBR green PCR master mix (Applied Biosystems) and the appropriate primers in the ABI 7900 system (Applied Biosystems). To determine relative enrichment, specific cDNA sequences were compared with a DNA standard by using the comparative cycle threshold method. All data were normalized to 18S mRNA levels. Real-time PCR (RT-PCR) primer sequences are available upon request.
RNA interference.
Knockdown experiments with small interfering RNA (siRNA) were conducted in G1E-ER-GATA-1 and MEL cells and in MEFs by using siGENOME SMARTpool siRNAs from Dharmacon, Inc., as described previously (30, 53). SMARTpools targeting Med1 (M-040964-02), Med25 (M-062635-01), Rrad (M-045857-01), Paqr3 (M-050471-01), Nme4 (M-049846-00), Pilrb2 (M-068412-00), Tnfrsf19 (M-051420-01), and 2310046K01Rik (M-045779-01), as well as individual Rrad siRNAs (MU-049536-01), were compared to a nontargeting control pool (Non-Targeting siRNA Pool 1 [D-001206-13-05]; Dharmacon). To ensure maximal transfection efficiency, siRNAs were electroporated into cells twice, allowing 24 h between transfections, using Amaxa Nucleofector II (Lonza Cologne AG). G1E-ER-GATA-1 and MEL cells were transfected using program G-016 and Nucleofector kit R (Lonza Cologne AG), and MEFs were transfected using program A-23 and Nucleofector kit V (Lonza Cologne AG). A total of 3 × 10⁶ cells were resuspended in 100 μl Nucleofector solution with 240 pmol of siRNA for single knockdowns or 480 pmol total for double knockdowns, electroporated, and transferred to the appropriate medium (4 ml) lacking an antibiotic-antimycotic in 6-well plates (Fisher). Twenty-four hours posttransfection, cells were isolated by centrifugation, transfected again, and treated with 1 μM β-estradiol for an additional 24 h if applicable. Cells were counted, harvested, and used either for the preparation of total RNA or protein or for flow cytometry, or both.
Protein analysis.
Whole-cell lysates were prepared from 1 × 10⁶ cells boiled for 10 min in 100 μl SDS sample buffer (50 mM Tris [pH 6.8], 2% β-mercaptoethanol, 2% sodium dodecyl sulfate [SDS], 0.1% bromophenol blue, 5% glycerol). Med1 and Med25 were resolved by SDS-polyacrylamide gel electrophoresis on 7.5% acrylamide gels, while Rrad proteins were resolved on 10% acrylamide gels. Proteins were analyzed by Western blotting with anti-Med1 (M-255; sc-8998; Santa Cruz), anti-Med25 (N-15; sc-161112; Santa Cruz), anti-Nfkb1 (p105 and p50) (C-19; sc-1190; Santa Cruz), anti-Rrad (a gift from C. Ronald Kahn [43]), and anti-β-tubulin (CP06; Calbiochem) antibodies using ECL+ (GE Healthcare).
Transcriptional profiling.
Knockdowns for gene expression analysis were conducted by electroporation of Med1 siRNA into G1E-ER-GATA-1 proerythroblasts, followed by β-estradiol-dependent ER-GATA-1 activation and erythroid maturation. mRNA was isolated, and aminoallyl RNA (aRNA) was synthesized from the isolated mRNA, labeled, and hybridized to 4×44K mouse whole-genome arrays (Agilent) with a sample size of three. Arrays were read utilizing a G-2505C DNA microarray scanner with SureScan high-resolution technology (Agilent). Data were analyzed using EDGE3 Web-based two-color microarray analysis software (54) and Microsoft Excel, and heat maps were generated utilizing Java TreeView software.
Quantitative ChIP.
G1E-ER-GATA-1 cells were seeded at 2 × 10⁵/ml and were either left untreated or treated with 1 μM β-estradiol (Steraloids, Inc.) for 24 h. Ter119+ mouse primary bone marrow cells were separated by a magnetic cell-sorting system (Miltenyi Biotec) by using anti-Ter119 microbeads (Miltenyi Biotec) as described previously (20). Cells were cross-linked with 1% formaldehyde (Sigma) immediately after harvest, frozen, and stored at −80°C. Chromatin immunoprecipitation (ChIP) was conducted as described previously (55). The anti-Med1 antibody (M-255; sc-8998) was from Santa Cruz Biotechnology. DNA was quantitated by real-time PCR in the StepOnePlus instrument (Applied Biosystems). Primers amplified 50- to 150-bp amplicons; the specific product was measured by SYBR green fluorescence; the product was quantified relative to a standard curve of input chromatin; and dissociation curves showed that PCR yielded single products. ChIP primer sequences are available upon request.
Flow cytometry and analysis.
Cells (100,000) were isolated by centrifugation (6 min, 168 × g), washed with ice-cold phosphate-buffered saline (PBS), and resuspended in 100 μl annexin V binding buffer (V-13246; Invitrogen). Cells were incubated with 5 μl Alexa Fluor 350-conjugated annexin V (A23202; Invitrogen) at room temperature for 15 min in the dark, and then ice-cold annexin V binding buffer (400 μl) was added, followed by 30 μl of a 150-μg/ml propidium iodide (PI) solution in PBS. Samples were kept on ice and were analyzed with a BD LSR II flow cytometer. Alexa Fluor 350-conjugated annexin V was detected with the UV laser (laser at 355 nm; detector filter wavelengths, 450/50 nm), while PI was detected with the green laser (laser at 561 nm; detector filter wavelengths, 710/50 nm). Data were analyzed with FlowJo, version 9.5.2.
Statistical analysis.
Statistical significance was calculated by a paired Student t test with a Web-based tool (http://www.physics.csbsju.edu/stats/ttest.html). Statistical analysis of microarray data was conducted with EDGE3 analysis software (54). Statistical analysis of Gene Ontology (GO) terms was conducted with the online NIH DAVID tool (http://david.abcc.ncifcrf.gov/) (56).
RESULTS AND DISCUSSION
GATA-1-dependent and -independent modes of Med1 transcriptional control.
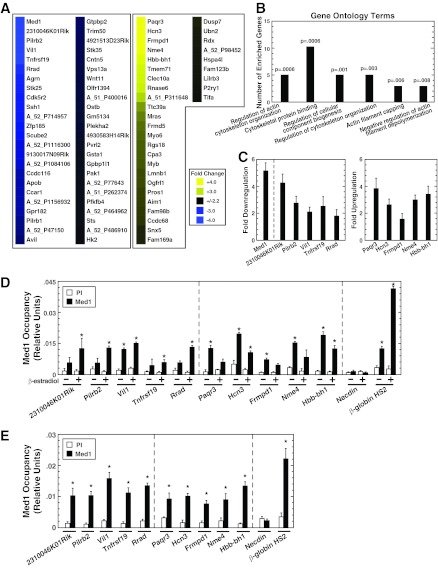
Med1 knockout mice exhibit defective erythropoiesis and megakaryopoiesis (25, 34, 37). Knockdown studies in G1E-ER-GATA-1 cells demonstrated that Med1 amplifies (increase, 20 to 30%) GATA-1-mediated activation of select target genes (39). The hematopoietic defects arising from Med1 loss in vivo may result from altered expression of a restricted gene cohort or broad remodeling of the erythroid and/or megakaryocytic cell genetic network. To test these possibilities, we conducted transcriptional profiling in G1E-ER-GATA-1 cells undergoing erythroid maturation driven by ER-GATA-1 after siRNA-mediated knockdown of Med1 (∼95% reduction of Med1 protein levels). This analysis revealed 163 genes regulated ≥2-fold by Med1, of which 82 were regulated ≥2.2-fold (Fig. 1A). Of the 163 genes, 102 were downregulated ≥2-fold and 48 were downregulated ≥2.2-fold, while 61 were upregulated ≥2-fold and 34 were upregulated ≥2.2-fold. These results indicate that a large reduction in Med1 levels alters the expression of a restricted gene cohort in G1E-ER-GATA-1 cells.
Fig 1.
Med1 regulates a novel gene ensemble in erythroid cells. (A) Heat map of genes up- or downregulated ≥2.2-fold by Med1. Results are mean fold changes calculated from normalized signals from three Agilent 4×44K mouse whole-genome arrays hybridized to aRNAs isolated (in three independent experiments) from control and Med1-knockdown G1E-ER-GATA-1 cells induced to undergo erythroid maturation with β-estradiol. (B) Major Gene Ontology terms that are significantly overrepresented in the Med1 target gene cohort. GO term categories are presented in order of statistical significance along the x axis, while the number of enriched genes per category is shown along the y axis (56). (C) qRT-PCR validation of Med1 target genes. Levels of mRNA in G1E-ER-GATA-1 cells treated with 240 pmol control or Med1 siRNA for 48 h and 1 μM β-estradiol for 24 h were quantified. Results are means ± standard errors for six independent experiments. (D) Quantitative ChIP analysis of Med1 occupancy at Med1-regulated genes in G1E-ER-GATA-1 cells either left untreated or treated with 1 μM β-estradiol for 24 h. Results are means ± standard errors for three independent experiments. (E) Quantitative ChIP analysis of Med1 occupancy at Med1-regulated genes in Ter119+ primary mouse bone marrow cells. Results are means ± standard errors for three technical replicates.
To gain insight into the function of the Med1-dependent genetic network, we conducted Gene Ontology analysis utilizing NIH DAVID (56). All significantly (P < 0.01) enriched gene categories were related to the cytoskeleton (Fig. 1B). These GO terms do not characterize GATA-1 target genes in erythroid cells (20). The changes in expression of the top 5 upregulated (Fig. 1C, right) and downregulated (Fig. 1C, left) genes were validated by qRT-PCR. To determine if these Med1-regulated genes are direct Med1 targets, we conducted quantitative chromatin immunoprecipitation (ChIP) analysis with an anti-Med1 antibody in β-estradiol-treated G1E-ER-GATA-1 cells containing active ER-GATA-1 and in untreated cells containing inactive ER-GATA-1. Med1 occupancy at the promoters of the validated Med1 target genes in G1E-ER-GATA-1 cells was quantitated (Fig. 1D). Med1 occupancy was detected at all 10 promoters, with signals considerably higher than that for the inactive Necdin promoter, suggesting that these genes are direct targets. To determine if Med1 occupies the promoters of these genes in primary erythroid cells, we conducted Med1 ChIP in Ter119+ cells isolated from adult mouse bone marrow. Statistically significant levels of Med1 occupancy were detected at the Med1-regulated genes and β-globin HS2 but not at the inactive Necdin promoter, indicating that Med1 occupies these genes in primary mouse erythroid cells (Fig. 1E).
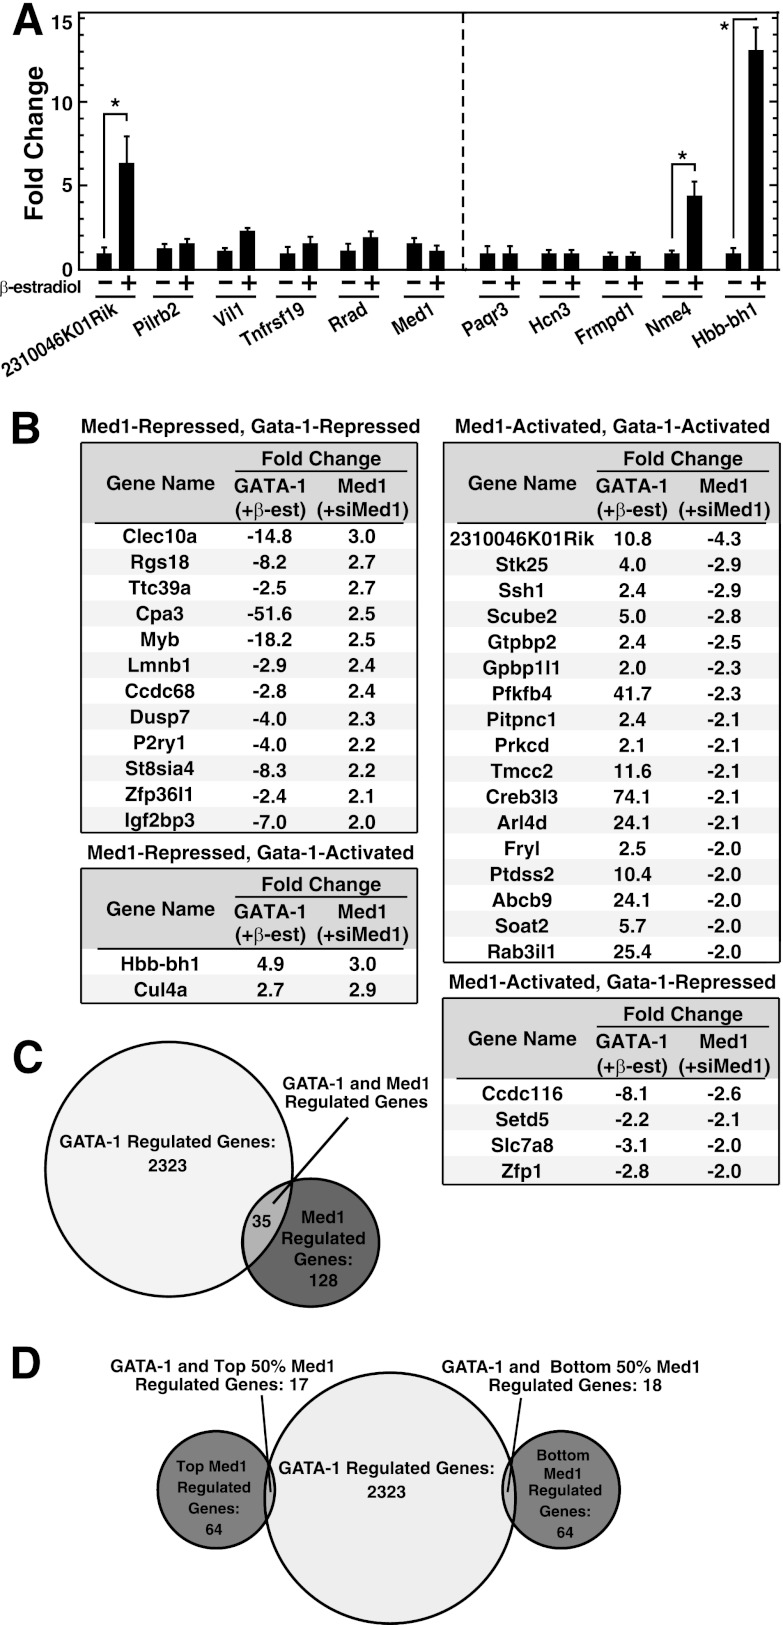
Comparison of Med1 and GATA-1 target gene ensembles revealed that the dysregulated genes in the analysis described above do not include hallmark erythroid genes. Although loss-of-function studies in mice revealed that an important Med1 function is to regulate erythropoiesis (25, 34, 37), and although Med1 amplifies the GATA-1-mediated transcriptional activation of select loci (39), it is not clear whether Med1 regulation of erythropoiesis involves principally or exclusively GATA-1-dependent or -independent mechanisms. qRT-PCR was used to quantitate the expression of the top 10 Med1-regulated genes in β-estradiol-induced and uninduced G1E-ER-GATA-1 cells (Fig. 2A). This analysis revealed that in addition to the known GATA-1-regulated gene Hbb-bh1, GATA-1 activated the Med1-regulated genes Nme4 and 2310046K01Rik 4- to 5-fold (P < 0.05). The remaining 7 genes were not significantly affected. In principle, the GATA-1–Med1-coregulated genes identified here might represent genes occupied by both GATA-1 and Med1, while the GATA-1-insensitive Med1-regulated genes might represent genes occupied solely by Med1. By utilizing published GATA-1 ChIP-seq (ChIP followed by sequencing) data sets from murine G1E-ER-GATA-1 cells (57), human K562 erythroleukemia cells (20), and primary human CD34+ cell-derived erythroblasts (58), GATA-1 occupancy was interrogated at GATA-1-sensitive (Nme4 and 2310046K01Rik) and -insensitive (Pilrb2, Rrad, and Vil1) genes. Although Med1 occupied the promoters of all Med1-regulated genes, GATA-1 occupancy did not uniquely demarcate the GATA-1–Med1-coregulated gene cohort.
Fig 2.
Med1 target genes in erythroid cells are predominantly GATA-1 independent. (A) qRT-PCR validation demonstrating that Med1 targets are predominantly not regulated by GATA-1. qRT-PCR was used to quantify mRNA in G1E-ER-GATA-1 cells treated with 1 μM β-estradiol for 24 h. Results are means ± standard errors for three independent experiments. *, P < 0.05. (B) Table of Med1–GATA-1-coregulated genes. GATA-1 or Med1 regulation is presented as the average fold change in gene expression in treated cells (1 μM β-estradiol for 24 h or 240 pmol Med1 siRNA for 48 h, respectively) from that in untreated cells or cells treated with control siRNA, respectively, as measured by aRNA hybridization to Agilent 4×44K mouse whole-genome arrays (3 arrays each for GATA-1 induction and Med1 knockdown) (20). (C) Venn diagram indicating the degree of overlap between Med1 and GATA-1 target genes. (D) Venn diagram indicating the overlaps between Med1 target genes in the top (highest level of regulation) and bottom (lowest level of regulation) 50% and GATA-1.
To extend this analysis to the full Med1 target gene ensemble, we compared genes dysregulated by Med1 knockdown to ER-GATA-1-regulated genes defined by our additional array analyses, conducted utilizing the Illumina Sentrix BeadChip platform (15) and the Agilent SurePrint G3 Mouse Gene Expression 8×60K microarray platform (unpublished data), in G1E-ER-GATA-1 cells. This comparison yielded an ensemble of Med1–GATA-1-coregulated genes (Fig. 2B). Of the 163 Med1-regulated genes and the 2,358 GATA-1-regulated genes, only 35 genes (22% of the Med1-regulated genes, consistent with the qRT-PCR analysis) were coregulated by GATA-1 and Med1 in a qualitatively identical manner (Fig. 2C). Gene ontology analysis of these 35 genes revealed “primary metabolic process” to be the sole significant classifier, with 16 genes assigned to this category. To further dissect the functional overlap between Med1 and GATA-1 regulation, the ensemble of statistically significantly Med1 regulated genes was subdivided into two groups consisting of the top 50% and the bottom 50%, based on the magnitude of Med1 regulation. We asked whether the most highly Med1 regulated genes were more or less likely to be coregulated by GATA-1 (Fig. 2D). Seventeen of the 35 GATA-1–Med1-coregulated genes reside in the top 50% of Med1-regulated genes, while 18 of the 35 reside in the bottom 50%. This analysis indicates that this small cohort of 35 GATA-1–Med1-coregulated genes exhibits various degrees of Med1 responsiveness.
The GATA-1–Med1-coregulated gene cohort was also compared to the limited number of established FOG-1-independent GATA-1 target genes (Lyl1, Epb49, Rgs1, Rgs13, Rgs18, Treml2, Clec4d, Adamts5, Tmem44, Klf1, HRI, Tac2, and Zfpm1) (28). The cohort of 35 GATA-1–Med1-coregulated genes contained only 1 FOG-1-independent gene, Rgs18, indicating that FOG-1 independence does not correlate with Med1 regulation. Although the Med1 target gene Nme4 was implicated as a GATA-1 target gene by RT-PCR analysis, Nme4 fell below the cutoff for statistical significance used for the microarray data analysis and therefore is not presented in Fig. 2B. In summary, the majority of Med1-regulated genes were not GATA-1 regulated and were not direct GATA-1 target genes. As such, Med1 function in this system is predominantly GATA-1 independent.
Mechanisms underlying Med1 function in erythroid cells.
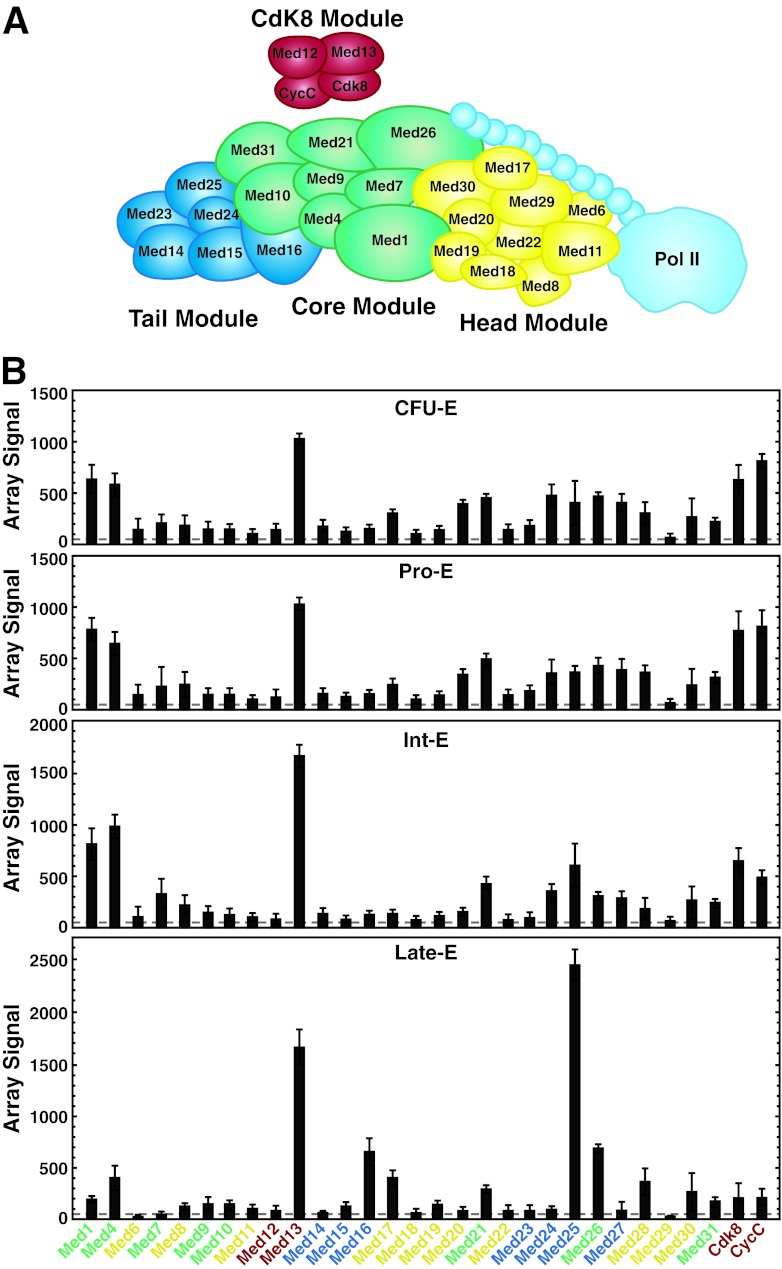
Since Med1 is a key component of the broadly expressed Mediator complex (Fig. 3A) (27), in principle, it may function as a Mediator subunit in erythroid cells to regulate the genes identified in Fig. 1. However, because Med1 interacts with various trans-acting factors (25, 31, 32, 34), its activity in erythroid cells may not rely exclusively on Mediator. Since Mediator composition has not been described in erythroid cells, we asked whether all Mediator components are expressed and whether expression is regulated during primary human erythroid cell maturation. Mining of the Human Erythroblast Maturation (HEM) Database, a catalog of gene expression at multiple stages of normal human erythropoiesis ex vivo, revealed that Med25 is the most highly upregulated Mediator component during human erythroid maturation (59) (Fig. 3B). Med1 mRNA is downregulated 3-fold during late-stage human erythroid maturation, but it remains expressed at measurable levels. Mining the Erythron database revealed that Med1 mRNA is upregulated during late-stage murine erythropoiesis (60). Consistent with the human data set, Med25 is also upregulated in late-stage murine erythroid maturation, while Med6 and Med20 expression declines in both systems (60). Both Med1 and Med25 are highly expressed in uninduced and induced G1E-ER-GATA-1 cells (Fig. 4B and C), which recapitulate a window of the normal maturation program (42).
Fig 3.
Med25 is highly expressed in erythroid cells and is upregulated upon human erythroid maturation. (A) Mediator complex subunits (26, 27). (B) Levels of expression of Mediator subunits during erythropoiesis ex vivo. Data were mined from the Human Erythroblast Maturation Database (59) and are expressed as mean array signal intensities ± standard errors for 3 arrays per maturation state (CFU-E, erythroid CFU; Pro-E, proerythroblasts; Int-E, intermediate erythroblasts; Late-E, late erythroblasts).
Fig 4.
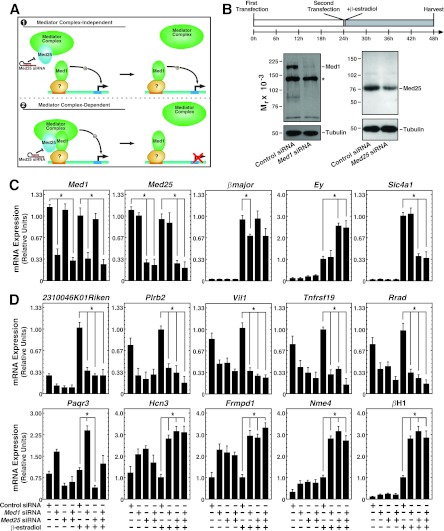
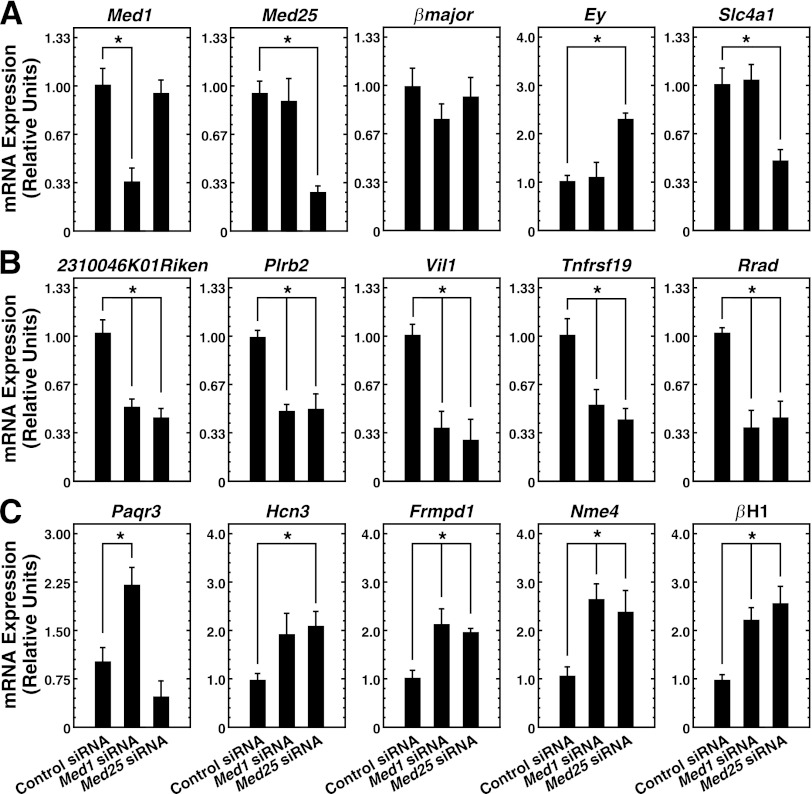
Similar Med1 and Med25 requirements for transcriptional regulation in erythroid cells. (A) Potential mechanisms of Med1 function. Model 1 depicts Med1 acting independently of Mediator, while model 2 depicts Med1 bound to and utilizing Mediator (including Med25) to regulate genes. (B) (Top) Knockdown strategy. Cells were electroporated twice, allowing 24 h between electroporations, and were treated with β-estradiol (shaded rectangle) for 24 h. (Bottom) Knockdown of Med1 and Med25 proteins by siRNA transfection as measured by semiquantitative Western blotting. The asterisk indicates a nonspecific band. (C) siRNA-mediated knockdown of Med1 and Med25 mRNA and influence on GATA-1 target genes, as quantitated by qRT-PCR in G1E-ER-GATA-1 cells treated with 240 pmol control, Med1, Med25, or Med1 and Med25 siRNAs for 48 h with or without 1 μM β-estradiol for 24 h. Data are means ± standard errors for four independent experiments. *, P < 0.05. (D) Med1-regulated genes. qRT-PCR was used to quantify mRNA in G1E-ER-GATA-1 cells treated with 240 pmol control, Med1, Med25, or Med1 and Med25 siRNAs for 48 h with or without the presence of 1 μM β-estradiol for 24 h. Results are means ± standard errors for four independent experiments.
Recent evidence suggests that Mediator can exist as cell-type-specific subcomplexes (61). The induction of Med25 during human erythropoiesis suggests that it may have uniquely important functions in erythroid cells. If Med1 functions in Mediator to regulate the genes shown in Fig. 1, additional subunits of the complex should share this activity (Fig. 4A). We knocked down Med25 mRNA and protein very efficiently in G1E-ER-GATA-1 cells, to levels comparable to those achieved for Med1 (Fig. 4B and C). Med25 knockdown significantly affected the expression of all 10 of the highest-responding Med1 target genes (Fig. 4D). For 9 out of 10 genes, Med25 knockdown yielded a consequence qualitatively identical to that of Med1 knockdown. The outlier, Paqr3, was affected oppositely by the Med1 and Med25 knockdowns. These results suggest that Med1 and Med25 function collectively to regulate a restricted gene cohort in erythroid cells, and this dual requirement implies the involvement of Mediator. Although this result suggests that Med1 and Med25 function as Mediator complex components to regulate Med1 target genes, one cannot rule out the possibility that Med1 and Med25 have additional functions, since Med1 and Med25 differentially regulate several GATA-1 target genes (Fig. 4C). The previously described ∼20% reduction in βmajor expression resulting from Med1 knockdown was not detected upon Med25 knockdown. The fetal/embryonic globin gene Hbb-y was significantly upregulated (∼2-fold) by Med25 knockdown but not by Med1 knockdown. Similarly, Slc4a1 expression was reduced only by Med25 knockdown (Fig. 4C). Since the efficiency of Med1 knockdown was high, it seems unlikely that a small amount of residual Med1 suffices in certain contexts, although this cannot be formally ruled out.
To further assess how Med1 and Med25 regulate genes in erythroid cells, we knocked down Med1 and Med25 simultaneously (Fig. 4C and D). To control for any potential nonspecific effects due to transfection with an increased amount of siRNA (240 pmol of Med1 siRNA plus 240 pmol of Med25 siRNA), we also conducted individual Med1 and Med25 knockdowns with an additional 240 pmol of control siRNA. Transfection with 240 pmol of Med1 plus 240 pmol of control siRNA, or with 240 pmol of Med25 plus 240 pmol of control siRNA, produced results quantitatively and qualitatively identical to those obtained with 240 pmol of specific siRNA alone (data not shown).
Med1 and Med25 mRNA levels were significantly reduced from those in control cells, and the double knockdown was similarly efficient (Fig. 4C). In cells transfected with both Med1 and Med25 siRNAs, 9 out of 10 Med1-regulated genes exhibited behavior indistinguishable from that with the individual Med1 or Med25 knockdown (Fig. 4D). The exception was Paqr3, which exhibited opposite changes in expression with the individual Med1 and Med25 knockdowns and was not significantly affected by the simultaneous knockdown. Thus, Med1 and Med25 exert qualitatively identical functions with the majority of Med1-regulated genes analyzed.
To determine whether the Med1 and Med25 requirements for transcriptional control are unique to G1E-ER-GATA-1 cells, we evaluated their functions in a distinct erythroid cell model, MEL cells (Fig. 5). Med1 and Med25 siRNAs specifically knocked down their respective targets in MEL cells (Fig. 5A). Quantitation of Med1 and Med25 target gene expression yielded results similar to those in G1E-ER-GATA-1 cells, although the magnitude of certain changes was reduced (Fig. 5A, B, and C). In conjunction with the G1E-ER-GATA-1 cell data, these results strongly suggest that Med1 and Med25 function as Mediator components to control the majority of Med1-regulated genes that we have evaluated in two erythroid cell systems.
Fig 5.
The functions of Med1 and Med25 in mouse erythroleukemia cells recapitulate their functions in G1E-ER-GATA-1 cells. (A) Knockdown of Med1 and Med25 in MEL cells. qRT-PCR was used to quantify Med1, Med25, and select GATA-1 target mRNAs in MEL cells transfected with 240 pmol control siRNA, Med1 siRNA, or Med25 siRNA for 48 h. Results are means ± standard errors for four independent experiments. *, P < 0.05. (B) Influence of Med1 or Med25 knockdown on Med1-activated genes. qRT-PCR was used to quantify mRNAs in MEL cells transfected with 240 pmol control, Med1, or Med25 siRNA for 48 h. Results are means ± standard errors for four independent experiments. (C) Influence of Med1 or Med25 knockdown on Med1-repressed genes. qRT-PCR was used to quantify mRNAs in MEL cells transfected with 240 pmol control, Med1, or Med25 siRNA for 48 h with or without 1 μM β-estradiol for 24 h. Results are means ± standard errors for four independent experiments.
Transcriptional profiling studies revealed that Mediator subunit expression can differ considerably for different cell types and upon cell differentiation (59, 61). We considered potential mechanisms of Med1 function in erythroid and nonerythroid cells. Med1 recruitment by ubiquitous factors might underlie Med-1-dependent transcriptional control of select genes in diverse cell types (model 1). Knockdown of Med1 would therefore dysregulate these common Med1 target genes in distinct cell types. Alternatively, erythroid cell-specific factors might be required for Med1 recruitment and/or function, and therefore, Med1 knockdown would dysregulate these Med1 targets only in erythroid cells (model 2). Of course, Med1 might regulate a subset of target genes in a cell-type-specific manner and might regulate additional genes in a pancellular, or “general,” manner.
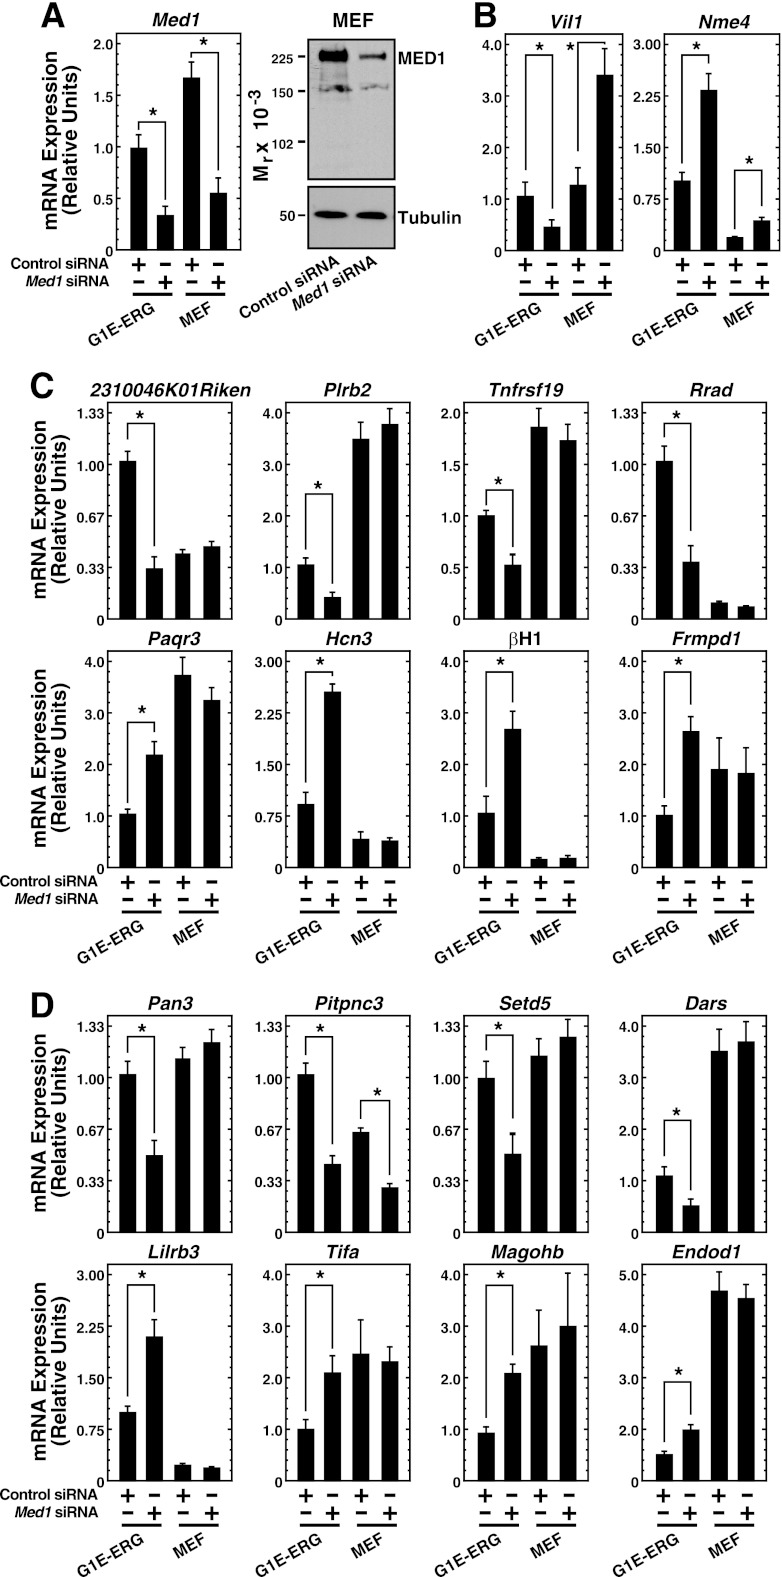
To determine whether the novel Med1-regulated genes described here are regulated by Med1 in diverse contexts, we conducted siRNA-based loss-of-function analyses in primary MEFs. Med1 siRNA substantially reduced Med1 mRNA and protein levels in MEFs (Fig. 6A). However, Med1 knockdown did not alter the expression of the majority of Med1-regulated genes identified in G1E-ER-GATA-1 cells (Fig. 6B and C). Of the top 10 Med1-regulated genes, only 2 genes, Vil1 and Nme4, were affected significantly by the knockdown in MEFs (Fig. 6B); the remaining 8 of the top 10 Med1-regulated genes measured were unaffected (Fig. 6C). To determine if the erythroid specificity observed for the majority of validated Med1-regulated genes reflected vast differences in the expression levels of the genes in the two cell types, we analyzed gene expression simultaneously in MEFs and G1E-ER-GATA-1 cells using identical standard curves. No correlation was observed between expression levels and regulation in the two cell types. Since the top 10 Med1-regulated genes measured in the erythroid cells could potentially overrepresent erythroid cell-specific genes, the expression of 8 additional genes from the middle of the Med1 target gene list was quantitated (Fig. 6D). Of these, all were significantly regulated in G1E-ER-GATA-1 cells, while only 1 gene, Pitpnc3, was regulated in MEFs, findings comparable to our results for the top 10 Med1-regulated genes. This result is also consistent with the data in Fig. 2D, since GATA-1-regulated genes are evenly distributed throughout the ensemble of Med1-regulated genes. Thus, most Med1-regulated genes discovered by our erythroid transcriptional profiling exhibit cell-type-specific regulation. The distinct Med1 functions in G1E-ER-GATA-1 cells and MEFs suggest that Med1 regulates cell-type-specific (e.g., 2310046K01Rik, βH1, and Rrad) and “general” (e.g., Nme4, Vil1, and Pitpnc3) target genes, in agreement with models 1 and 2.
Fig 6.
Evidence for cell-type-specific Med1 functions. (A) siRNA-mediated knockdown of Med1 mRNA (left) and protein (right), quantitated by qRT-PCR and semiquantitative Western blotting, respectively, in samples from MEFs and G1E-ER-GATA-1 cells transfected with 240 pmol of control or Med1 siRNA. Results are means ± standard errors for four independent experiments. *, P < 0.05. (B and C) The top 10 Med1-regulated genes in erythroid cells were analyzed in MEFs and G1E-ER-GATA-1 cells. qRT-PCR was used to quantify mRNA from G1E-ER-GATA-1 cells transfected with 240 pmol control or Med1 siRNA for 48 h, in the presence of 1 μM β-estradiol for 24 h, and from MEFs transfected with 240 pmol control or Med1 siRNA for 48 h. qRT-PCR was performed by running both sets of samples on the same (G1E-ER-GATA-1) standard curve, allowing for comparison of mRNA levels between cell types. Results are means ± standard errors for four independent experiments. (D) Expression of genes from the middle of the Med1 target gene list upon Med1 knockdown in MEF and G1E-ER-GATA-1 cells.
The Med1 target gene Rrad regulates erythroid cell survival and gene expression.
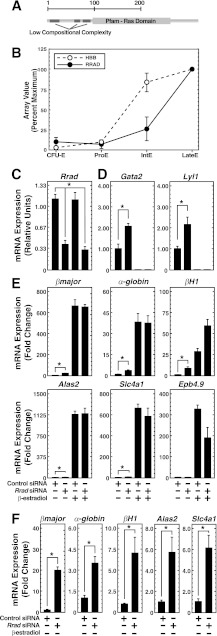
Although Med1 controls erythropoiesis in vivo (25, 34, 37), the Med1 target gene ensemble lacks prototypical erythroid genes (Fig. 1A). Members of the ensemble therefore represent candidate regulators of erythropoiesis and/or erythroid cell function. Among the top 10 genes affected by Med1 knockdown, only 1 is a known hematopoietic gene: Hbb-bh1, which encodes an embryonic/fetal β-globin subunit (62). Mining of a database of genes differentially expressed during normal human erythropoiesis (59) revealed that 5 of the 9 additional Med1-regulated genes—Paqr3, Nme4, Pilrb2, Tnfrsf19, and Rrad—are differentially regulated during erythroid maturation. siRNAs were used to knock down these factors in order to assess their potential contributions to G1E-ER-GATA-1 cell functions, specifically erythroid gene expression. This analysis implicated Rrad (Ras-related associated with diabetes) in regulating the expression of several GATA-1 target genes. Rrad is a small Ras-related GTPase in the RGK family, implicated in diverse processes, including cardiac hypertrophy, arrhythmia, insulin signaling in skeletal muscle, and tumorigenicity (44, 46, 47, 63, 64). Rrad has a Ras family domain and several regions of low compositional complexity (Fig. 7A) (25). In contrast to other small G proteins, Rrad is poorly studied, and its function in hematopoietic cells has not been described. Mining of genomic data (59) revealed that RRAD mRNA was upregulated 10-fold during late-stage human erythropoiesis, analogously to β-globin (Fig. 7B).
Fig 7.
Rrad regulates select GATA-1 target genes in erythroid cells. (A) Predicted Rrad protein domain structure. (B) Levels of RRAD and β-globin expression during human ex vivo erythropoiesis. Data were mined from the Human Erythroblast Maturation Database (59) and are expressed as array signal intensities ± standard errors for 3 arrays per maturation state. (C) siRNA-mediated knockdown of Rrad mRNA, as measured by qRT-PCR quantification of mRNA in G1E-ER-GATA-1 cells transfected with 240 pmol control or Rrad siRNA for 48 h with or without 1 μM β-estradiol for 24 h. Results are means ± standard errors for four independent experiments. *, P < 0.05. (D) Influence of Rrad knockdown on GATA-1-repressed genes. qRT-PCR was used to quantify mRNA in G1E-ER-GATA-1 cells transfected with 240 pmol control or Rrad siRNA for 48 h with or without 1 μM β-estradiol for 24 h. Results are means ± standard errors for four independent experiments. (E) Influence of Rrad knockdown on GATA-1-activated genes, as measured by qRT-PCR quantification of mRNA in G1E-ER-GATA-1 cells transfected with 240 pmol control or Rrad siRNA for 48 h with or without 1 μM β-estradiol for 24 h. Results are means ± standard errors for four independent experiments. (F) Influence of Rrad knockdown on GATA-1-activated genes from panel E (on a different scale to illustrate changes in basal activity) prior to the addition of β-estradiol.
Small GTPases regulate erythroid cell development and function (65–67), and by analogy, Rrad-dependent signaling pathways might regulate fundamental erythroid cell processes. To assess whether Rrad is important for the establishment and/or maintenance of the erythroid cell genetic network, we knocked down Rrad in G1E-ER-GATA-1 cells and quantitated the expression of representative GATA-1 target genes. A 75% reduction in Rrad mRNA levels (Fig. 7C) was associated with significantly altered expression of several GATA-1-regulated genes (Fig. 7D, E, and F). Rrad knockdown upregulated the GATA-1-repressed genes Gata2 and Lyl1 2-fold in uninduced G1E-ER-GATA-1 cells. However, these genes were repressed to normal levels upon β-estradiol-mediated ER-GATA-1 activation (Fig. 7D). In addition, Rrad knockdown upregulated the GATA-1-activated genes βmajor, α-globin, βH1, Alas2, Slc4a1, and Epb4.9 in uninduced cells. As with the GATA-1-repressed genes, this Rrad activity was not observed upon ER-GATA-1 activation; the genes were activated to normal levels (Fig. 7E). A higher-resolution view of the expression data of GATA-1-activated genes in uninduced cells is shown in Fig. 7F.
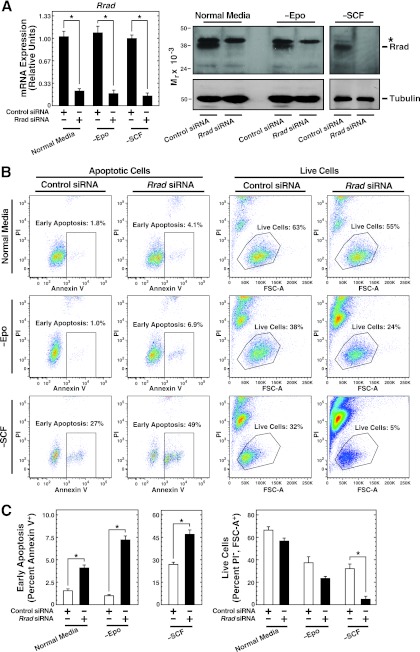
To probe the mechanism of Rrad function, we tested whether lowering Rrad levels in G1E-ER-GATA-1 cells influences cell viability and apoptosis (Fig. 8). Under conditions of Rrad mRNA and protein knockdown by 75 to 90% (Fig. 8A), the rate of early apoptosis increased significantly (2.5-fold; P, <0.05), as measured by flow cytometry of annexin V-positive, PI-negative cells (Fig. 8B and C). The percentage of live cells, quantitated by the forward scatter area (FSC-A) and lack of PI staining, decreased from 66% ± 2.0% to 57% ± 1.7% (Fig. 8B and C). Because Epo and stem cell factor (SCF) are important determinants of G1E-ER-GATA-1 cell survival and proliferation (41), reflecting their essential functions in erythroid cell biology (68), we eliminated either Epo or a conditioned medium containing SCF from a Kit ligand-secreting Chinese hamster ovary (CHO) cell line from the medium and then knocked down Rrad. Knocking down Rrad in a medium lacking Epo significantly increased the rate of early apoptosis 7.2-fold (from 1.0% ± 0.1% to 7.2% ± 0.5% [P < 0.05]). Epo starvation reduced the percentage of live cells, which declined further upon Rrad knockdown (from 37% ± 3.5% [with control siRNA] to 23% ± 1.2% [with Rrad siRNA]) (Fig. 8B and C). The influence of Rrad knockdown on apoptosis was more severe when cells were cultured in a medium lacking SCF. Under conditions of SCF starvation, the rate of apoptosis increased significantly, from 28% ± 2.4% to 46% ± 2.8% (P < 0.05), and the percentage of live cells decreased significantly (>6-fold; from 32% ± 3.2% to 4.8% ± 1.5% [P < 0.05]), from those for controls (Fig. 8B and C). These results indicated that Rrad confers G1E-ER-GATA-1 cell survival, and the prosurvival activity is particularly important when essential growth factors are limiting. To assess the specificity of this phenotype, the four siRNAs constituting the Rrad siRNA pool were analyzed individually. Three had qualitatively and quantitatively identical effects on apoptosis (the percentages of apoptosis were 1.9% ± 0.2% with control siRNA, 4.8% ± 0.4% with Rrad siRNA 1, 2.7% ± 1.0% with Rrad siRNA 2, 5.4% ± 0.5% with Rrad siRNA 3, and 7.2% ± 0.6% with Rrad siRNA 4 [P, <0.05 for Rrad siRNAs 1, 3, and 4]). siRNA 2 failed to reduce Rrad expression efficiently (30% reduction for siRNA 2 versus >75% reductions for siRNAs 1, 3, and 4).
Fig 8.
Evidence for Rrad prosurvival activity. (A) siRNA-mediated knockdown of Rrad mRNA and protein, as measured by qRT-PCR and semiquantitative Western blotting, respectively, in G1E-ER-GATA-1 cells transfected with 240 pmol control or Rrad siRNA for 48 h and cultured either in a normal medium or in a medium lacking either Epo (−Epo) or SCF-containing conditioned medium (−SCF). Results are means ± standard errors for three independent experiments. *, P < 0.05. (B) Representative flow cytometric plots. Shown are the results of flow cytometry analysis of annexin V and propidium iodide (PI) staining in G1E-ER-GATA-1 cells transfected with 240 pmol control or Rrad siRNA for 48 h and cultured in either a normal medium or a medium lacking either Epo or SCF-containing conditioned medium. FSC-A, forward scatter area. (C) Quantitation of the influence of Rrad knockdown on apoptosis and cell viability. Results are means ± standard errors for three independent experiments.
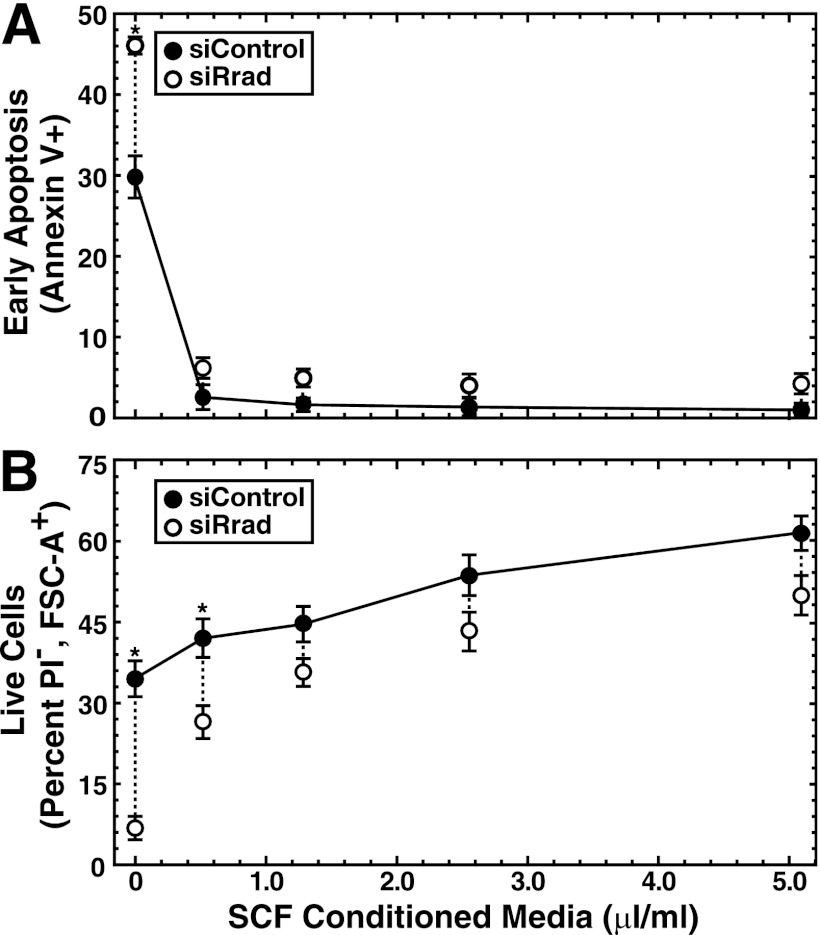
Because cells cultured without exogenous SCF were most susceptible to Rrad knockdown, we evaluated the influence of varying the SCF concentration on cell survival under normal and Rrad-reduced conditions. Knocking down Rrad over a range of SCF concentrations (Fig. 9A and B) revealed that relatively small amounts of SCF attenuated the deleterious impact of Rrad knockdown on apoptosis and cell death (Fig. 9A and B, respectively). Since SCF was provided as a conditioned medium, we tested whether purified SCF can substitute for the conditioned medium in conferring G1E-ER-GATA-1 cell survival. Purified SCF prevented cell death resulting from the removal of the conditioned medium. The percentage of live cells increased significantly, from 34% ± 3.8% (without the conditioned medium) to 55% ± 5.7% (with purified SCF) (P < 0.05), and the percentage of early apoptotic cells decreased significantly, from 31% ± 3.9% (without the conditioned medium) to 1.7% ± 0.4% (with purified SCF) (P < 0.01). In aggregate, these results indicate that endogenous Rrad confers G1E-ER-GATA-1 cell survival when critical survival factors are limiting.
Fig 9.
SCF concentration dependence of prevention of apoptosis and cell death resulting from reduced Rrad levels. Shown are graphs of values derived from flow cytometry analysis of apoptotic (A) or live (B) cells after siRNA-mediated knockdown of Rrad in G1E-ER-GATA-1 cells transfected with 240 pmol control or Rrad siRNA for 48 h and cultured in media containing varying concentrations of SCF-containing conditioned medium. Results are means ± standard errors for three independent experiments. *, P < 0.05.
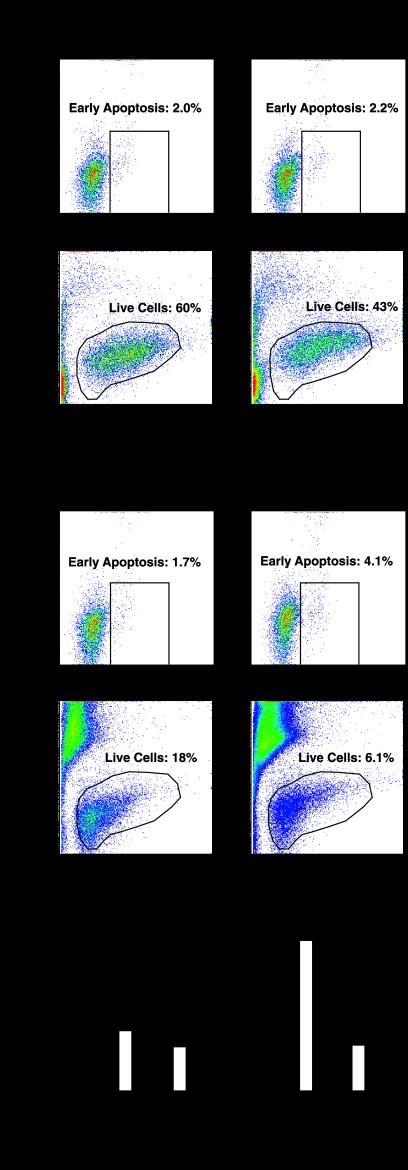
To test whether Rrad confers survival in other systems, we analyzed FOG-1-null cells, which are hematopoietic precursor cells lacking competence to differentiate due to a deficiency of the key GATA-1 coregulator FOG-1 (Fig. 10). These cells arrest prior to the commitment to the erythroblast or megakaryocyte lineage and at an earlier stage than G1E-ER-GATA-1 cells (38, 49). FOG-1-null cells require IL-3 for survival and proliferation (51). While knockdown of Rrad in FOG-1-null cells growing in a normal medium (81% decrease in the level of Rrad mRNA [P < 0.05]) did not significantly influence apoptosis or survival (Fig. 10A and C), Rrad knockdown in a medium lacking IL-3 (82% decrease in the level of Rrad mRNA [P < 0.05]) increased apoptosis 2.6-fold (P < 0.05). The knockdown also increased the rate of cell death, with the percentage of live cells declining significantly from 18% ± 1.9% to 6.1% ± 1.4% (P < 0.05) (Fig. 10B and C). Thus, Rrad confers survival under growth factor-limited conditions in two distinct hematopoietic cell systems.
Fig 10.
Rrad suppresses the apoptosis of FOG-1-null hematopoietic precursor cells cultured without IL-3. (A and B) Representative flow cytometry plots of annexin V and propidium iodide (PI) staining in FOG-1-null cells transfected with 240 pmol control or Rrad siRNA for 48 h and cultured in a normal medium (A) or in a medium lacking exogenous IL-3 (B). (C) Quantitation of the influence of Rrad knockdown on apoptosis and cell viability. Results are means ± standard errors for three independent experiments. *, P < 0.05.
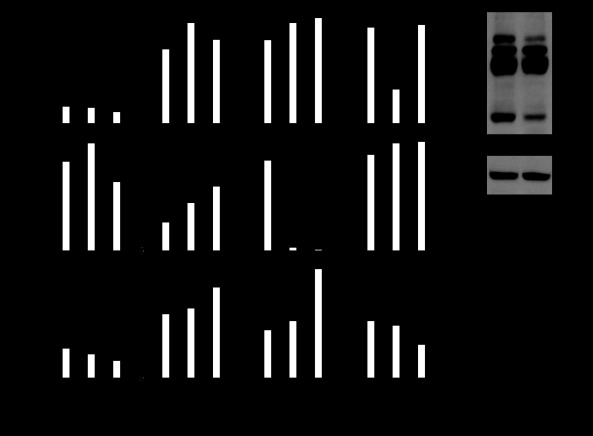
To investigate the mechanisms underlying the Rrad prosurvival activity, we interrogated a panel of genes encoding established regulators of apoptosis (69) (Fig. 11). Rrad knockdown altered the mRNA expression of three genes: Casp3, Cideb, and Nfkb1 (Fig. 11A). We prioritized the analysis of these genes on the basis of two criteria. Since the greatest effects on apoptosis and cell survival occurred in cells grown without SCF-containing conditioned medium, genes with altered expression under this condition were prioritized for further study. In addition, since the rate of apoptosis increased significantly under all medium conditions tested, genes with altered expression under all conditions were also prioritized. Of the three genes differentially expressed upon Rrad knockdown, Nfkb1 was the sole gene to meet these criteria (Fig. 11A). Nfkb1 encodes the p105 subunit of NF-κB, which is processed by the 26S proteasome to yield the NF-κB p50 subunit (70). To determine if the reduction in Nfkb1 mRNA expression is accompanied by a reduction in Nfkb1 protein expression, semiquantitative Western blotting was conducted; it demonstrated reduced levels of the p105 and p50 proteins upon Rrad knockdown (Fig. 11B). Because NF-κB regulates cell survival and apoptosis (71), we knocked down Nfkb1 in cells growing in a normal medium or in a medium lacking Epo or SCF. Although Nfkb1 mRNA and protein levels were strongly reduced (data not shown), apoptosis was unaffected (the rates of apoptosis were 3.1% ± 0.8% with control siRNA and 3.4% ± 1.1% with Nfkb1 siRNA in the normal medium, 3.8% ± 1.3% with control siRNA and 3.7% ± 1.6% with Nfkb1 siRNA in the Epo-depleted medium, and 32% ± 6.9% with control siRNA and 36% ± 7.2% with Nfkb1 siRNA in the SCF-depleted medium). Cell viability was also unaffected (the percentages of live cells were 74% ± 8.4% with control siRNA and 73% ± 9.3% with Nfkb1 siRNA in the normal medium, 62% ± 7.7% with control siRNA and 61% ± 6.4% with Nfkb1 siRNA in the Epo-depleted medium, and 26% ± 4.6% with control siRNA and 26% ± 5.1% with Nfkb1 siRNA in the SCF-depleted medium). These results indicate that while Rrad-mediated regulation of Nfkb1 is insufficient for the observed prosurvival activity, further investigation is required to establish the functional importance of the intriguing Rrad requirement for p105 and p50 expression.
Fig 11.
Rrad controls select apoptosis-regulatory genes. (A) siRNA-mediated knockdown of Rrad mRNA, and qRT-PCR quantitation of the expression of genes encoding apoptosis regulators, in G1E-ER-GATA-1 cells transfected with 240 pmol control or Rrad siRNA for 48 h and cultured either in a normal medium or in a medium lacking either Epo or SCF-containing conditioned medium. Results are means ± standard errors for four independent experiments. *, P < 0.05. (B) Protein levels of both mature (p50) and unprocessed (p105) Nfkb1 are reduced by Rrad knockdown, as measured by semiquantitative Western blotting. Asterisks indicate nonspecific bands.
Since Epo and SCF strongly induced Cideb expression (Fig. 11A), it is attractive to consider a potential role for Cideb in the respective mechanisms. Cideb can promote caspase-independent apoptosis (72) and is an important regulator of lipid metabolism (73, 74). However, Rrad knockdown did not significantly affect Cideb expression in a normal medium or a medium lacking SCF. Casp3 is a GATA-1 target gene and is downregulated 2.8-fold by β-estradiol treatment based on the ER-GATA-1 microarray analysis. Since its levels are unchanged in cells grown without SCF-containing conditioned medium, reduced Casp3 expression is not required for the cell death caused by knocking down Rrad.
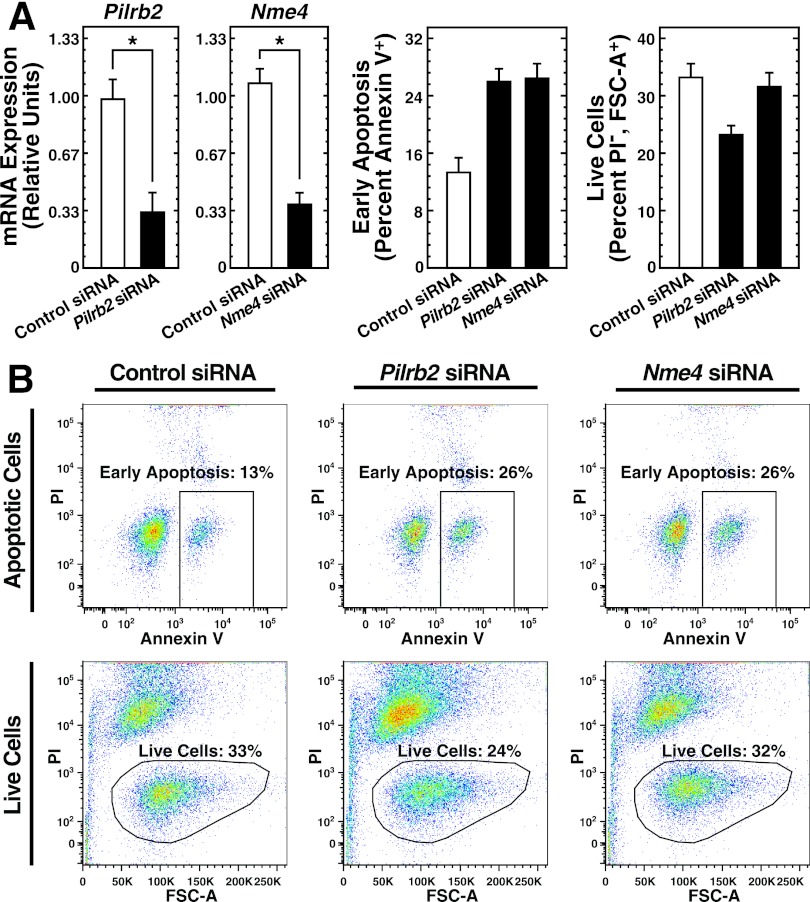
Since Rrad confers G1E-ER-GATA-1 cell survival, the Med1 target genes noted previously, which are differentially regulated during human erythroid maturation (Paqr3, Nme4, Pilrb2, Tnfrsf19), were analyzed by flow cytometry with annexin V and PI to assess whether they also regulate erythroid cell survival and apoptosis. In addition, we analyzed a novel Med1-regulated gene, 2310046K01Rik, which was activated to the greatest extent by Med1. This analysis revealed two genes that conferred survival. siRNA-mediated knockdown of Pilrb2 or Nme4 increased the rate of early apoptosis 2-fold in G1E-ER-GATA-1 cells cultured without SCF-containing conditioned medium (Fig. 12A and B) (n = 2). Pilrb2 knockdown decreased the total numbers of live cells by 30% (n = 2). These results indicate that multiple Med1 target genes control the survival of G1E-ER-GATA-1 cells.
Fig 12.
Additional Med1 target genes confer G1E-ER-GATA-1 cell survival. (A) (Left two panels) siRNA-mediated knockdown of Pilrb2 and Nme4 mRNA quantitated by qRT-PCR in G1E-ER-GATA-1 cells transfected with 240 pmol control, Pilrb2, or Nme4 siRNA for 48 h and cultured in a medium lacking SCF-containing conditioned medium. Results are means ± standard errors for three independent experiments. *, P < 0.05. (Right two panels) Quantitation of the influence of Pilrb2 or Nme4 knockdown on apoptosis and cell viability. (B) Representative flow cytometry plots from two biological replicates of annexin V and propidium iodide (PI) staining in G1E-ER-GATA-1 cells transfected with 240 pmol control, Pilrb2, or Nme4 siRNA for 48 h and cultured in a medium lacking SCF-conditioned medium.
Insights into erythroid cell biology derived from the mining of Med1 genomic data sets.
Despite the established role of the broadly expressed Mediator component Med1 as a pivotal regulator of important biological processes (26, 27, 31, 32), many questions remain regarding the underlying molecular and cellular mechanisms. Here we describe an erythroid cell genetic network in which Med1 regulates a restricted cohort of GATA-1-independent genes and considerably fewer GATA-1-dependent genes. These genes are also regulated by the Mediator component Med25. This regulation occurs in two distinct systems and is apparent when Med1 or Med25 is knocked down alone or when they are knocked down concomitantly. Clearly, Med1 and Med25 exert specialized functions in erythroid cells and are not required to establish/maintain major components of the erythroid cell genetic network.
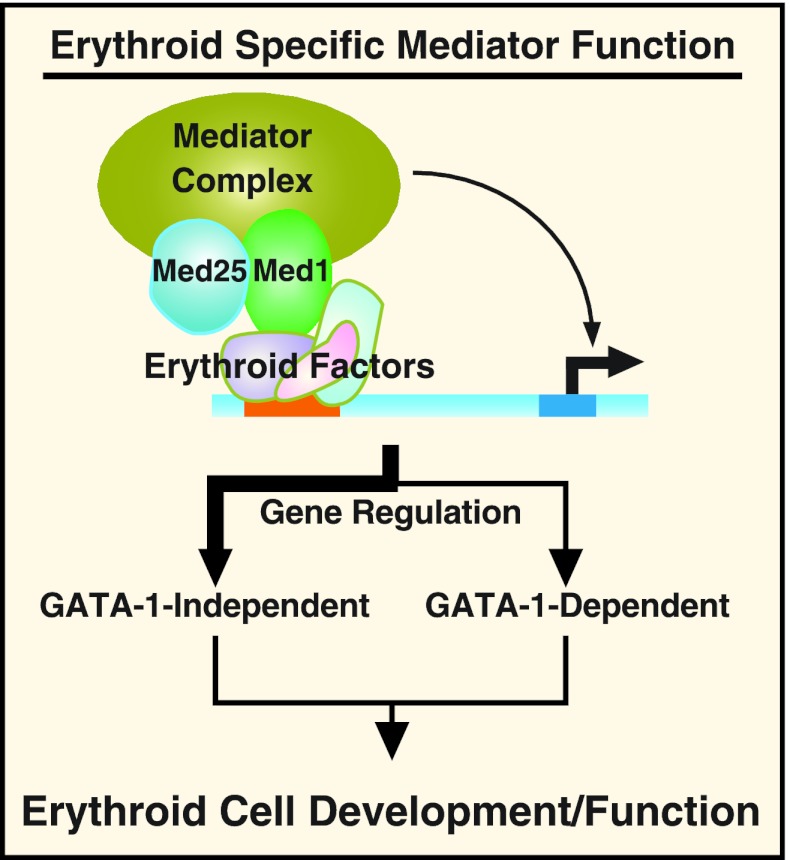
The Med1 target genes include multiple new candidate regulators of erythroid cell maturation and function (Fig. 13). In agreement with the notion that GATA-1-independent Med1 target genes can have important erythroid cell functions, the Med1 target gene Rrad conferred survival and regulated genes important for hematopoiesis, apoptosis, and survival. These results constitute a proof of the principle that GATA-1-independent Med1 targets can serve important regulatory functions in erythroid cells. The mechanisms controlling erythroid cell survival are complex, involving a multitude of regulatory factors (68, 75), and our studies implicate a new factor, Rrad, in this crucial process. Rrad was not essential for Epo- and SCF-induced cell survival, based on the fact that a major reduction in Rrad levels in the presence of these factors did not catastrophically impair cell viability and apoptosis. However, in the absence of exogenous Epo or SCF, a condition deleterious to cell viability, the prosurvival activity of Rrad was particularly important. It is attractive to propose that Rrad exerts a protective function under conditions of cellular stress in which Epo and/or SCF are limiting or when their signaling pathways are impaired in pathological states.
Fig 13.
Erythroid cell-specific Mediator function. The model depicts Mediator recruitment by erythroid factors to a DNA regulatory element (red bar) in an erythroid cell. This complex then acts to regulate gene transcription. Since the majority of Med1-regulated genes were not GATA-1 regulated, the thick line indicates the predominant pathway. However, GATA-1 can recruit Med1 (39), and these factors coregulate a small gene cohort. We propose that GATA-1-independent and -dependent Med1 targets mediate important aspects of erythroid cell development/function.
A majority of the top Med1 target genes in erythroid cells, including Rrad, were not regulated by Med1 in MEFs, demonstrating that Med1 regulates its target gene ensemble in a cell-type-specific manner. Distinct Mediator species may exist in different cell types, and certain Mediator components may not be expressed in all cell types (59, 61). Given the strong evidence supporting an essential Med1 function in the regulation of erythropoiesis (25, 37), and given the 25 additional Mediator subunits, to many of which no biochemical functions have been ascribed (26, 27, 32), further elucidation of cell-type-specific Mediator mechanisms and the function of GATA-1-independent Mediator targets will almost certainly yield important biological and mechanistic insights.
ACKNOWLEDGMENTS
This work was supported by National Institutes of Health grant DK50107 (to E.H.B.). N.J.P. was supported by an NIH Hematology Predoctoral Fellowship and an American Heart Association Predoctoral Fellowship.
We thank C. Ronald Kahn for providing the anti-Rrad antibody and members of the Bresnick laboratory for critical comments.
Footnotes
Published ahead of print 4 March 2013
REFERENCES
- 1. Tsai FY, Keller G, Kuo FC, Weiss M, Chen J, Rosenblatt M, Alt FW, Orkin SH. 1994. An early haematopoietic defect in mice lacking the transcription factor GATA-2. Nature 371:221–226 [DOI] [PubMed] [Google Scholar]
- 2. Simon MC, Pevny L, Wiles MV, Keller G, Costantini F, Orkin SH. 1992. Rescue of erythroid development in gene targeted GATA-1− mouse embryonic stem cells. Nat. Genet. 1:92–98 [DOI] [PubMed] [Google Scholar]
- 3. Pevny L, Simon MC, Robertson E, Klein WH, Tsai SF, D'Agati V, Orkin SH, Costantini F. 1991. Erythroid differentiation in chimaeric mice blocked by a targeted mutation in the gene for transcription factor GATA-1. Nature 349:257–260 [DOI] [PubMed] [Google Scholar]
- 4. Joulin V, Bories D, Eleouet JF, Labastie MC, Chretien S, Mattei MG, Romeo PH. 1991. A T-cell specific TCR δ DNA binding protein is a member of the human GATA family. EMBO J. 10:1809–1816 [DOI] [PMC free article] [PubMed] [Google Scholar]
- 5. Pandolfi PP, Roth ME, Karis A, Leonard MW, Dzierzak E, Grosveld FG, Engel JD, Lindenbaum MH. 1995. Targeted disruption of the GATA3 gene causes severe abnormalities in the nervous system and in fetal liver haematopoiesis. Nat. Genet. 11:40–44 [DOI] [PubMed] [Google Scholar]
- 6. Evans T, Felsenfeld G. 1989. The erythroid-specific transcription factor Eryf1: a new finger protein. Cell 58:877–885 [DOI] [PubMed] [Google Scholar]
- 7. Tsai SF, Martin DI, Zon LI, D'Andrea AD, Wong GG, Orkin SH. 1989. Cloning of cDNA for the major DNA-binding protein of the erythroid lineage through expression in mammalian cells. Nature 339:446–451 [DOI] [PubMed] [Google Scholar]
- 8. Molkentin JD, Lin Q, Duncan SA, Olson EN. 1997. Requirement of the transcription factor GATA4 for heart tube formation and ventral morphogenesis. Genes Dev. 11:1061–1072 [DOI] [PubMed] [Google Scholar]
- 9. Kuo CT, Morrisey EE, Anandappa R, Sigrist K, Lu MM, Parmacek MS, Soudais C, Leiden JM. 1997. GATA4 transcription factor is required for ventral morphogenesis and heart tube formation. Genes Dev. 11:1048–1060 [DOI] [PubMed] [Google Scholar]
- 10. Morrisey EE, Ip HS, Tang Z, Lu MM, Parmacek MS. 1997. GATA-5: a transcriptional activator expressed in a novel temporally and spatially-restricted pattern during embryonic development. Dev. Biol. 183:21–36 [DOI] [PubMed] [Google Scholar]
- 11. Morrisey EE, Tang Z, Sigrist K, Lu MM, Jiang F, Ip HS, Parmacek MS. 1998. GATA6 regulates HNF4 and is required for differentiation of visceral endoderm in the mouse embryo. Genes Dev. 12:3579–3590 [DOI] [PMC free article] [PubMed] [Google Scholar]
- 12. Weiss MJ, Orkin SH. 1995. GATA transcription factors: key regulators of hematopoiesis. Exp. Hematol. 23:99–107 [PubMed] [Google Scholar]
- 13. Kim SI, Bresnick EH. 2007. Transcriptional control of erythropoiesis: emerging mechanisms and principles. Oncogene 26:6777–6794 [DOI] [PubMed] [Google Scholar]
- 14. Fujiwara Y, Browne CP, Cunniff K, Goff SC, Orkin SH. 1996. Arrested development of embryonic red cell precursors in mouse embryos lacking transcription factor GATA-1. Proc. Natl. Acad. Sci. U. S. A. 93:12355–12358 [DOI] [PMC free article] [PubMed] [Google Scholar]
- 15. Crispino JD. 2005. GATA-1 in normal and malignant hematopoiesis. Semin. Cell Dev. Biol. 16:137–147 [DOI] [PubMed] [Google Scholar]
- 16. Bresnick EH, Katsumura KR, Lee HY, Johnson KD, Perkins AS. 2012. Master regulatory GATA transcription factors: mechanistic principles and emerging links to hematologic malignancies. Nucleic Acids Res. 40:5819–5831 [DOI] [PMC free article] [PubMed] [Google Scholar]
- 17. Martin DI, Orkin SH. 1990. Transcriptional activation and DNA binding by the erythroid factor GF-1/NF-E1/Eryf 1. Genes Dev. 4:1886–1898 [DOI] [PubMed] [Google Scholar]
- 18. Ko LJ, Engel JD. 1993. DNA-binding specificities of the GATA transcription factor family. Mol. Cell. Biol. 13:4011–4022 [DOI] [PMC free article] [PubMed] [Google Scholar]
- 19. Merika M, Orkin SH. 1993. DNA-binding specificity of GATA family transcription factors. Mol. Cell. Biol. 13:3999–4010 [DOI] [PMC free article] [PubMed] [Google Scholar]
- 20. Fujiwara T, O'Geen H, Keles S, Blahnik K, Linnemann AK, Kang YA, Choi K, Farnham PJ, Bresnick EH. 2009. Discovering hematopoietic mechanisms through genome-wide analysis of GATA factor chromatin occupancy. Mol. Cell 36:667–681 [DOI] [PMC free article] [PubMed] [Google Scholar]
- 21. Tsang AP, Visvader JE, Turner CA, Fujiwara Y, Yu C, Weiss MJ, Crossley M, Orkin SH. 1997. FOG, a multitype zinc finger protein, acts as a cofactor for transcription factor GATA-1 in erythroid and megakaryocytic differentiation. Cell 90:109–119 [DOI] [PubMed] [Google Scholar]
- 22. Tsang AP, Fujiwara Y, Hom DB, Orkin SH. 1998. Failure of megakaryopoiesis and arrested erythropoiesis in mice lacking the GATA-1 transcriptional cofactor FOG. Genes Dev. 12:1176–1188 [DOI] [PMC free article] [PubMed] [Google Scholar]
- 23. Crispino JD, Lodish MB, MacKay JP, Orkin SH. 1999. Use of altered specificity mutants to probe a specific protein-protein interaction in differentiation: the GATA-1:FOG complex. Mol. Cell 3:219–228 [DOI] [PubMed] [Google Scholar]
- 24. Blobel GA, Nakajima T, Eckner R, Montminy M, Orkin SH. 1998. CREB-binding protein cooperates with transcription factor GATA-1 and is required for erythroid differentiation. Proc. Natl. Acad. Sci. U. S. A. 95:2061–2066 [DOI] [PMC free article] [PubMed] [Google Scholar]
- 25. Stumpf M, Waskow C, Krotschel M, van Essen D, Rodriguez P, Zhang X, Guyot B, Roeder RG, Borggrefe T. 2006. The mediator complex functions as a coactivator for GATA-1 in erythropoiesis via subunit Med1/TRAP220. Proc. Natl. Acad. Sci. U. S. A. 103:18504–18509 [DOI] [PMC free article] [PubMed] [Google Scholar]
- 26. Kornberg RD. 2005. Mediator and the mechanism of transcriptional activation. Trends Biochem. Sci. 30:235–239 [DOI] [PubMed] [Google Scholar]
- 27. Conaway RC, Sato S, Tomomori-Sato C, Yao T, Conaway JW. 2005. The mammalian mediator complex and its role in transcriptional regulation. Trends Biochem. Sci. 30:250–255 [DOI] [PubMed] [Google Scholar]
- 28. Johnson KD, Boyer ME, Kang JA, Wickrema A, Cantor AB, Bresnick EH. 2007. Friend of GATA-1-independent transcriptional repression: a novel mode of GATA-1 function. Blood 109:5230–5233 [DOI] [PMC free article] [PubMed] [Google Scholar]
- 29. Lee HY, Johnson KD, Fujiwara T, Boyer ME, Kim SI, Bresnick EH. 2009. Controlling hematopoiesis through sumoylation-dependent regulation of a GATA factor. Mol. Cell 36:984–995 [DOI] [PMC free article] [PubMed] [Google Scholar]
- 30. Lee HY, Johnson KD, Boyer ME, Bresnick EH. 2011. Relocalizing genetic loci into specific subnuclear neighborhoods. J. Biol. Chem. 286:18834–18844 [DOI] [PMC free article] [PubMed] [Google Scholar]
- 31. Chen W, Roeder RG. 2011. Mediator-dependent nuclear receptor function. Semin. Cell Dev. Biol. 22:749–758 [DOI] [PMC free article] [PubMed] [Google Scholar]
- 32. Belakavadi M, Fondell JD. 2006. Role of the mediator complex in nuclear hormone receptor signaling. Rev. Physiol. Biochem. Pharmacol. 156:23–43 [DOI] [PubMed] [Google Scholar]
- 33. Zhu Y, Qi C, Jia Y, Nye JS, Rao MS, Reddy JK. 2000. Deletion of PBP/PPARBP, the gene for nuclear receptor coactivator peroxisome proliferator-activated receptor-binding protein, results in embryonic lethality. J. Biol. Chem. 275:14779–14782 [DOI] [PubMed] [Google Scholar]
- 34. Crawford SE, Qi C, Misra P, Stellmach V, Rao MS, Engel JD, Zhu Y, Reddy JK. 2002. Defects of the heart, eye, and megakaryocytes in peroxisome proliferator activator receptor-binding protein (PBP) null embryos implicate GATA family of transcription factors. J. Biol. Chem. 277:3585–3592 [DOI] [PubMed] [Google Scholar]
- 35. Landles C, Chalk S, Steel JH, Rosewell I, Spencer-Dene B, Lalani E-N, Parker MG. 2003. The thyroid hormone receptor-associated protein TRAP220 is required at distinct embryonic stages in placental, cardiac, and hepatic development. Mol. Endocrinol. 17:2418–2435 [DOI] [PubMed] [Google Scholar]
- 36. Ito M, Yuan CX, Okano HJ, Darnell RB, Roeder RG. 2000. Involvement of the TRAP220 component of the TRAP/SMCC coactivator complex in embryonic development and thyroid hormone action. Mol. Cell 5:683–693 [DOI] [PubMed] [Google Scholar]
- 37. Stumpf M, Yue X, Schmitz S, Luche H, Reddy JK, Borggrefe T. 2010. Specific erythroid-lineage defect in mice conditionally deficient for Mediator subunit Med1. Proc. Natl. Acad. Sci. U. S. A. 107:21541–21546 [DOI] [PMC free article] [PubMed] [Google Scholar]
- 38. Ting CN, Olson MC, Barton KP, Leiden JM. 1996. Transcription factor GATA-3 is required for development of the T-cell lineage. Nature 384:474–478 [DOI] [PubMed] [Google Scholar]
- 39. Pope NJ, Bresnick EH. 2010. Differential coregulator requirements for function of the hematopoietic transcription factor GATA-1 at endogenous loci. Nucleic Acids Res. 38:2190–2200 [DOI] [PMC free article] [PubMed] [Google Scholar]
- 40. Weiss MJ, Yu C, Orkin SH. 1997. Erythroid-cell-specific properties of transcription factor GATA-1 revealed by phenotypic rescue of a gene-targeted cell line. Mol. Cell. Biol. 17:1642–1651 [DOI] [PMC free article] [PubMed] [Google Scholar]
- 41. Gregory T, Yu C, Ma A, Orkin SH, Blobel GA, Weiss MJ. 1999. GATA-1 and erythropoietin cooperate to promote erythroid cell survival by regulating bcl-xL expression. Blood 94:87–96 [PubMed] [Google Scholar]
- 42. Welch JJ, Watts JA, Vakoc CR, Yao Y, Wang H, Hardison RC, Blobel GA, Chodosh LA, Weiss MJ. 2004. Global regulation of erythroid gene expression by transcription factor GATA-1. Blood 104:3136–3147 [DOI] [PubMed] [Google Scholar]
- 43. Zhu J, Reynet C, Caldwell JS, Kahn CR. 1995. Characterization of Rad, a new member of Ras/GTPase superfamily, and its regulation by a unique GTPase-activating protein (GAP)-like activity. J. Biol. Chem. 270:4805–4812 [DOI] [PubMed] [Google Scholar]
- 44. Chang L, Zhang J, Tseng YH, Xie CQ, Ilany J, Bruning JC, Sun Z, Zhu X, Cui T, Youker KA, Yang Q, Day SM, Kahn CR, Chen YE. 2007. Rad GTPase deficiency leads to cardiac hypertrophy. Circulation 116:2976–2983 [DOI] [PMC free article] [PubMed] [Google Scholar]
- 45. Zhang J, Chang L, Chen C, Zhang M, Luo Y, Hamblin M, Villacorta L, Xiong JW, Chen YE, Zhang J, Zhu X. 2011. Rad GTPase inhibits cardiac fibrosis through connective tissue growth factor. Cardiovasc. Res. 91:90–98 [DOI] [PMC free article] [PubMed] [Google Scholar]
- 46. Fu M, Zhang J, Tseng YH, Cui T, Zhu X, Xiao Y, Mou Y, De Leon H, Chang MM, Hamamori Y, Kahn CR, Chen YE. 2005. Rad GTPase attenuates vascular lesion formation by inhibition of vascular smooth muscle cell migration. Circulation 111:1071–1077 [DOI] [PubMed] [Google Scholar]
- 47. Ilany J, Bilan PJ, Kapur S, Caldwell JS, Patti ME, Marette A, Kahn CR. 2006. Overexpression of Rad in muscle worsens diet-induced insulin resistance and glucose intolerance and lowers plasma triglyceride level. Proc. Natl. Acad. Sci. U. S. A. 103:4481–4486 [DOI] [PMC free article] [PubMed] [Google Scholar]
- 48. Grass JA, Boyer ME, Pal S, Wu J, Weiss MJ, Bresnick EH. 2003. GATA-1-dependent transcriptional repression of GATA-2 via disruption of positive autoregulation and domain-wide chromatin remodeling. Proc. Natl. Acad. Sci. U. S. A. 100:8811–8816 [DOI] [PMC free article] [PubMed] [Google Scholar]
- 49. Nudel U, Salmon JE, Terada M, Bank A, Rifkind RA, Marks PA. 1977. Differential effects of chemical inducers on expression of beta globin genes in murine erythroleukemia cells. Proc. Natl. Acad. Sci. U. S. A. 74:1100–1104 [DOI] [PMC free article] [PubMed] [Google Scholar]
- 50. Forsberg EC, Downs KM, Christensen HM, Im H, Nuzzi PA, Bresnick EH. 2000. Developmentally dynamic histone acetylation pattern of a tissue-specific chromatin domain. Proc. Natl. Acad. Sci. U. S. A. 97:14494–14499 [DOI] [PMC free article] [PubMed] [Google Scholar]
- 51. Cantor AB, Katz SG, Orkin SH. 2002. Distinct domains of the GATA-1 cofactor FOG-1 differentially influence erythroid versus megakaryocytic maturation. Mol. Cell. Biol. 22:4268–4279 [DOI] [PMC free article] [PubMed] [Google Scholar]
- 52. Grass JA, Jing H, Kim SI, Martowicz ML, Pal S, Blobel GA, Bresnick EH. 2006. Distinct functions of dispersed GATA factor complexes at an endogenous gene locus. Mol. Cell. Biol. 26:7056–7067 [DOI] [PMC free article] [PubMed] [Google Scholar]
- 53. Johnson KD, Hsu AP, Ryu MJ, Wang J, Gao X, Boyer ME, Liu Y, Lee Y, Calvo KR, Keles S, Zhang J, Holland SM, Bresnick EH. 2012. Cis-element mutated in GATA2-dependent immunodeficiency governs hematopoiesis and vascular integrity. J. Clin. Invest. 122:3692–3704 [DOI] [PMC free article] [PubMed] [Google Scholar]
- 54. Vollrath AL, Smith AA, Craven M, Bradfield CA. 2009. EDGE3: a web-based solution for management and analysis of Agilent two color microarray experiments. BMC Bioinformatics 10:280 doi:10.1186/1471-2105-10-280 [DOI] [PMC free article] [PubMed] [Google Scholar]
- 55. Im H, Grass JA, Johnson KD, Boyer ME, Wu J, Bresnick EH. 2004. Measurement of protein-DNA interactions in vivo by chromatin immunoprecipitation. Methods Mol. Biol. 284:129–146 [DOI] [PubMed] [Google Scholar]
- 56. Huang DW, Sherman BT, Lempicki RA. 2009. Systematic and integrative analysis of large gene lists using DAVID bioinformatics resources. Nat. Protoc. 4:44–57 [DOI] [PubMed] [Google Scholar]
- 57. Cheng Y, Wu W, Kumar SA, Yu D, Deng W, Tripic T, King DC, Chen KB, Zhang Y, Drautz D, Giardine B, Schuster SC, Miller W, Chiaromonte F, Zhang Y, Blobel GA, Weiss MJ, Hardison RC. 2009. Erythroid GATA1 function revealed by genome-wide analysis of transcription factor occupancy, histone modifications, and mRNA expression. Genome Res. 19:2172–2184 [DOI] [PMC free article] [PubMed] [Google Scholar]
- 58. Kang YA, Sanalkumar R, O'Geen H, Linnemann AK, Chang CJ, Bouhassira EE, Farnham PJ, Keles S, Bresnick EH. 2012. Autophagy driven by a master regulator of hematopoiesis. Mol. Cell. Biol. 32:226–239 [DOI] [PMC free article] [PubMed] [Google Scholar]
- 59. Merryweather-Clarke AT, Atzberger A, Soneji S, Gray N, Clark K, Waugh C, McGowan SJ, Taylor S, Nandi AK, Wood WG, Roberts DJ, Higgs DR, Buckle VJ, Robson KJ. 2011. Global gene expression analysis of human erythroid progenitors. Blood 117:e96–e108 doi:10.1182/blood-2010-07-290825 [DOI] [PubMed] [Google Scholar]
- 60. Kingsley PD, Greenfest-Allen E, Frame JM, Bushnell TP, Malik J, McGrath KE, Stoeckert CJ, Jr, Palis J. 2013. Ontogeny of erythroid gene expression. Blood 121:e5–e13 doi:10.1182/blood-2012-04-422394 [DOI] [PMC free article] [PubMed] [Google Scholar]
- 61. Deato MD, Marr MT, Sottero T, Inouye C, Hu P, Tjian R. 2008. MyoD targets TAF3/TRF3 to activate myogenin transcription. Mol. Cell 32:96–105 [DOI] [PMC free article] [PubMed] [Google Scholar]
- 62. Bresnick EH, Johnson KD, Kim SI, Im H. 2006. Establishment and regulation of chromatin domains: mechanistic insights from studies of hemoglobin synthesis. Prog. Nucleic Acid Res. Mol. Biol. 81:435–471 [DOI] [PubMed] [Google Scholar]
- 63. Zhu J, Bilan PJ, Moyers JS, Antonetti DA, Kahn CR. 1996. Rad, a novel Ras-related GTPase, interacts with skeletal muscle beta-tropomyosin. J. Biol. Chem. 271:768–773 [DOI] [PubMed] [Google Scholar]
- 64. Yada H, Murata M, Shimoda K, Yuasa S, Kawaguchi H, Ieda M, Adachi T, Murata M, Ogawa S, Fukuda K. 2007. Dominant negative suppression of Rad leads to QT prolongation and causes ventricular arrhythmias via modulation of L-type Ca2+ channels in the heart. Circ. Res. 101:69–77 [DOI] [PubMed] [Google Scholar]
- 65. Ji P, Lodish HF. 2010. Rac GTPases play multiple roles in erythropoiesis. Haematologica 95:2–4 [DOI] [PMC free article] [PubMed] [Google Scholar]
- 66. Ji P, Jayapal SR, Lodish HF. 2008. Enucleation of cultured mouse fetal erythroblasts requires Rac GTPases and mDia2. Nat. Cell Biol. 10:314–321 [DOI] [PubMed] [Google Scholar]
- 67. Kalfa TA, Pushkaran S, Mohandas N, Hartwig JH, Fowler VM, Johnson JF, Joiner CH, Williams DA, Zheng Y. 2006. Rac GTPases regulate the morphology and deformability of the erythrocyte cytoskeleton. Blood 108:3637–3645 [DOI] [PMC free article] [PubMed] [Google Scholar]
- 68. Watowich SS, Wu H, Socolovsky M, Klingmuller U, Constantinescu SN, Lodish HF. 1996. Cytokine receptor signal transduction and the control of hematopoietic cell development. Annu. Rev. Cell Dev. Biol. 12:91–128 [DOI] [PubMed] [Google Scholar]
- 69. Hu W, Yuan B, Flygare J, Lodish HF. 2011. Long noncoding RNA-mediated anti-apoptotic activity in murine erythroid terminal differentiation. Genes Dev. 25:2573–2578 [DOI] [PMC free article] [PubMed] [Google Scholar]
- 70. Vallabhapurapu S, Karin M. 2009. Regulation and function of NF-κB transcription factors in the immune system. Annu. Rev. Immunol. 27:693–733 [DOI] [PubMed] [Google Scholar]
- 71. Baldwin AS. 2012. Regulation of cell death and autophagy by IKK and NF-κB: critical mechanisms in immune function and cancer. Immunol. Rev. 246:327–345 [DOI] [PubMed] [Google Scholar]
- 72. Chen Z, Guo K, Toh SY, Zhou Z, Li P. 2000. Mitochondria localization and dimerization are required for CIDE-B to induce apoptosis. J. Biol. Chem. 275:22619–22622 [DOI] [PubMed] [Google Scholar]
- 73. Xu L, Zhou L, Li P. 2012. CIDE proteins and lipid metabolism. Arterioscler. Thromb. Vasc. Biol. 32:1094–1098 [DOI] [PubMed] [Google Scholar]
- 74. Ye J, Li JZ, Liu Y, Li X, Yang T, Ma X, Li Q, Yao Z, Li P. 2009. Cideb, an ER- and lipid droplet-associated protein, mediates VLDL lipidation and maturation by interacting with apolipoprotein B. Cell Metab. 9:177–190 [DOI] [PubMed] [Google Scholar]
- 75. Wojchowski DM, Sathyanarayana P, Dev A. 2010. Erythropoietin receptor response circuits. Curr. Opin. Hematol. 17:169–176 [DOI] [PMC free article] [PubMed] [Google Scholar]


