Abstract
Circadian disruption has deleterious effects on metabolism. Global deletion of Bmal1, a core clock gene, results in β-cell dysfunction and diabetes. However, it is unknown if this is due to loss of cell-autonomous function of Bmal1 in β cells. To address this, we generated mice with β-cell clock disruption by deleting Bmal1 in β cells (β-Bmal1−/−). β-Bmal1−/− mice develop diabetes due to loss of glucose-stimulated insulin secretion (GSIS). This loss of GSIS is due to the accumulation of reactive oxygen species (ROS) and consequent mitochondrial uncoupling, as it is fully rescued by scavenging of the ROS or by inhibition of uncoupling protein 2. The expression of the master antioxidant regulatory factor Nrf2 (nuclear factor erythroid 2-related factor 2) and its targets, Sesn2, Prdx3, Gclc, and Gclm, was decreased in β-Bmal1−/− islets, which may contribute to the observed increase in ROS accumulation. In addition, by chromatin immunoprecipitation experiments, we show that Nrf2 is a direct transcriptional target of Bmal1. Interestingly, simulation of shift work-induced circadian misalignment in mice recapitulates many of the defects seen in Bmal1-deficient islets. Thus, the cell-autonomous function of Bmal1 is required for normal β-cell function by mitigating oxidative stress and serves to preserve β-cell function in the face of circadian misalignment.
INTRODUCTION
It has long been recognized that circadian disruption (CD), as in shift work, increases the risk of diabetes, obesity, and metabolic syndrome (1–4). However, mechanisms underlying this are ill-defined. Over the last decade, molecular loops involved in the generation of circadian rhythms in cells, tissues, and the whole body have been delineated (5), along with recognition of the existence of a central clock residing in the hypothalamic suprachiasmatic nucleus (SCN) and peripheral clocks that reside in every cell (6, 7). Light is the primary entrainment signal for the central clock, which then synchronizes all peripheral clocks via neurohumoral pathways. Peripheral clocks not only receive synchronizing signals from the central clock but also respond to nutritional cues (8, 9). The core molecular clock consists of Bmal1 and Clock proteins that heterodimerize and activate Per and Cry gene transcription, while Per/Cry proteins provide feedback to inhibit the transactivation by Bmal1/Clock. Bmal1/Clock also transactivate many other genes to regulate metabolism (5, 10).
We and others have shown that genetic disruption of the molecular clock by deletion of Bmal1, the nonredundant core clock gene, leads to diabetes, secondary to β-cell failure (11–15). We have previously shown that this is secondary to impairment of glucose-stimulated insulin secretion (GSIS) because of mitochondrial uncoupling in β cells (14). However, it is unknown how the molecular clock regulates β-cell mitochondrial function and if this is a cell-autonomous function of Bmal1 in β cells. Furthermore, it is also unknown if circadian misalignment, due to alterations in light-dark cycles, leads to β-cell dysfunction and what, if any, required regulatory role the intrinsic β-cell molecular clock plays in adaptation to this disruption.
In this study, we addressed these questions by conditionally deleting Bmal1 in β cells in vivo. Loss of cell-autonomous function of Bmal1 in β cells results in the hyperglycemia, glucose intolerance, and impaired GSIS that are secondary to the upregulation of uncoupling protein Ucp2. We show that deletion of Baml1 in β cells leads to changes in antioxidant gene expression and oxidative stress-induced uncoupling and mitochondrial dysfunction. These findings demonstrate the required role of the β-cell intrinsic clock and Bmal1 in preserving β-cell function. The identification of this regulatory pathway could lead to targeted therapies to preserve β-cell function not only with shift work and CD but also in β-cell failure from other causes.
MATERIALS AND METHODS
Animals.
All animal experiments were approved by the Institutional Animal Care and Use Committee. Floxed-Bmal1 (Bmal1F/F) mice (12) were crossed with Rip-Cre transgenic mice (both lines purchased from Jackson Laboratory; stock numbers 007668 and 003573, respectively) to obtain β-Bmal1−/− (Bmal1F/F Rip-Cre+) mice and the Bmal1F/F, Rip-Cre, and wild-type controls. Mice were maintained under standard 12-h light-dark cycles with ad lib access to food and water, unless specified otherwise.
In vivo experiments.
Glucose tolerance tests (GTTs) and acute insulin secretion tests were performed at ZT4 (ZT is Zeitgeber time, and light on at 6 am was ZT0) after 16 h of overnight fasting (intraperitoneal [i.p.] d-glucose at 1.5 and 3 g/kg of body weight, respectively). For insulin tolerance tests (ITTs), i.p. insulin at 1 unit/kg was used. For wheel-running activity, the animals were housed individually in running wheel-equipped cages with free access to food and water. Acclimatization was for 5 days on a 12-h light-dark cycle, and then activity was recorded (Chronobiology kit; Stanford Software Systems) during light-dark cycles for 5 days, followed by a 12-h dark-dark cycle for 9 days. The free-running period length was determined by chi-square periodogram analysis.
Metabolic cage measurements.
Oxygen consumption (VO2), energy expenditure, carbon dioxide production, and the respiratory quotient (RQ) were measured with the comprehensive laboratory animal monitoring system (Columbus Instruments) in individual cages without bedding. Mice were acclimated to the metabolic cages for 4 days prior to the start of data collection. Data were collected for 72 h. All data were analyzed and averaged for the dark and light cycles, separately.
Islet isolation and insulin secretion measurement were performed as described previously (16). For genipin and N-acetylcysteine (NAC) rescue, islets were incubated with either 10 μm genipin (Sigma) or 1 mM NAC (Sigma) for 1 h prior to the beginning and maintained during the course of the experiment. Insulin was quantitated with a mouse insulin enzyme-linked immunosorbent assay) kit (Mercodia, Uppsala, Sweden). Insulin content was assayed after acid-ethanol extraction from isolated islets and normalized to protein.
Gene and protein expression.
Quantitative PCR (qPCR) from cDNA made from DNase-digested RNA was performed with gene-specific primers with SYBR green mix and normalized to the expression of housekeeping genes (the genes for TATA binding protein [Tbp], TopI, β-actin, and peptidyl prolyl isomerase A) with Genorm (17). The sequences of the primers used are available on request. Western blotting of total protein from 200 to 300 islets from two mice was performed as described before (14). Bmal1 antibody (rabbit polyclonal, 1:3,000; Abcam) and β-actin antibody (rabbit monoclonal-horseradish peroxidase conjugate, 1:5,000; Cell Signaling), as a housekeeping control, were visualized by enhanced chemiluminescence (Pierce). Immunostaining was performed as previously described (14, 16), with formalin-fixed, paraffin-embedded tissues, except for Bmal1 staining, for which frozen sections were used. The primary antibodies were against insulin (guinea pig polyclonal, 1:500; Abcam), Ucp2 (goat polyclonal, 1:25; Santa Cruz Biotechnology), and Bmal1 (rabbit polyclonal, 1:1,000; Abcam). No primary antibody control staining was performed (not shown).
In vitro experiments.
For serum shock to synchronize cells (18), cells were plated to ∼80% density and incubated in serum-free RPMI 1640 overnight. They were then shocked with 50% serum for 2 h, and then the medium was changed to RPMI 1640 with 5% serum. Cells were collected every 4 h for RNA. Chromatin immunoprecipitation (ChIP) was performed by using standard protocols and 832/13 cells (Ins-1-derived insulinoma cell line; a gift from C. B. Newgard, Duke University) with anti-Bmal1 antibody (Abcam) or control IgG for pulldown. DNA was then used as the template for qPCR with primers flanking conserved E boxes on promoters of Ucp2 and Nrf2.
Mitochondrial experiments.
Cellular reactive oxygen species (ROS) was detected by incubating isolated islets in 5 μM 2′,7′-dichlorofluorescein (DCF) diacetate for 30 min in phosphate-buffered saline (basal) and then in 11.1 mM glucose for 10 min. Oxidized DCF emits a green fluorescence that was imaged with 530-nm emission filters at the baseline and after glucose stimulation and quantitated with ImageJ. ATP/ADP assay was performed with the BioVision apoSENSOR kit, by using 10 isolated islets per well. The mitochondrial membrane potential (ψ) in isolated islets was determined with the JC-1 assay with 2 μM JC-1 dye in dimethyl sulfoxide for 20 min (14, 19).
Shift work simulation paradigm.
Mice were kept on a weekly schedule with normal 12-h light-dark cycles (lights on at 6 am and off at 6 pm) for the first 3 days and then subjected to a 6-h light-dark phase advancement for the next 4 days (lights on at 12 midnight and off at 12 noon). This cycle was repeated for the duration of the study (Fig. 9A). All physiological testing was performed on the second day after a return to a normal light-dark schedule.
Fig 9.
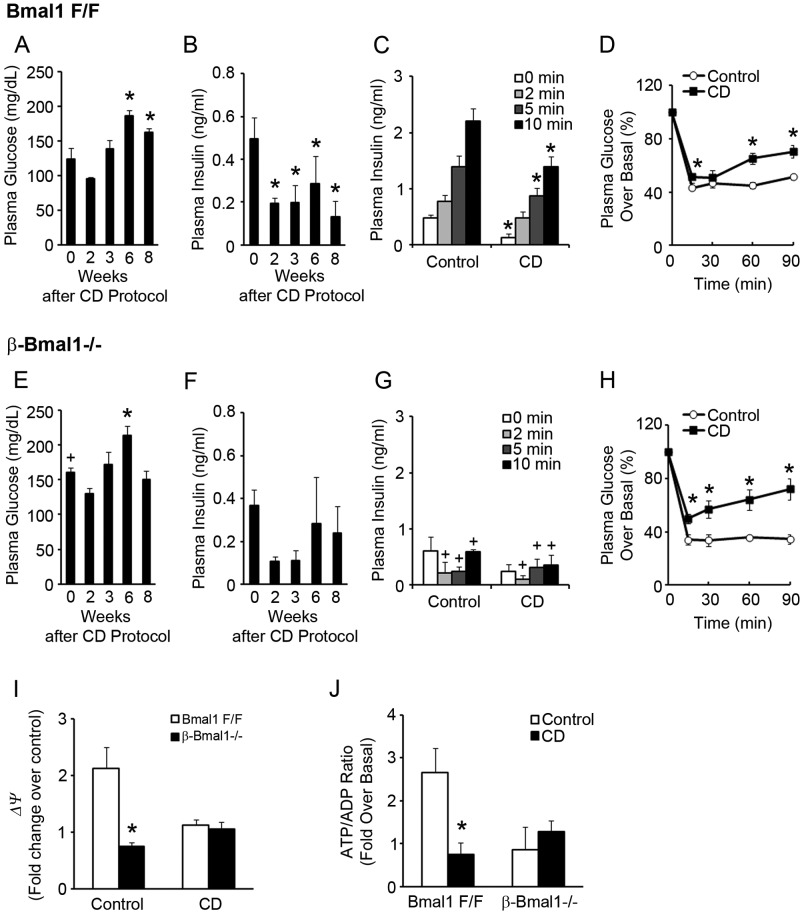
CD by shift work simulation induces β-cell dysfunction. (A and E) Plasma glucose levels in 16-h-fasted Bmal1F/F (A) and β-Bmal1−/− (E) mice at ZT4. n = 4 or 5. *, P ≤ 0.05 compared to the baseline (0 weeks); +, P < 0.05 compared to the corresponding time point between Bmal1F/F in panel A and β-Bmal1−/− mice in panel E. (B and F) Plasma insulin levels in 16-h-fasted Bmal1F/F (B) and β-Bmal1−/− (F) mice at ZT4. n = 4 or 5. *, P ≤ 0.05 compared to the baseline (0 weeks). (C and G) Acute insulin secretion after glucose stimulation at 8 weeks after the start of the CD protocol at ZT4 in Bmal1F/F (C) and β-Bmal1−/− (G) mice compared to that of mice during normal 12-h light-dark cycles (control). n = 4 or 5. *, P ≤ 0.05 compared to the baseline (0 min); +, P < 0.05 compared to the corresponding time point between Bmal1F/F mice in panel C and Bmal1−/− mice in panel G. (D and H) Plasma glucose levels, expressed as percent changes over the basal level, in Bmal1F/F (D) and β-Bmal1−/− (H) mice during an ITT performed 5 weeks after the start of a CD protocol at ZT4 compared to those of mice during a normal 12-h light-dark cycle (control). n = 4 or 5. *, P ≤ 0.05 compared to the baseline (0 min). (I) Red/green (590/530 nm) fluorescence ratios of isolated islets from Bmal1F/F and β-Bmal1−/− mice during both control and CD protocols after loading with JC-1 dye on exposure to 2.8 and 25 mM glucose concentrations. The values shown are fold changes over Bmal1F/F islets in 2.8 mM glucose. n = 3 or 4. *, P ≤ 0.05 for β-Bmal1−/− compared to Bmal1F/F. (J) Fold change over the basal ATP/ADP ratio measured in isolated islets from Bmal1F/F and β-Bmal1−/− mice after exposure to 2.8 and 25 mM glucose concentrations during both control and CD protocols. n = 3 or 4. *, P ≤ 0.05 for CD compared to the control. All values are means ± the standard errors of the means.
Statistical methods.
Significance testing was performed with Student's t test unless otherwise specified, and one-way repeated-measures analysis of variance (ANOVA) with posttest pairwise multiple-comparison Holm-Sidak procedures was used to determine significance at P < 0.05 for the assessment of a circadian rhythm of gene expression over a 24-h period.
RESULTS
Cell-autonomous function of Bmal1 in β cells is required for glucose homeostasis.
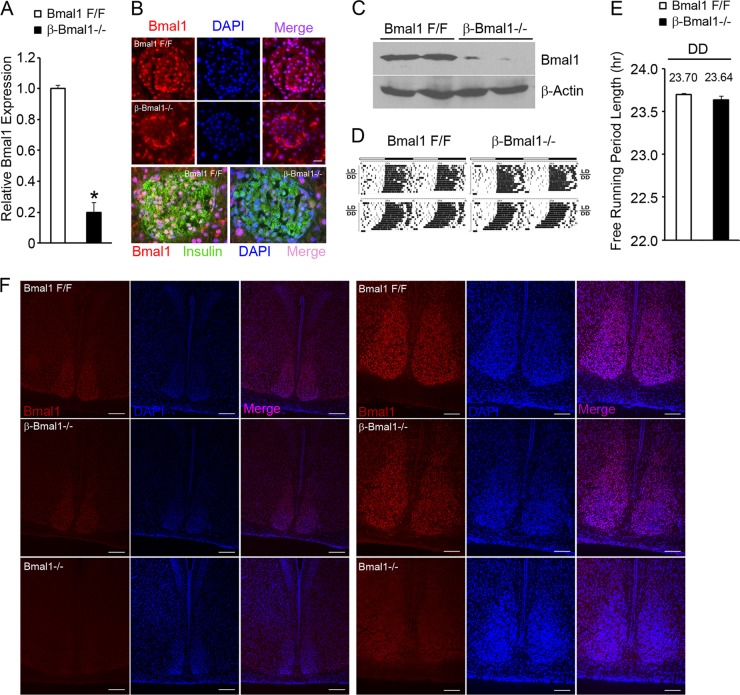
We have demonstrated previously that mitochondrial dysfunction underlies glucose intolerance and impaired GSIS in global Bmal1−/− mice (14). To address whether this is due to a loss of cell-autonomous Bmal1 function in β cells, we generated mice with inactivation of Bmal1 in β cells, with Rip-Cre transgenic mice crossed with floxed-Bmal1 mice (20) that have the Bmal1 DNA binding domain flanked by loxP sites. The islets in these mice (β-Bmal1−/−) have significantly decreased expression of Bmal1 mRNA by reverse transcription (RT)-qPCR and protein by immunostaining and Western blotting (Fig. 1A to C). To exclude the possibility that Rip-Cre expression in the brain (21) led to the deletion of Bmal1 from the SCN and disruption of the central clock, we assessed free-running rhythm in dark-dark cycles by circadian wheel-running activity. β-Bmal1−/− mice had normal circadian wheel-running activity, with a free-running period in dark-dark cycles that was similar to that seen in Bmal1F/F mice (Fig. 1D and E). β-Bmal1−/− mice also displayed nuclear Bmal1 protein in the SCN (Fig. 1F). Furthermore, β-Bmal1−/− mice have normal body weight, along with normal food intake, VO2, energy expenditure, and fuel selection (indicated by the RQ), as shown in Fig. 2A to E. All of these together indicated that β-Bmal1−/− mice have a functioning central clock and excluded significant confounding disruptions in the hypothalamic centers regulating metabolism and energy balance in these mice.
Fig 1.
β-Bmal1−/− mice have a deletion of Bmal1 in β cells but have an intact central clock. (A) RT-qPCR of Bmal1transcript from isolated islets. n = 4. All values are means ± the standard errors of the means. *, P ≤ 0.05. (B) Representative images of Bmal1 immunostaining in pancreatic islets. Nuclear Bmal1 staining is absent from the core of the islet in β-Bmal1−/− (middle row), in contrast to the Bmal1F/F control (top row). Scale bars represent 10 μm. The bottom row is a representative image of the costaining of Bmal1 and insulin and reveals the absence of Bmal1 in insulin-staining β cells. The non-insulin-positive cells in the islet continue to stain for Bmal1. DAPI, 4′,6-diamidino-2-phenylindole. (C) Western blotting of isolated islets from Bmal1F/F and β-Bmal1−/− mice reveals a significant loss of Bmal1 protein in β-Bmal1−/− islets. Each lane represents ∼200 to 300 islets pooled from two mice. (D and E) Representative actograms of the wheel-running activities of β-Bmal1−/− mice and control Bmal1F/F mice (D) and free-running period length during dark-dark (DD) cycles (E). LD is 12-h light-dark cycles, and DD is 12-h dark-dark cycles. n = 5. All values are means ± the standard errors of the means. (F) Representative images of SCNs from Bmal1F/F and β-Bmal1−/− mice showing normal nuclear Bmal1 in the SCN. Low-magnification images (scale bars, 50 μm) are shown on the left, and higher-magnification images (scale bars, 100 μm) of the SCN are shown on the right.
Fig 2.
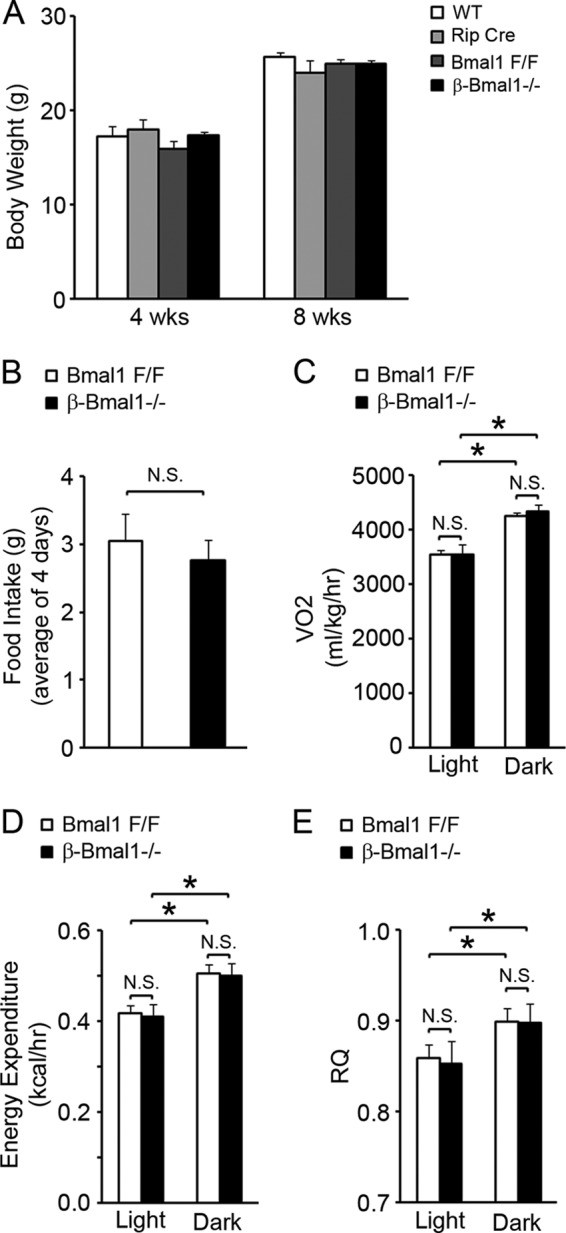
β-Bmal1−/− mice have normal food intake and energy expenditure. (A and B) Body weight (A) and food intake (B) measured over a 4-day period. n = 4 or 5. (C to E) VO2 (C), energy expenditure (D), and RQ (E) were assessed as described in Materials and Methods. n = 4 or 5. All values are means ± the standard errors of the means. *, P ≤ 0.05; N.S., not significant; WT, wild type.
Male β-Bmal1−/− mice develop fasting hyperglycemia (259 ± 17 mg/dl in β-Bmal1−/− mice versus 153 ± 17 mg/dl in Bmal1F/F mice, 156 ± 9 mg/dl in Rip-Cre mice, and 141 ± 16 mg/dl in wild-type mice; P < 0.05 for the β-Bmal1−/− group versus the other groups) at 8 weeks, with severe glucose intolerance in an i.p. GTT (Fig. 3A). This was due to in vivo GSIS blunting during the GTT (Fig. 3B), strongly suggesting impaired β-cell function. Similar results were obtained with female β-Bmal1−/− mice (data not shown). A normal response during an ITT (Fig. 3C and D) excluded peripheral insulin resistance as a cause of glucose intolerance. When assessed for acute insulin secretion, in vivo, β-cell Bmal1−/− mice had an abrogation of first-phase insulin secretion, compared to Bmal1F/F, Rip-Cre, and wild-type control mice (Fig. 3E), confirming the β-cell insulin secretory defect. This is not secondary to a decrease in β-cell mass or to any decrease in insulin content in the total pancreas or equally sized islets in β-cell Bmal1−/− mice compared to floxed controls (data not shown). Thus, deletion of Bmal1 function in β cells leads to a significant impairment of GSIS in vivo, with consequent glucose intolerance and diabetes.
Fig 3.
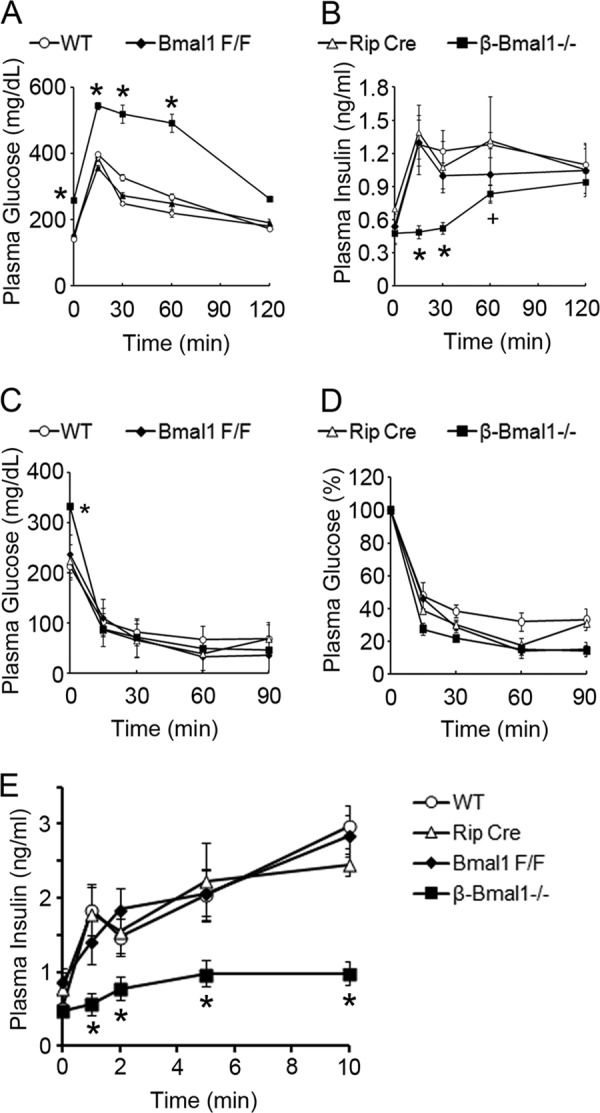
Cell-autonomous function of Bmal1 in β cells is required for normal glucose homeostasis. (A and B) Plasma glucose and insulin levels of 8-week-old mice at ZT4 during a GTT. (C and D) Plasma glucose levels during an ITT at ZT8. Panel C displays the absolute glucose levels during the ITT, and panel D shows the percent decrease from the baseline. (E) Acute insulin secretion after glucose stimulation in 10-week-old mice at ZT4. All groups had five mice, except the Rip-Cre control group, which had three. All values are means ± the standard errors of the means. *, P ≤ 0.05 compared to all of the control groups; +, P ≤ 0.05 compared to the wild-type (WT) and Rip-Cre control groups.
Diabetes in β-Bmal1−/− mice is secondary to impaired GSIS from uncoupled β cells.
Our previous studies with global Bmal1−/− mice displayed insulin secretory defects in response to glucose, but not in response to depolarizing secretagogues, because of upregulation of the uncoupling protein Ucp2 (14). Since Ucp2 is also regulated by non-cell-autonomous pathways, including the sympathetic system, we used β-Bmal1−/− islets to test if a loss of cell-autonomous function of Bmal1 in β cells is sufficient to dysregulate Ucp2 expression. Indeed, β-Bmal1−/− islets had a Ucp2 transcript increase by RT-qPCR (Fig. 4A), and this was consistent with an increase in Ucp2 protein in Bmal1-deficient islets by immunohistochemistry (Fig. 4B).
Fig 4.
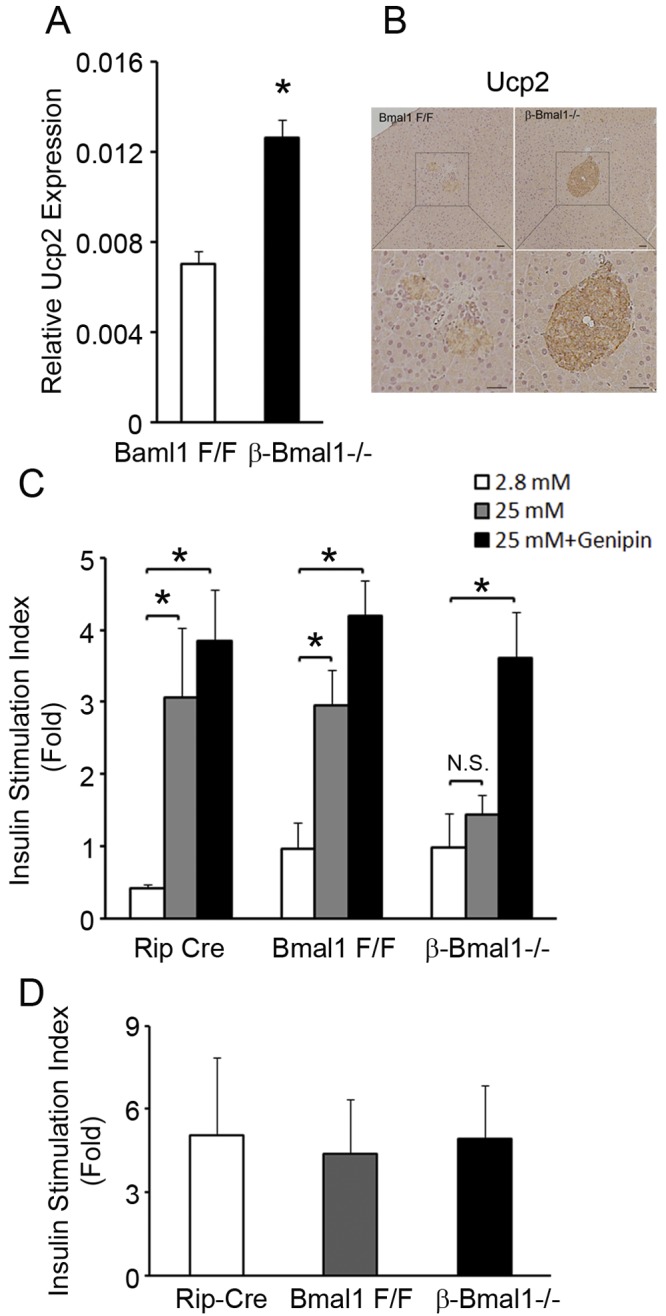
β-Bmal1−/− islets have impaired GSIS because of mitochondrial uncoupling. (A) RT-qPCR of Ucp2 transcript from isolated islets. n = 4. (B) Representative image of immunohistochemistry of pancreas tissue for Ucp2 showing increased brown staining in β-Bmal1−/− islets compared to that in Bmal1F/F islets. The scale bar represents 20 μm. (C) Insulin secretion from isolated islets on exposure to 2.8 and 25 mM glucose concentrations and rescue of insulin secretion after exposure to 10 μM genipin for 1 h. All values are expressed as fold changes over the basal level of insulin secretion of Bmal1F/F islets in 2.8 mM glucose. n = 4. (D) Insulin secretion from isolated islets on exposure to 2.8 mM glucose with and without 30 mM KCl. Values are expressed as fold increases in insulin secretion with KCl over the baseline. n = 4. All values are means ± the standard errors of the means. *, P ≤ 0.05; N.S., not significant.
To determine if this change in Ucp2 was physiologically significant, we studied insulin secretion in response to glucose in isolated islets from β-Bmal1−/− mice and controls and if any observed impairment could be rescued by specific inhibition of Ucp2. β-Bmal1−/− islets had a basal insulin secretion level (at 2.8 mM glucose) similar to that of controls (9.89 ± 4.7 ng/mg protein in β-Bmal1−/− mice versus 9.67 ± 3.6 ng/mg protein in Bmal1F/F mice and 4.3 ± 0.5 ng/mg protein in Rip-Cre mice). However, there was a significant blunting of insulin secretion in response to 25 mM glucose, compared to the control islets (Fig. 4C), consistent with in vivo findings, confirming that the cell-autonomous function of Bmal1 in β cells is required for normal GSIS. Furthermore, inhibition of Ucp2 by the specific inhibitor genipin (22) was sufficient to rescue the impairment of GSIS in isolated β-Bmal1−/− islets (Fig. 4C). This strongly suggests that uncoupled mitochondria in β cells are the primary reason underlying this GSIS impairment. Additionally, a normal KCl-induced insulin secretory response in β-Bmal1−/− islets (Fig. 4D) excluded significant disruption of processes critical to GSIS, that are downstream of membrane depolarization, in Bmal1-deficient β cells, confirming our previous results with global Bmal1−/− mice (14).
The increase in Ucp2 expression in β-Bmal1−/− islets suggested regulation by the circadian clock. Indeed, Ucp2 transcript expression displayed a circadian rhythm in wild-type islets (Fig. 5A). Interestingly, this inversely correlated with plasma insulin (Fig. 5B), highlighting an important role for Ucp2 in the regulation of physiologic insulin secretion from β cells. However, putative Bmal1 binding sites in the Ucp2 promoter did not enrich in ChIP with anti-Bmal1 antibody (Fig. 5C), suggesting that Ucp2 may not be a direct transcriptional target of Bmal1, though we cannot completely exclude this possibility. This prompted us to assess ROS, an inducer of Ucp2 expression, in β-Bmal1−/− islets.
Fig 5.
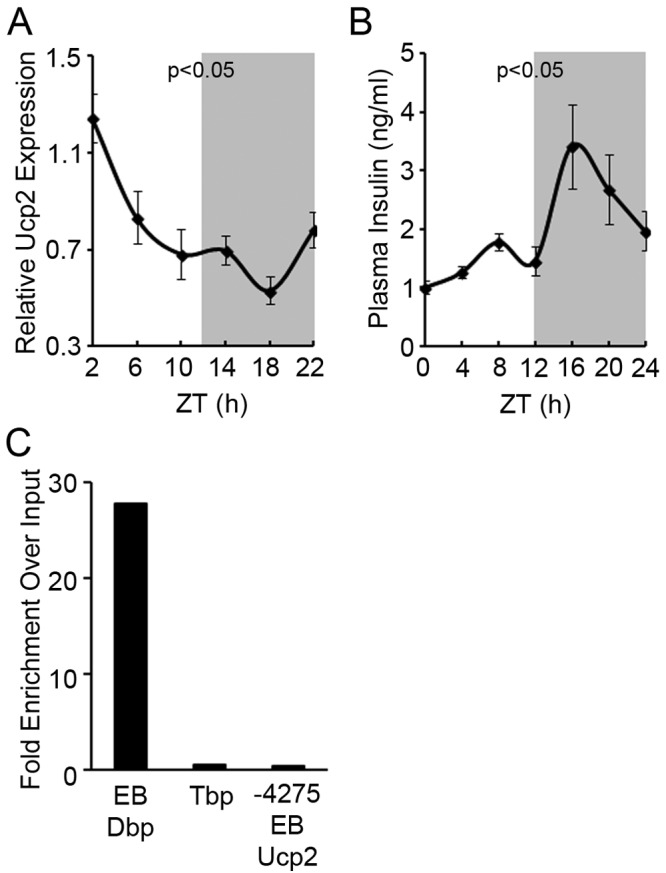
Ucp2 expression is circadian. (A) RT-qPCR of Ucp2 from total RNA from islets isolated every 4 h from wild-type control mice housed in normal 12-h light-dark (LD) cycles. Light on at 6 am was ZT0. All values are means ± the standard errors of the means. P ≤ 0.05 by one-way repeated-measures ANOVA for the various time points. (B) Plasma insulin measured every 4 h from wild-type control mice housed in normal 12-h LD cycles. Light on at 6 am was ZT0. All values are means ± the standard errors of the means. P ≤ 0.05 by one-way repeated-measures ANOVA for the various time points. (C) ChIP of 832/13 cells with anti-Bmal1 antibody and qPCR with primers flanking putative Bmal1 binding E-box elements (EB). DNA binding protein (Dbp) and Tbp are positive and negative controls for Bmal1 target genes. The y axis represents the ratio of pulldown DNA to input DNA expressed as the fold change over the IgG control.
Bmal1 is required to prevent ROS accumulation in β cells.
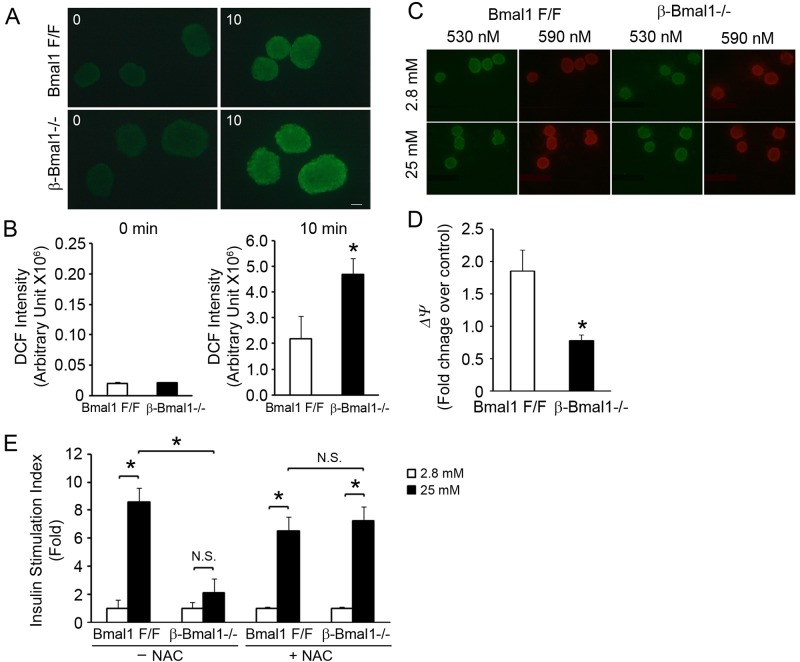
ROS induces and activates Ucp2 (23, 24), which then protects against an unchecked increase in inner mitochondrial membrane hyperpolarization, the driving force for ROS generation (25). Interestingly, global Bmal1−/− mice display increased ROS in many tissues, including kidney, heart, and spleen tissues (26). Hence, we assessed whether ROS accumulation was also present in β-Bmal1−/− islets. Exposure to 11.1 mM glucose was sufficient to induce ROS accumulation, as measured by DCF fluorescence, in control floxed islets. However, this was significantly (∼2-fold) higher in Bmal1-deficient islets than in floxed controls (Fig. 6A and B), demonstrating that loss of Bmal1 function in β cells is sufficient to increase ROS accumulation.
Fig 6.
Increased ROS seen in β-Bmal1−/− islets leads to impaired GSIS. (A and B) ROS measured by DCF fluorescence after exposure to 11.1 mM glucose for 10 min. Representative images of DCF fluorescence are shown in panel A, and the quantitation is shown in panel B. n = 4. The scale bar represents 20 μm. (C and D) Red/green (590/530) fluorescence of isolated islets after loading with JC-1 dye on exposure to 2.8 and 25 mM glucose concentrations. Representative images of the JC-1 assay are shown in panel C. The images shown were taken at emission wavelengths of 530 nm (green indicates the cytosolic JC-1 dye) and 590 nm (red indicates the intramitochondrial dye). Red/green (590/530) fluorescence ratios were quantitated, and the values shown are old changes over Bmal1F/F islets in 2.8 mM glucose (D). n = 4. (E) GSIS in isolated islets from β-Bmal1−/− and control Bmal1F/F mice with or without preincubation with 1 mM NAC for 1 h, as indicated. All values are expressed as fold changes over the basal level of insulin secretion of Bmal1F/F islets in 2.8 mM glucose. n = 4. All values are means ± the standard errors of the means. *, P ≤ 0.05; N.S., not significant.
The increase in ROS accumulation with glucose in Bmal1-deficient islets could arise from an increase in ROS generation or impaired scavenging. Since ROS generation in mitochondria is driven by changes in the potential gradient across the inner mitochondrial membrane (ψ), we assessed the glucose-induced change in mitochondrial ψ in β-Bmal1−/− and control islets by quantitating the change in green to red fluorescence of JC-1 dye, which directly reflects the mitochondrial ψ (19). The mitochondrial ψ increased by ∼1.8-fold in control islets when they were exposed to 25 mM glucose for 20 min. However, this glucose-induced hyperpolarization in mitochondrial ψ seen in control islets was significantly blunted in β-Bmal1−/− islets (Fig. 6C and D), indicating that the ROS-generating mitochondrial ψ was actually lower in β-Bmal1 islets. This implicated impaired scavenging as the likely cause of the increased ROS in Bmal1-deficent islets.
Reduction of ROS accumulation in β-Bmal1−/− islets rescues impairment of GSIS.
To definitively test the pathophysiological significance of the increased ROS, we assessed if preincubation of β-Bmal1−/− islets with 1 mM NAC, an antioxidant that efficiently scavenges ROS, is sufficient to rescue the impaired GSIS. In stark contrast to the significant blunting of GSIS seen in these β-Bmal1 islets, Bmal1-deficient islets pretreated with NAC displayed normal GSIS, compared to similarly treated control floxed islets (Fig. 6E). Thus, ROS scavenging completely rescued the impaired GSIS in β-Bmal1−/− islets. Taken together with the rescue of GSIS by Ucp2 inhibition, these data demonstrate that Bmal1-deficient islets accumulate excess ROS, leading to upregulation of Ucp2 and uncoupling-induced impairment of GSIS.
Bmal1 regulates Nrf2 and antioxidant genes to preserve antioxidant function in β cells.
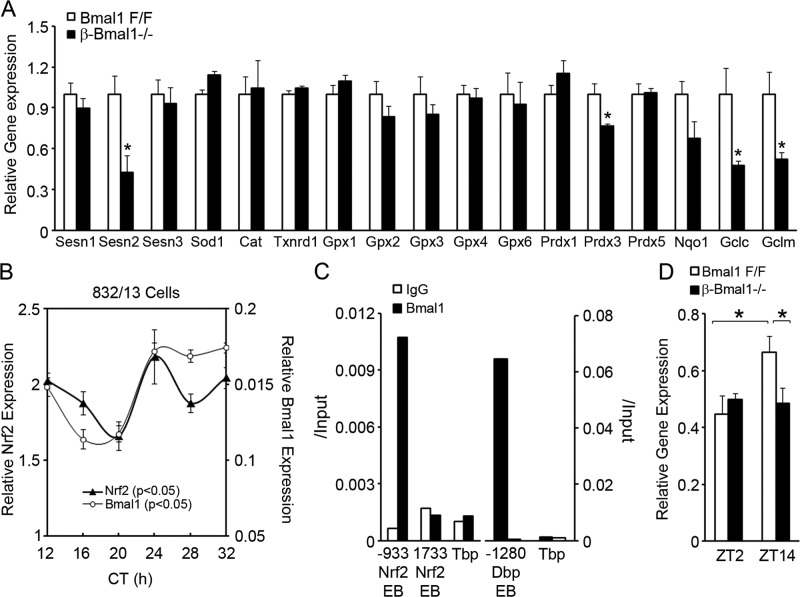
The data above demonstrate that Bmal1 is required to prevent ROS accumulation scavenging and antioxidant activity in β cells. An increased ROS level leads to an adaptive increase in the expression of antioxidant genes primarily via the antioxidant response element (ARE) in proximal promoters, activated by key transcription factors such as nuclear factor erythroid 2-related factor 2 (Nfe2l2), which is commonly abbreviated Nrf2. Since Bmal1-deficient islets had increased ROS accumulation, we expected antioxidant gene expression to be greater than that in control floxed islets. Surprisingly, despite an increased ROS level, the expression of antioxidant genes was not increased in Bmal1-deficient islets, but there was a significant decrease in the expression of Sestrin2 and mitochondrial thioredoxin-dependent peroxide reductase Prdx3, both of which are related to the peroxiredoxin pathway, and in Gclm and Gclc (glutamate cysteine ligase modifier and catalytic subunits, respectively) (Fig. 7A). Since all of these are transcriptional targets of Nrf2, we tested if Nrf2 expression is circadian in β cells. In serum-shocked 832/13 cells, Nrf2 expression was circadian (Fig. 7B). Furthermore, Bmal1 binds directly to E-box elements in the cis-promoter region of Nrf2 in a ChIP assay, indicating the direct transcriptional activation of Nrf2 by Bmal1 (Fig. 7C). This was consistent with a disrupted Nrf2 expression rhythm in β-Bmal1−/− islets. While control floxed islets displayed greater expression at ZT14 than at ZT2, no such increase was seen in β-Bmal1−/− islets (Fig. 7D). Thus, Bmal1 and β-cell molecular clock regulate cellular antioxidant responses by regulating Nrf2, the key ARE-binding transcription factor, and this may contribute to the observed increase in ROS accumulation in Bmal1-deficient islets.
Fig 7.
Bmal1 regulates antioxidant genes in β cells. (A) Relative expression of antioxidant genes in β-Bmal1−/− and Bmal1F/F islets. n = 4. All values are means ± the standard errors of the means. *, P ≤ 0.05 by t testing. (B) RT-qPCR for Nrf2 from RNA extracted every 4 h from serum-shocked 832/13 cells. Circadian time (CT) is the time after the serum shock was started. The relative expression of Bmal1 from the same samples is shown for comparison. n = 4. P < 0.05 by one-way repeated-measures ANOVA for the various time points for the same gene. (C) ChIP of 832/13 cells with Bmal1 or control IgG antibody and qPCR with primers flanking putative Bmal1 binding E-box elements (EB). Tbp served as a negative control and Dbp served as a positive control for Bmal1 target genes. The y axis represents the ratio of pulldown DNA to input DNA. (D) Relative expression of the gene for Nrf2 in β-Bmal1−/− and Bmal1F/F islets isolated at ZT2 and ZT14. n = 4 to 6. All values are means ± the standard errors of the means. *, P ≤ 0.05.
Environment-induced circadian misalignment leads to defective insulin secretion and β-cell dysfunction.
The data above demonstrate that genetic disruption of the circadian clock in β cells is sufficient to impair β-cell function. However, it is unknown if CD by environment-induced circadian misalignment is sufficient to induce a similar β-cell dysfunction. To test this, we induced CD in control mice by an alternate phase advance-and-delay protocol designed to simulate shift work. This involved a weekly cycle composed of normal 12-h light-dark cycles for 3 days, followed by a 6-h light phase advance for 4 days (Fig. 8A). CD had no significant impact on body weight over 8 weeks (Fig. 8B). However, this CD led to a progressive increase in fasting blood glucose levels that was evident as early as 6 weeks (Fig. 9A) and was accompanied by a decrease in fasting plasma insulin levels (Fig. 9B), suggestive of β-cell dysfunction. This was confirmed directly in vivo by a significant blunting of first-phase insulin secretion in CD mice compared to the control mice during normal light-dark cycles (Fig. 9C). This circadian misalignment was accompanied by peripheral insulin resistance, reflected by a decrease in insulin sensitivity during an ITT (Fig. 9D). These data indicate that CD was sufficient to induce a blunting of insulin secretion that led to a decrease in the plasma insulin level which, in the face of increasing peripheral insulin resistance, results in diabetes.
Fig 8.

Shift work-simulating CD protocol. (A) The shift work-simulating CD protocol is shown for a 2-week period with alternating light phase advancement and delay. Mice were on a weekly schedule with normal 12-h light-dark cycles (lights on at 6 am and off at 6 pm) for the first 3 days of the week and then subjected to a 6-h light-dark phase advancement for the next 4 days (lights on at 12 midnight and off at 12 noon). This cycle was repeated for the duration of the study. (B) Body weight, which was measured weekly for the duration of the experiment. Control, normal 12-h light-dark cycles. n = 4 or 5. All values are means ± the standard errors of the means.
To test the role of the intrinsic β-cell clock, β-Bmal1−/− mice were subjected to a similar shift work-simulating CD protocol. Under these conditions of circadian misalignment, β-Bmal1−/− mice displayed a similar increase in fasting glucose levels accompanied by a decrease in their fasting plasma insulin levels (Fig. 9E and F). The blunting of first-phase insulin secretion in β-Bmal1−/− mice persisted throughout the experiment (Fig. 9G). Furthermore, central clock disruption induced by environmental CD induced similar peripheral insulin resistance in the β-Bmal1−/− mice (Fig. 9H).
We then tested if mechanisms underlying β-cell dysfunction with environmental CD were similar to those seen after genetic disruption. Islets from floxed control mice, during normal light-dark cycles, displayed an ∼2-fold glucose-induced increase in mitochondrial ψ, as assessed by JC-1 assay, while this was blunted in islets from CD mice (Fig. 9I). Consistent with this, while islets from floxed control mice, during normal light-dark cycles, displayed a robust ∼2.5-fold glucose-induced increase in the ATP/ADP ratio, islets from CD floxed mice totally lost their responsiveness to a glucose-induced rise in the ATP/ADP ratio (Fig. 9J). This indicated that 8 weeks of CD was sufficient to induce a severe defect in the transducing glucose stimulus to a mitochondrial ψ-driven change in the ATP/ADP ratio, a defect that is very similar to that seen in β-Bmal1−/− islets from mice that were in regular light-dark cycles (Fig. 9I and J). Interestingly, subjecting the β-Bmal1−/− mice to CD did not lead to any further worsening of the glucose-stimulated change in mitochondrial ψ or the ATP/ADP ratio. Thus, environmental CD and genetic disruption of the β-cell clock both induced β-cell dysfunction via similar mechanisms that culminated in an impaired glucose-stimulated ATP/ADP ratio, resulting in GSIS blunting in vivo and in hyperglycemia.
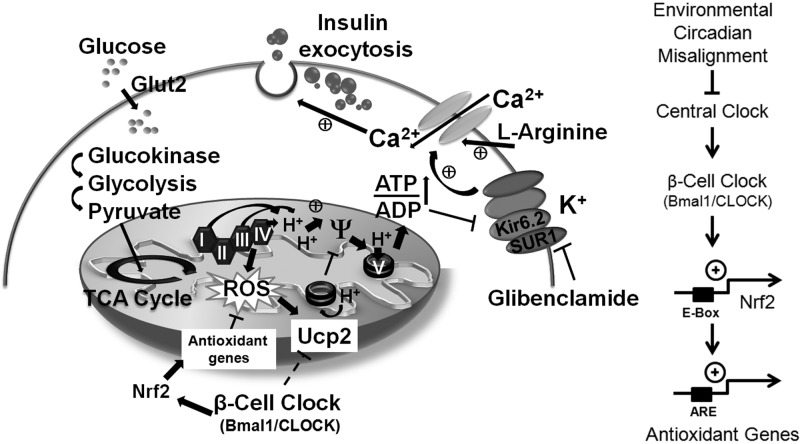
In summary, our results demonstrate that the cell-autonomous function of Bmal1 is required for normal glucose-stimulated stimulus-secretion coupling and insulin secretion and that loss of this function leads to oxidative stress-induced uncoupling of mitochondria and impairment of GSIS (schematically shown in Fig. 10). Furthermore, environmental circadian clock disruption by a shift work-simulating paradigm is sufficient to induce a β-cell insulin secretory dysfunction that is significantly worsened by the loss of β-cell clock function.
Fig 10.
Schematic model of a β cell depicting the circadian control of glucose-stimulated insulin secretion via regulation of antioxidant genes, ROS scavenging, and Ucp2. On the right is a scheme depicting the regulation of Nrf2 and antioxidant genes by Bmal1 and the β-cell clock. TCA, tricarboxylic acid.
DISCUSSION
Circadian rhythmicity in metabolic processes, and specifically in β cells, has long been recognized (5, 27, 28). Though Bmal1 deletion in the whole pancreas has been reported to cause diabetes, the cell-autonomous role of Bmal1 and the β-cell clock specifically in the regulation of β-cell function has not been studied. In this study, we used genetic (conditional deletion of Bmal1 in β cells) and environmental (circadian misalignment induced by disrupted light-dark cycles) tools to demonstrate that the loss of cell-autonomous function of Bmal1 is sufficient to induce β-cell dysfunction by impairing mitochondrial function and culminates in diabetes and that the β-cell clock is central to the circadian clock regulation of β-cell function.
Bmal1 and the intrinsic circadian clock are required for normal β-cell function.
Since Bmal1 is the only nonredundant core clock gene that whose deletion leads to a loss of free-running rhythm (29), we used conditional Bmal1 deletion in β cells as a model of disruption of the intrinsic clock in β cells to test its requirement for normal β-cell function. In this study, we used Rip-Cre to specifically delete Bmal1 from β cells without affecting other cells in the islet. Though Rip-Cre is known to be expressed in many areas of the brain (21), we demonstrate that in β-Bmal1−/− mice, hypothalamic functions regulating central clock function, appetite, food intake, and energy expenditure remained largely intact, excluding them as confounding factors. β-Bmal1−/− mice become diabetic, with severe glucose intolerance and impaired GSIS, a consequence of increased Ucp2 expression. After the deletion of Bmal1 from the whole pancreas with Pdx1 promoter-driven Cre, two studies reported impaired GSIS and β-cell dysfunction (13, 15). Furthermore, one of these studies (13) also concluded that impaired insulin exocytosis, with no significant mitochondrial impairment, was the major defect in β cells with a disrupted clock. This conclusion is not consistent with our data, wherein we demonstrate that the major defect in Bmal1-deficient islets is mitochondrial dysfunction leading to GSIS impairment by using assays of many different factors, including the ATP/ADP ratio, the mitochondrial potential gradient, the insulin secretory response to depolarizing agents, and rescue with both antioxidants and specific Ucp2 inhibitors. These differences could be secondary to the fact that, unlike Rip-Cre, which is β cell specific in the islet, Pdx-1 Cre deletes Bmal1 from all islet cells, including α and δ cells, that affect insulin secretion (30–32).
Circadian clock and oxidative stress.
ROS, generated at low levels during normal oxidative metabolism, when increased, leads to uncoupling-induced impairment of GSIS (22, 33–39). Since metabolism in β cells is significantly dependent on circadian clock-regulated nutrient flux, we hypothesized that β cells utilize circadian clock-regulated control of antioxidant defense mechanisms to mitigate the anticipated rise in ROS levels. This is especially important as β cells have a significantly lower antioxidant capacity than other tissues (40–43). Our data reveal that Bmal1 directly regulates the expression of the key antioxidant response regulator Nrf2. This indicates that many of the antioxidant genes that Nrf2 regulates via the ARE in promoter regions would also display a circadian rhythm, a finding that has been reported in rodent liver experiments (44, 45). Interestingly, both Prdx3 and Gclc are important in preventing oxidative stress-induced apoptosis in β cells (46, 47). Bmal1 and the circadian clock have been postulated to regulate oxidative stress in other tissues, including kidney, heart, and spleen tissues (26, 48), and recent studies have shown that there is a significant increase in ROS in Bmal1−/− mice that can be rescued, in part, by the antioxidant NAC (48). This is also consistent with our finding that NAC rescued the GSIS impairment in Bmal1-deficient islets. This raises the intriguing possibility of preventing shift work-associated diabetes with antioxidants, and larger trials are required to specifically address this. While this study focused on the effect of a loss of β-cell clock function on oxidative stress in β cells, it is certainly possible that other factors that the β-cell clock regulates are also contributing to this phenotype. For instance, endoplasmic reticulum stress is closely associated with oxidative stress and is a significant factor in the pathogenesis of β-cell failure under metabolic stress. Future studies will address this interaction and its contribution to β-cell failure.
Circadian misalignment and β-cell function.
It has been reported for over 2 decades that circadian misalignment with shift work increases the risk of metabolic syndrome and diabetes. Results from the Nurse's Health Study (3, 4) provide evidence of the cumulative deleterious effect of shift work on glucose homeostasis. There is no study that directly implicates β-cell dysfunction as the cause of diabetes associated with circadian misalignment. To address this, we tested the consequences of environmental circadian misalignment on β-cell function. We demonstrate that a shift work-simulating paradigm is sufficient to induce β-cell dysfunction. Increased postprandial hyperglycemia and insulin resistance with insufficient β-cell compensation in healthy control human subjects subjected to acute circadian misalignment was recently reported (2) and was significantly worsened by superimposed sleep deprivation (49). Gale et al. reported a decrease in insulin secretion and β-cell apoptosis only in diabetes-prone human islet amyloid polypeptide transgenic rats, but not in wild-type controls, subjected to CD (50). Though their primary conclusion is consistent with our study, the lack of β-cell dysfunction in control rats could have occurred because of a difference in experimental design. CD was induced by alternating phase delay and phase advance to simulate shift work in our study, while Gale et al. used a phase advance-only paradigm to simulate chronic jet lag. One striking feature of our study is that both genetic and environment-induced CDs result in similar losses of the glucose-stimulated change in mitochondrial ψ and rises in the ATP/ADP ratio in isolated islets, suggesting similar underlying dysregulated mechanisms.
In summary, genetic disruption of the β-cell clock and environmental CD are both sufficient to induce β-cell dysfunction, with impairment of GSIS coupling at the mitochondrial level. We identify dysregulation of antioxidant genes as central to oxidative stress-induced GSIS impairment. Identification of underlying regulatory pathways with CD-induced metabolic abnormalities lends them to therapeutic targeting to preserve β-cell function in the prevention and treatment of diabetes.
ACKNOWLEDGMENTS
This work was supported by grant R56 DK089061-01 and a P&F grant (DRC-P30DK079638) from the NIH, American Diabetes Association grant 7-12-BS-210, the Caroline Wiess Law Fund for Molecular Medicine, and a P&F grant from BCM Huffington Center On Aging and the Alkek Foundation to V.K.Y. It was also supported by grants to K.M. from the American Diabetes Association (1-13-BS-118), to Y.X. from the NIH (R01DK093587, R00DK085330, and P30 DK079638-03), the American Diabetes Association, the Klarman Family Foundation, the Naman Family Fund for Basic Research, and the Curtis Hankamer Basic Research Fund, and to M.M. from NIH (K08HL091176).
We thank Agnes Liang and Luge Li for technical assistance. We also thank the Mouse Metabolism Core of the Diabetes Research Center at the Baylor college of Medicine (DRC-P30DK079638).
There are no potential conflicts of interest.
Footnotes
Published ahead of print 1 April 2013
REFERENCES
- 1. Kroenke CH, Spiegelman D, Manson J, Schernhammer ES, Colditz GA, Kawachi I. 2007. Work characteristics and incidence of type 2 diabetes in women. Am. J. Epidemiol. 165:175–183 [DOI] [PubMed] [Google Scholar]
- 2. Scheer FA, Hilton MF, Mantzoros CS, Shea SA. 2009. Adverse metabolic and cardiovascular consequences of circadian misalignment. Proc. Natl. Acad. Sci. U. S. A. 106:4453–4458 [DOI] [PMC free article] [PubMed] [Google Scholar]
- 3. Pan A, Schernhammer ES, Sun Q, Hu FB. 2011. Rotating night shift work and risk of type 2 diabetes: two prospective cohort studies in women. PLoS Med. 8:e1001141 doi:10.1371/journal.pmed.1001141 [DOI] [PMC free article] [PubMed] [Google Scholar]
- 4. Kivimaki M, Batty GD, Hublin C. 2011. Shift work as a risk factor for future type 2 diabetes: evidence, mechanisms, implications, and future research directions. PLoS Med. 8:e1001138 doi:10.1371/journal.pmed.1001138 [DOI] [PMC free article] [PubMed] [Google Scholar]
- 5. Green CB, Takahashi JS, Bass J. 2008. The meter of metabolism. Cell 134:728–742 [DOI] [PMC free article] [PubMed] [Google Scholar]
- 6. Dibner C, Schibler U, Albrecht U. 2010. The mammalian circadian timing system: organization and coordination of central and peripheral clocks. Annu. Rev. Physiol. 72:517–549 [DOI] [PubMed] [Google Scholar]
- 7. Kornmann B, Schaad O, Bujard H, Takahashi JS, Schibler U. 2007. System-driven and oscillator-dependent circadian transcription in mice with a conditionally active liver clock. PLoS Biol. 5:e34 doi:10.1371/journal.pbio.0050034 [DOI] [PMC free article] [PubMed] [Google Scholar]
- 8. Damiola F, Le MN, Preitner N, Kornmann B, Fleury-Olela F, Schibler U. 2000. Restricted feeding uncouples circadian oscillators in peripheral tissues from the central pacemaker in the suprachiasmatic nucleus. Genes Dev. 14:2950–2961 [DOI] [PMC free article] [PubMed] [Google Scholar]
- 9. Stokkan KA, Yamazaki S, Tei H, Sakaki Y, Menaker M. 2001. Entrainment of the circadian clock in the liver by feeding. Science 291:490–493 [DOI] [PubMed] [Google Scholar]
- 10. Bellet MM, Sassone-Corsi P. 2010. Mammalian circadian clock and metabolism—the epigenetic link. J. Cell Sci. 123:3837–3848 [DOI] [PMC free article] [PubMed] [Google Scholar]
- 11. Rudic RD, McNamara P, Curtis AM, Boston RC, Panda S, Hogenesch JB, FitzGerald GA. 2004. BMAL1 and CLOCK, two essential components of the circadian clock, are involved in glucose homeostasis. PLoS Biol. 2:e377 doi:10.1371/journal.pbio.0020377 [DOI] [PMC free article] [PubMed] [Google Scholar]
- 12. Lamia KA, Storch KF, Weitz CJ. 2008. Physiological significance of a peripheral tissue circadian clock. Proc. Natl. Acad. Sci. U. S. A. 105:15172–15177 [DOI] [PMC free article] [PubMed] [Google Scholar]
- 13. Marcheva B, Ramsey KM, Buhr ED, Kobayashi Y, Su H, Ko CH, Ivanova G, Omura C, Mo S, Vitaterna MH, Lopez JP, Philipson LH, Bradfield CA, Crosby SD, JeBailey L, Wang X, Takahashi JS, Bass J. 2010. Disruption of the clock components CLOCK and BMAL1 leads to hypoinsulinaemia and diabetes. Nature 466:627–631 [DOI] [PMC free article] [PubMed] [Google Scholar]
- 14. Lee J, Kim MS, Li R, Liu VY, Fu L, Moore DD, Ma K, Yechoor VK. 2011. Loss of Bmal1 leads to uncoupling and impaired glucose-stimulated insulin secretion in beta cells. Islets 3:381–388 [DOI] [PMC free article] [PubMed] [Google Scholar]
- 15. Sadacca LA, Lamia KA, Delemos AS, Blum B, Weitz CJ. 2011. An intrinsic circadian clock of the pancreas is required for normal insulin release and glucose homeostasis in mice. Diabetologia 54:120–124 [DOI] [PMC free article] [PubMed] [Google Scholar]
- 16. Yechoor V, Liu V, Espiritu C, Paul A, Oka K, Kojima H, Chan L. 2009. Neurogenin3 is sufficient for transdetermination of hepatic progenitor cells into neo-islets in vivo but not transdifferentiation of hepatocytes. Dev. Cell 16:358–373 [DOI] [PMC free article] [PubMed] [Google Scholar]
- 17. Vandesompele J, De PK, Pattyn F, Poppe B, Van RN, De PA, Speleman F. 2002. Accurate normalization of real-time quantitative RT-PCR data by geometric averaging of multiple internal control genes. Genome Biol. 3:RESEARCH0034 [DOI] [PMC free article] [PubMed] [Google Scholar]
- 18. Balsalobre A, Damiola F, Schibler U. 1998. A serum shock induces circadian gene expression in mammalian tissue culture cells. Cell 93:929–937 [DOI] [PubMed] [Google Scholar]
- 19. Carlsson C, Borg LA, Welsh N. 1999. Sodium palmitate induces partial mitochondrial uncoupling and reactive oxygen species in rat pancreatic islets in vitro. Endocrinology 140:3422–3428 [DOI] [PubMed] [Google Scholar]
- 20. Storch KF, Paz C, Signorovitch J, Raviola E, Pawlyk B, Li T, Weitz CJ. 2007. Intrinsic circadian clock of the mammalian retina: importance for retinal processing of visual information. Cell 130:730–741 [DOI] [PMC free article] [PubMed] [Google Scholar]
- 21. Wicksteed B, Brissova M, Yan W, Opland DM, Plank JL, Reinert RB, Dickson LM, Tamarina NA, Philipson LH, Shostak A, Bernal-Mizrachi E, Elghazi L, Roe MW, Labosky PA, Myers MG, Jr, Gannon M, Powers AC, Dempsey PJ. 2010. Conditional gene targeting in mouse pancreatic ss cells: analysis of ectopic Cre transgene expression in the brain. Diabetes 59:3090–3098 [DOI] [PMC free article] [PubMed] [Google Scholar]
- 22. Zhang CY, Parton LE, Ye CP, Krauss S, Shen R, Lin CT, Porco JA, Jr, Lowell BB. 2006. Genipin inhibits UCP2-mediated proton leak and acutely reverses obesity- and high glucose-induced beta cell dysfunction in isolated pancreatic islets. Cell Metab. 3:417–427 [DOI] [PubMed] [Google Scholar]
- 23. Li LX, Skorpen F, Egeberg K, Jorgensen IH, Grill V. 2001. Uncoupling protein-2 participates in cellular defense against oxidative stress in clonal beta cells. Biochem. Biophys. Res. Commun. 282:273–277 [DOI] [PubMed] [Google Scholar]
- 24. Pi J, Collins S. 2010. Reactive oxygen species and uncoupling protein 2 in pancreatic beta-cell function. Diabetes Obes. Metab. 12(Suppl. 2):141–148 [DOI] [PubMed] [Google Scholar]
- 25. Mailloux RJ, Harper ME. 2011. Uncoupling proteins and the control of mitochondrial reactive oxygen species production. Free Radic. Biol. Med. 51:1106–1115 [DOI] [PubMed] [Google Scholar]
- 26. Kondratov RV, Kondratova AA, Gorbacheva VY, Vykhovanets OV, Antoch MP. 2006. Early aging and age-related pathologies in mice deficient in BMAL1, the core component of the circadian clock. Genes Dev. 20:1868–1873 [DOI] [PMC free article] [PubMed] [Google Scholar]
- 27. Asher G, Schibler U. 2011. Crosstalk between components of circadian and metabolic cycles in mammals. Cell Metab. 13:125–137 [DOI] [PubMed] [Google Scholar]
- 28. Allaman-Pillet N, Roduit R, Oberson A, Abdelli S, Ruiz J, Beckmann JS, Schorderet DF, Bonny C. 2004. Circadian regulation of islet genes involved in insulin production and secretion. Mol. Cell. Endocrinol. 226:59–66 [DOI] [PubMed] [Google Scholar]
- 29. Bunger MK, Wilsbacher LD, Moran SM, Clendenin C, Radcliffe LA, Hogenesch JB, Simon MC, Takahashi JS, Bradfield CA. 2000. Mop3 is an essential component of the master circadian pacemaker in mammals. Cell 103:1009–1017 [DOI] [PMC free article] [PubMed] [Google Scholar]
- 30. Kawai K, Yokota C, Ohashi S, Watanabe Y, Yamashita K. 1995. Evidence that glucagon stimulates insulin secretion through its own receptor in rats. Diabetologia 38:274–276 [DOI] [PubMed] [Google Scholar]
- 31. Daunt M, Dale O, Smith PA. 2006. Somatostatin inhibits oxidative respiration in pancreatic beta cells. Endocrinology 147:1527–1535 [DOI] [PubMed] [Google Scholar]
- 32. Atiya AW, Moldovan S, Adrian TE, Coy D, Walsh J, Brunicardi FC. 1997. Intraislet somatostatin inhibits insulin (via a subtype-2 somatostatin receptor) but not islet amyloid polypeptide secretion in the isolated perfused human pancreas. J. Gastrointest. Surg. 1:251–256 [DOI] [PubMed] [Google Scholar]
- 33. Chan CB, Kashemsant N. 2006. Regulation of insulin secretion by uncoupling protein. Biochem. Soc. Trans. 34:802–805 [DOI] [PubMed] [Google Scholar]
- 34. Poitout V, Robertson RP. 2008. Glucolipotoxicity: fuel excess and beta-cell dysfunction. Endocr. Rev. 29:351–366 [DOI] [PMC free article] [PubMed] [Google Scholar]
- 35. Chan CB, MacDonald PE, Saleh MC, Johns DC, Marban E, Wheeler MB. 1999. Overexpression of uncoupling protein 2 inhibits glucose-stimulated insulin secretion from rat islets. Diabetes 48:1482–1486 [DOI] [PubMed] [Google Scholar]
- 36. Chan CB, De LD, Joseph JW, McQuaid TS, Ha XF, Xu F, Tsushima RG, Pennefather PS, Salapatek AM, Wheeler MB. 2001. Increased uncoupling protein-2 levels in beta cells are associated with impaired glucose-stimulated insulin secretion: mechanism of action. Diabetes 50:1302–1310 [DOI] [PubMed] [Google Scholar]
- 37. Joseph JW, Koshkin V, Saleh MC, Sivitz WI, Zhang CY, Lowell BB, Chan CB, Wheeler MB. 2004. Free fatty acid-induced beta-cell defects are dependent on uncoupling protein 2 expression. J. Biol. Chem. 279:51049–51056 [DOI] [PubMed] [Google Scholar]
- 38. Joseph JW, Koshkin V, Zhang CY, Wang J, Lowell BB, Chan CB, Wheeler MB. 2002. Uncoupling protein 2 knockout mice have enhanced insulin secretory capacity after a high-fat diet. Diabetes 51:3211–3219 [DOI] [PubMed] [Google Scholar]
- 39. Zhang CY, Baffy G, Perret P, Krauss S, Peroni O, Grujic D, Hagen T, Vidal-Puig AJ, Boss O, Kim YB, Zheng XX, Wheeler MB, Shulman GI, Chan CB, Lowell BB. 2001. Uncoupling protein-2 negatively regulates insulin secretion and is a major link between obesity, beta cell dysfunction, and type 2 diabetes. Cell 105:745–755 [DOI] [PubMed] [Google Scholar]
- 40. Acharya JD, Ghaskadbi SS. 2010. Islets and their antioxidant defense. Islets 2:225–235 [DOI] [PubMed] [Google Scholar]
- 41. Robertson RP. 2006. Oxidative stress and impaired insulin secretion in type 2 diabetes. Curr. Opin. Pharmacol. 6:615–619 [DOI] [PubMed] [Google Scholar]
- 42. Kaneto H, Kawamori D, Matsuoka TA, Kajimoto Y, Yamasaki Y. 2005. Oxidative stress and pancreatic beta-cell dysfunction. Am. J. Ther. 12:529–533 [DOI] [PubMed] [Google Scholar]
- 43. Lenzen S, Drinkgern J, Tiedge M. 1996. Low antioxidant enzyme gene expression in pancreatic islets compared with various other mouse tissues. Free Radic. Biol. Med. 20:463–466 [DOI] [PubMed] [Google Scholar]
- 44. Panda S, Antoch MP, Miller BH, Su AI, Schook AB, Straume M, Schultz PG, Kay SA, Takahashi JS, Hogenesch JB. 2002. Coordinated transcription of key pathways in the mouse by the circadian clock. Cell 109:307–320 [DOI] [PubMed] [Google Scholar]
- 45. Xu YQ, Zhang D, Jin T, Cai DJ, Wu Q, Lu Y, Liu J, Klaassen CD. 2012. Diurnal variation of hepatic antioxidant gene expression in mice. PLoS One 7:e44237 doi:10.1371/journal.pone.0044237 [DOI] [PMC free article] [PubMed] [Google Scholar]
- 46. Wolf G, Aumann N, Michalska M, Bast A, Sonnemann J, Beck JF, Lendeckel U, Newsholme P, Walther R. 2010. Peroxiredoxin III protects pancreatic ss cells from apoptosis. J. Endocrinol. 207:163–175 [DOI] [PubMed] [Google Scholar]
- 47. Tran PO, Parker SM, LeRoy E, Franklin CC, Kavanagh TJ, Zhang T, Zhou H, Vliet P, Oseid E, Harmon JS, Robertson RP. 2004. Adenoviral overexpression of the glutamylcysteine ligase catalytic subunit protects pancreatic islets against oxidative stress. J. Biol. Chem. 279:53988–53993 [DOI] [PubMed] [Google Scholar]
- 48. Kondratov RV, Vykhovanets O, Kondratova AA, Antoch MP. 2009. Antioxidant N-acetyl-l-cysteine ameliorates symptoms of premature aging associated with the deficiency of the circadian protein BMAL1. Aging (Albany NY) 1:979–987 [DOI] [PMC free article] [PubMed] [Google Scholar]
- 49. Buxton OM, Cain SW, O'Connor SP, Porter JH, Duffy JF, Wang W, Czeisler CA, Shea SA. 2012. Adverse metabolic consequences in humans of prolonged sleep restriction combined with circadian disruption. Sci. Transl. Med. 4:129ra43. [DOI] [PMC free article] [PubMed] [Google Scholar]
- 50. Gale JE, Cox HI, Qian J, Block GD, Colwell CS, Matveyenko AV. 2011. Disruption of circadian rhythms accelerates development of diabetes through pancreatic beta-cell loss and dysfunction. J. Biol. Rhythms 26:423–433 [DOI] [PMC free article] [PubMed] [Google Scholar]


