

Abstract
MEK1/2 inhibitors such as AZD6244 are in clinical trials for the treatment of multiple cancers, including breast cancer. Targeted kinase inhibition can induce compensatory kinome changes, rendering single therapeutic agents ineffective. To identify target proteins to be used in a combinatorial approach to inhibit tumor cell growth, we used a novel strategy that identified microRNAs (miRNAs) that synergized with AZD6244 to inhibit the viability of the claudin-low breast cancer cell line MDA-MB-231. Screening of a miRNA mimic library revealed the ability of miR-9-3p to significantly enhance AZD6244-induced extracellular signal-regulated kinase inhibition and growth arrest, while miR-9-3p had little effect on growth alone. Promoter methylation of mir-9 genes correlated with low expression of miR-9-3p in different breast cancer cell lines. Consistent with miR-9-3p having synthetic enhancer tumor suppressor characteristics, miR-9-3p expression in combination with MEK inhibitor caused a sustained loss of c-MYC expression and growth inhibition. The β1 integrin gene (ITGB1) was identified as a new miR-9-3p target, and the growth inhibition seen with small interfering RNA knockdown or antibody blocking of ITGB1 in combination with MEK inhibitor phenocopied the growth inhibition seen with miR-9-3p plus AZD6244. The miRNA screen led to identification of a druggable protein, ITGB1, whose functional inhibition synergizes with MEK inhibitor.
INTRODUCTION
The continued interest in kinases as cancer therapeutic targets is demonstrated by the more than 130 kinase-directed inhibitors currently in clinical trials. Despite inhibitor-specific targeting of dysregulated kinases in different cancers, this approach has yielded only limited success due to the development of therapeutic resistance. In addition to somatic mutation and modulation of kinase expression, cancer cells readily exploit alternate kinase networks to bypass targeted kinase inhibition (1, 2). Receptor tyrosine kinase (RTK) upregulation and activation is one mechanism of acquired resistance. In melanoma, BRAF inhibition drives upregulation of the RTKs platelet-derived growth factor receptor β (PDGFRβ) and insulin-like growth factor 1 receptor (IGF1R) (3), while in glioblastoma, the activation of MET and PDGFRβ can circumvent epidermal growth factor receptor inhibition (4). Understanding inhibitor-driven reprogramming of kinase networks will be required to effectively design combination kinase inhibitor therapies to target cancer subtypes.
The claudin-low breast cancer subtype represents 20 to 30% of triple-negative breast cancer (TNBC) cases and 10% of all breast cancer cases and is characterized by low expression of the claudin genes and other junctional proteins, including E-cadherin (5). Although claudin-low tumors share basal-like features, they are distinct in that they possess stem cell characteristics with high expression of mesenchymal and epithelial-mesenchymal transition (EMT) genes and are thought to be reflective of the least-differentiated stage of epithelial development (6). Claudin-low characteristics are also common in chemotherapy-resistant breast tumors.
Synthetic lethal screens using RNA interference (RNAi) in the context of tumor-suppressive or oncogenic mutations have proven to be successful in identifying previously unknown gene interactions controlling the cancer cell phenotype (7, 8). Additionally, RNAi screens have uncovered synthetic interactions in the context of pharmacological kinase inhibition, which has the potential to facilitate the design of effective combination therapies.
We therefore sought to identify microRNAs (miRNAs) that synergized with pharmacological MEK1/2 inhibition in claudin-low TNBC cells with the rationale that the claudin-low phenotype is the most difficult to treat, with few oncoproteins for molecular targeting with currently developed inhibitors identified. miRNAs conferring synthetic enhancement of MEK1/2 inhibition provided identification of miRNA target genes that could be pharmacologically inhibited. Herein we report the ability of miR-9-3p to attenuate cell proliferation in the presence of MEK inhibition. We identify the β1 integrin gene (ITGB1) to be a novel target of miR-9-3p and demonstrate that loss of c-MYC expression contributes to the synthetic enhancement seen with this miRNA in combination with MEK1/2 inhibitor.
MATERIALS AND METHODS
Cell culture.
MDA-MB-231 cells were maintained in Iscove's modified Dulbecco's medium (Life Technologies, Carlsbad, CA) with 10% fetal bovine serum (FBS) and an antibacterial-antimycotic cocktail (Gemini Bio-Products, West Sacramento, CA). SUM159PT cells were maintained in F-12 medium (Life Technologies) with 5% FBS, 5 μg/ml insulin, 1 μg/ml hydrocortisone, and an antibacterial-antimycotic cocktail.
Drugs.
AZD6244 (selumetinib) was obtained from LC Laboratories (Woburn, MA), and GSK1120212 (trametinib) was obtained from Selleck Chemicals (Houston, TX). Drugs were added to cells during plating and not replenished.
Reverse transfection.
For all studies, 25 nM (final concentration) small interfering RNA (siRNA; SMARTpool or individual) or miRNA mimic (Thermo Fisher Scientific Dharmacon, Lafayette, CO) was complexed with the DharmaFECT 1 reagent (1.0 μl/ml for MDA-MB-231 cells and 0.75 μl/ml for SUM159PT cells; Thermo Fisher Scientific Dharmacon) for 30 min, followed by addition of cells in complete medium. Dharmacon miRIDIAN mimic negative control 1 (CN-001000-01-05) and siGENOME control pool nontargeting 2 (D-001206-14-05) were used as controls. The following individual MYC siRNAs were used: (i) Dharmacon D-003282-16, (ii) D-003282-14, and (iii) D-003282-35.
Primary screen.
Beckman Coulter (Indianapolis, IN) Biomek FXP automation was used to dispense miRNA mimic representing a Dharmacon miRIDIAN human mimic microRNA library (CS-001010; lot 10100; miRBase, release 13) into 384-well (μClear; Greiner Bio-One, Monroe, NC) daughter plates in triplicate. Columns 1, 23, and 24 of the 384-well plates did not contain miRNA for baseline controls. A MicroFlo Select instrument (BioTek Instruments, Winooski, VT) was used to dispense medium to form miRNA/DharmaFECT 1 complexes in a 10-μl volume per well. Complexes formed for 30 min, followed by addition of a 40-μl/well MDA-MB-231 cell suspension containing AZD6244 or dimethyl sulfoxide (DMSO) vehicle control, resulting in a final volume of 50 μl per well and 1.5 μM AZD6244. Cells were incubated for 96 h, followed by the addition of 7 μl CellTiter-Glo reagent (Promega, Madison, WI) per well. Luminescence was assessed using a PHERAstar FS plate reader (BMG Labtech, Cary, NC).
Data analysis.
Row median values were determined by dividing the raw luminescence value of the well by the median luminescence value of the corresponding row from columns 3 to 22. The mean row median value of the three replicate wells was then calculated, followed by determination of the ratio of the mean row median value for DMSO treatment to the mean row median value for AZD6244 treatment. Wells with DMSO/AZD6244 mean row median values of >1 were defined as synthetic enhancer wells; values of <1 indicated synthetic recovery.
Quantitative RT-PCR.
RNA was purified from all cell lines using a Qiagen (Valencia, CA) miRNeasy kit. Fifty nanograms of RNA was used for reverse transcription (RT) using TaqMan microRNA assay (Applied Biosystems, Foster City, CA) primers specific for hsa-miR-9-3p (hereafter called miR-9-3p) or U6 snRNA. A total of 1.33 μl of each 15-μl RT reaction mixture was used for quantitative PCRs using a 7500 real-time RT-PCR system (Applied Biosystems).
DNA methylation assays.
For methyltransferase inhibitor experiments, cells were treated with 5 μM 5-aza-2′-deoxycytidine (5AZA; Sigma, St. Louis, MO) or DMSO vehicle control for 48 h. For combined bisulfite restriction analysis (COBRA), genomic DNA was isolated using a Qiagen DNeasy blood and tissue kit and bisulfite treated using an EZ DNA methylation gold kit (Zymo Research, Irvine, CA). The following primers were used for CpG island PCR amplification of bisulfite-treated DNA, as originally described in reference 9: for the mir-9-1 248-bp amplicon, GATTTAGGTAGAGGTTTTTTTAGTTT and TTAACTACCCATTTCCCCTTTTAAT; for the mir-9-2 181-bp amplicon, ATGTTAGGAAAATAAAGTTGGGGTT and CCCCTCCTCTAAAACAACTAAAAA; and for the mir-9-3 220-bp amplicon, GTTTGTTTATTTTTTTTGGTTTTT and AAATTATAAAAATCATTTCTACTTTC.
Amplicons were digested with BstUI (mir-9-1 and mir-9-3) or TaqαI (mir-9-2) (New England BioLabs, Ipswich, MA) and run on 2% agarose gels with undigested product.
ChIP-PCR.
SUM149 or MDA-MB-231 cells were fixed for 10 min in 1% formaldehyde, sonicated (VCX130 ultrasonicator; Sonics, Newtown, CT), and immunoprecipitated with 5 μg H3K9me3 (Abcam 8898) or H3K27me3 (6002; Abcam) antibody and protein A Dynabeads (Life Technologies). Cross-linking was reversed by incubation at 65°C overnight, and DNA was purified using a MinElute PCR purification kit (Qiagen). The following primer pairs, designed to yield ∼100-bp amplicons within 500 bp of the 5′ sequence flanking each hairpin, were used for ChIP real-time PCR: for mir-9-1, GTCCTTTCCACGCCTTTTTC and CGTCAGCGGGAGTAGGAG; for mir-9-2, TAACGCTGCCGGAGATTACT and TACTTGCCGCGCTTAAGATT; for mir-9-3, CATTGTAAGGCTGGGTGGTG and CCTCCTCTCGCAGGCTAATC; and for EEF1A1, CGTCATCACTGAGGTGGAGA and GGAGCCAGTACACGACATCA.
Chromatin immunoprecipitation (ChIP)–real-time PCR was performed using Absolute Blue SYBR green PCR mix (Thermo Fisher Scientific, Waltham, MA) and a Fast 7500 real-time PCR system (Applied Biosystems). Fold enrichment was calculated by the 2−ΔΔCT method.
Flow cytometry.
SUM159PT cells were reversed transfected with either control miRNA mimic/miR-9-3p mimic or control siRNA/ITGB1 siRNA and concurrently treated with 250 nM AZD6244 for 96 h. For each condition, 5.0 × 10⁵ cells were rinsed once with phosphate-buffered saline (PBS), centrifuged at 1,000 rpm for 5 min, and resuspended in 0.5 ml PBS. The cell suspension was then added to 4.5 ml 70% ethanol and incubated at −20°C overnight. The cells were then centrifuged at 1,000 rpm for 5 min, rinsed once with PBS, and then incubated in 1 ml propidium iodide staining solution (0.1% Triton X-100, 200 μg/ml RNase A [Sigma], 20 μg/ml propidium iodide [Sigma]) at room temperature for 30 min. Stained cells were kept at 4°C until analyzed in a Beckman Coulter CyAn ADP flow cytometer. Cell cycle stage quantification from 1.0 × 10⁴ analyzed cells and plots were generated using ModFitLT v3.2.1 software (Verity Software House).
Time-lapse imaging.
MDA-MB-231 or SUM159PT cells were reverse transfected in 35-mm glass-bottom culture dishes (MatTek Corporation, Ashland, MA) or treated with 2.5 μg/ml monoclonal antibody AIIB2 (Developmental Studies Hybridoma Bank, University of Iowa) or normal rat IgG lacking azide (Santa Cruz Biotechnology, Santa Cruz, CA). Cells were treated with 500 nM (MDA-MB-231) or 250 nM (SUM159PT) AZD6244 or DMSO vehicle control. Differential interference contrast (DIC) imaging was started at 24 h posttransfection in an Olympus VivaView FL LCV110 CO2 incubator microscope, using ×20 magnification and 1-by-1 binning with 10- or 20-min intervals for 30 to 60 h. Images were assembled into stacks and contrast adjusted using ImageJ v1.45s software.
Immunoblots and antibodies.
Cells were lysed in 20 mM Tris-HCl (pH 8.0), 1% NP-40, 10% glycerol, 137 mM NaCl, 2 mM EDTA, protease inhibitor cocktail tablet (Roche, Basal, Switzerland), and 1% phosphatase inhibitor cocktails 1 and 3 (Sigma) and cleared by centrifugation. The following antibodies were used: extracellular signal-regulated kinase 2 (ERK2) C14 (Santa Cruz Biotechnology), BIM 17003 (EMD Millipore Chemicon, Billerica, MA), and phospho-ERK1/2 4370, ITGB1 4706, c-MYC 5605, PDGFRB 3169, and DDR1 5583 (Cell Signaling Technology, Danvers, MA).
Migration and invasion assays.
Cells were reverse transfected and grown for 48 h posttransfection in the presence of 500 nM (MDA-MB-231 cells) or 250 nM (SUM159PT cells) AZD6244. For migration assays, 5.0 × 10⁴ MDA-MB-231 or 4.0 × 10⁴ SUM159PT cells were plated in Transwells with an 8-μm pore size (Costar 3422; Corning) and drug- or DMSO-containing medium in both chambers. After 24 h, cells were fixed and stained with DAPI (4′,6-diamidino-2-phenylindole). Five fields per membrane were imaged at ×10 magnification, followed by intensity masking and counting of nuclei using SlideBook software (Intelligent Imaging Innovations, Inc., Denver, CO). Invasion assays were performed as described above using 8-μm-pore-size Matrigel Transwells (354483; BD Biosciences) and 5.0 × 10⁴ MDA-MB-231 or SUM159PT cells per Transwell. For assays using blocking antibody, cells were pretreated with 2.5 μg/ml AIIB2 or control rat IgG for 48 h in the presence of DMSO or AZD6244 at the concentrations listed above. Cells (4.0 × 10⁴) were then seeded in Transwells containing 2.5 μg/ml AIIB2, and the assays were performed as described above.
3′ UTR/miRNA luciferase reporter assays.
Firefly/Renilla reporter plasmid pEZX-MT01 harboring the human ITGB1 3′ untranslated region (UTR; clone HmiT009810-MT01) and Luc-Pair miR luciferase assay reagents were obtained from GeneCopoeia (Rockville, MD). Five thousand MDA-MB-231 cells were transfected with 100 ng plasmid and 100 nM miRNA mimic per well in 96-well μClear plates using 0.4 μl DharmaFECT Duo reagent (Thermo Fisher Scientific Dharmacon). For creation of the mutant pEZX-MTO1 construct, the ITGB1 3′ UTR insert from the wild-type construct was synthesized (Genewiz, South Plainfield, NJ) with mutations at three putative miR-9-3p binding sites and cloned into pEZX-MT01 as an EcoRI/XhoI fragment. The miR-9-3p binding site mutations were created by changing the ITGB1 3′ UTR sequence at miRNA seed positions m2, m3, and m8 from AGCUUUA (wild type) to CGCUUCC (mutant). Luminescence was assessed at 48 h posttransfection.
RESULTS
miR-9-3p is a sensitizer of MEK inhibitor-induced growth arrest.
To identify miRNAs that reduced cell proliferation/viability in the presence of MEK inhibition, we screened miRNA mimics representing 878 human miRNAs. MDA-MB-231 claudin-low breast cancer cells were used in the primary screen because of their sensitivity to MEK inhibitor-induced growth arrest (10, 11). The highly specific, allosteric MEK inhibitor AZD6244 (12), currently in clinical trials for the treatment of several cancers, including breast cancer, was utilized for MEK inhibition. A dose of 1.5 μM AZD6244 reduced MDA-MB-231 cell proliferation/viability by ∼25%, allowing a dynamic range sufficient to detect synthetic enhancer interactions upon miRNA mimic transfection. A row median metric comparing the value for each well to the median luminescence value for the given microplate row was then used to score cell viability following the CellTiter-Glo (Promega) luminescence-based assay dependent on the cellular ATP concentration. Heat maps depict the reproducibility of the assay across triplicate microplates (Fig. 1A).
Fig 1.

miR-9-3p is a synthetic enhancer of MEK inhibition in MDA-MB-231 cells. (A) Heat maps (MARS software; BMG LabTech) depicting the reproducibility between triplicate microplates of the primary screen for one daughter plate of a Dharmacon human miRIDIAN microRNA mimic library. Color bar scales for replicate DMSO- and AZD6244-treated plates represent raw luminescence counts from the CellTiter-Glo (Promega) growth inhibition/viability assay, dependent on cellular ATP concentration. (B) Scatter plot showing the distribution of primary synthetic enhancer screen. DMSO/AZD6244 row median ratios of >1.0 indicate synthetic enhancement, while ratios of <1.0 represent synthetic recovery. The five highest-ranking synthetic enhancer miRNA mimics are indicated, and the screen position of miR-9-5p (arrow) is shown to contrast its opposing effect on cell proliferation compared to that of its counterpart strand, miR-9-3p. (C) Distribution of the primary screen plotted as a spectrum of decreasing synthetic enhancement to increasing synthetic growth rescue. The rankings of miR-9-3p and miR-9-5p are indicated by arrows. (D) CellTiter-Glo assay from the primary screen showing miR-9-3p/AZD6244 synthetic enhancement and the opposite growth phenotypes of miR-9-3p and miR-9-5p mimics. Error bars represent SEMs of triplicate microplate wells. (E) Immunoblot showing the miR-9-3p-mediated reduction or miR-9-5p-mediated increase of phospho-ERK1/2 in the presence of 1.5 μM AZD6244 in MDA-MB-231 cells. (F) MDA-MB-231 or SUM159PT immunoblots showing a loss of c-MYC upon 48 h of 10 nM GSK1120212 treatment. (G) Immunoblots showing a sustained loss of c-MYC upon 96 h of miR-9-3p and AZD6244 dual treatment in MDA-MB-231 or SUM159PT cells. MDA-MB-231 cells were treated with 500 nM AZD6244, and SUM159PT cells were treated with 250 nM AZD6244. (H) MDA-MB-231 hemocytometer cell counts following transfection with control siRNA or three individual c-MYC siRNAs in the presence or absence of 500 nM AZD6244. Error bars represent SEMs of three experiments. *, P < 0.05 between control siRNA in the presence of AZD6244 and each individual MYC siRNA in the presence of AZD6244. Loading controls for all immunoblots were ERK2 and actin.
We ranked the miRNA mimics in terms of their degree of synthetic enhancement with MEK inhibition by comparing the row median score between the DMSO vehicle-treated condition and the AZD6244-treated condition. Wells with the highest DMSO/AZD6244 row median luminescence ratios represented synthetic enhancer hits (see Table 1 for the top 10 hits). Figures 1B and C show the distribution of miRNAs according to synthetic enhancement (see Dataset S1 in the supplemental material for complete screen rankings and raw data). We initially utilized bioinformatics algorithms to predict candidate target mRNAs for the top five synthetic enhancer miRNA hits (miR-205-3p, miR-9-3p, miR-548k, miR-432-3p, miR-613). Our criteria involved (i) prediction of target miRNAs by two different algorithms among the MicroCosm Targets (13), microRNA.org (14), PicTar (15), and TargetScan (16) algorithms and (ii) the need for target mRNA to encode a protein that could be inhibited pharmacologically with available small molecules or biologicals and to rank within the top 20 targets predicted by each algorithm. The rationale for these criteria was the ability to rapidly screen inhibitors to mimic the phenotypes observed with the miRNA in combination with MEK inhibitor. There was a lack of obvious druggable target molecules predicted for miR-205-3p, miR-548k, miR-432-3p, and miR-613 (Table 2). We therefore focused efforts on miR-9-3p (miR-9*), as it was predicted to target β1 integrin (ITGB1), a protein for which function-blocking antibodies are available and that is well established to be important for growth factor receptor and extracellular matrix-regulated signaling (17).
Table 1.
miRNAs yielding synthetic enhancer interaction with MEK inhibition
| miRNA | Ranking | DMSO/AZD6244 avg row median ratio |
|---|---|---|
| hsa-miR-205-3p | 1/878 | 1.811 |
| hsa-miR-9-3p | 2/878 | 1.711 |
| hsa-miR-548k | 3/878 | 1.704 |
| hsa-miR-432-3p | 4/878 | 1.687 |
| hsa-miR-613 | 5/878 | 1.565 |
| hsa-miR-520d-5p | 6/878 | 1.475 |
| hsa-miR-101-5p | 7/878 | 1.471 |
| hsa-miR-532-5p | 8/878 | 1.448 |
| hsa-miR-1208 | 9/878 | 1.433 |
| hsa-miR-497 | 10/878 | 1.426 |
| hsa-miR-9-5p | 805/878 | 0.869 |
Table 2.
Top 20 target predictions for five highest-ranking synthetic enhancer microRNAs from primary screen
| Target prediction rank | Target predictiona |
|||||||||
|---|---|---|---|---|---|---|---|---|---|---|
| miR-9-3p |
miR-205-3p |
miR-548k |
miR-432-3p |
miR-613 |
||||||
| MicroCosm | microRNA.org | PicTar | microRNA.org | TargetScan | microRNA.org | MicroCosm | microRNA.org | MicroCosm | microRNA.org | |
| 1 | TCEA1P2 | TSNAX | PNUTL2 | CEP350 | MAP9 | FNDC3B | FAM169B | GSG1L | NR1H3 | TMTC3 |
| 2 | DPYSL3 | PPM1A | CDK11 | CSGALNACT2 | LIN7C | BRD1 | GSG1L | FAM169B | WDR61 | SUSD1 |
| 3 | CETN3 | ZNF292 | CLK3 | C11orf73 | GULP1 | SKIL | TLK2 | TMCO4 | NP_612412.2 | GJA1 |
| 4 | LRRTM1 | LOC641367 | CDH11 | RBMS1 | FNDC3B | ARID4B | TM9SF3 | LAMC2 | SH3BGRL3 | YLPM1 |
| 5 | RNASE6 | CCNYL1 | RAB11FIP1 | DMRT1 | KITLG | ZNF611 | LYST | TXNDC2 | STRAD_HUMAN | SLC44A1 |
| 6 | NFATC3 | HIAT1 | PHB | TMEM188 | BRD1 | MYST3 | PRKCA | HOXD10 | SOX30 | BDNF |
| 7 | MTBP | ITGB1 | FLJ32096 | EXOC8 | SUV420H1 | RIMS1 | ATL2 | MEIS3 | TRAPPC4 | PTPLAD1 |
| 8 | NP_056996.2 | GABRA1 | CHN1 | TOPBP1 | CD47 | WNT5A | YPEL2 | FTSJD1 | KCTD13 | GLCCI1 |
| 9 | CGA | LIMA1 | NFAT5 | GJA1 | TANC1 | LIN7C | CDH6 | RIF1 | PGM2 | UTRN |
| 10 | KIAA0133 | MPPED2 | MGRN1 | ARID4A | UHMK1 | UBE2B | SLC8A1 | PLBD2 | PGD | ZNF547 |
| 11 | NSMCE4A | COL4A3BP | FLJ43374 | HOXA13 | TGFBR1 | PAXIP1 | PKP2 | GPM6A | ABCB7 | DGUOK |
| 12 | HCC1_HUMAN | ZNF664 | YBX2 | APC | MGAT4A | BCL10 | ITGAV | ATL2 | MYEF2 | MGC70870 |
| 13 | EAPP | C12orf36 | PPARBP | PHF20L1 | UBE2B | HIAT1 | C18orf1 | C1orf43 | C14orf159 | UST |
| 14 | MTA1 | PCDHA4 | LOC114990 | RBMS1 | ARID4B | ARMC8 | NELL1 | PIP5K1B | GAK | C14orf45 |
| 15 | KIAA1217 | PCDHA6 | MGC19764 | LIN9 | OTUD4 | TANC1 | MRPL9 | XKR4 | GDAP1L1 | WNK3 |
| 16 | CLK1 | PCDHAC2 | ZFHX1B | CELF2 | CDC2L6 | ZNF493 | DCLRE1B | GCLM | SPEG | E2F5 |
| 17 | ITGB1 | PCDHA2 | MLR2 | PCDHA4 | PAPD5 | C1D | NPAT | PTENP1 | IFT52 | CHSY1 |
| 18 | TPD52 | PCDHA10 | DKFZP566B183 | PCDHA13 | FMR1 | FMR1 | GPM6A | SIK3 | PTPRN | TRAPPC3 |
| 19 | KIAA0368 | PCDHA7 | RNF4 | PCDHA5 | SEMA6D | CSNK1G3 | CADM2 | EXTL2 | YRDC | PAX3 |
| 20 | KIAA0284 | PCDHA12 | ESM1 | LOC645166 | CDK6 | FZD7 | SARM1 | GRIPAP1 | RSBN1 | TNKS2 |
The predicted ITGB1 targets are in boldface.
Transfection of miR-9-3p in the absence of drug had a minimal effect on cell proliferation/viability, reducing the mean raw luminescence counts to 87.4% of the count for control cells lacking miRNA. In the presence of AZD6224, synthetic enhancement was observed, with raw counts being reduced to 37.9% of that for the control (Fig. 1D). In contrast, miR-9-5p, the 5′ (non-star form) counterpart to miR-9-3p, had a reciprocal ranking in the primary screen, whereby miR-9-5p transfection resulted in a synthetic rescue causing an increase in growth with MEK inhibition (Fig. 1D). Concordant with these opposing effects of miR-9-3p and miR-9-5p on cell growth in the presence of MEK inhibition, immunoblotting revealed the ability of miR-9-3p to further decrease phospho-ERK1/2 levels in response to AZD6244 treatment, while miR-9-5p resulted in increased phospho-ERK1/2 levels (Fig. 1E).
miR-9-3p and MEK inhibition regulate c-MYC expression.
There is evidence that mir-9 transcription is regulated by c-MYC (18), and conversely, miR-9-3p overexpression has been shown to decrease c-MYC protein expression (19), suggesting a complex feedback regulation. In addition, ERK1/2 phosphorylates c-MYC at serine 62 and stabilizes the protein from proteasomal degradation (20). We have previously shown in claudin-low cells that MEK inhibition results in rapid c-MYC degradation via ERK, with RTK upregulation ultimately leading to resistance to MEK inhibitors (10). Treatment for 48 h with 10 nM GSK1120212, a MEK1/2 inhibitor that has increased potency relative to AZD6244 but that targets the same allosteric regulatory site in MEK1 and MEK2 (21), resulted in c-MYC loss, concordant with the findings of our previous kinome reprogramming study (Fig. 1F). We have previously shown for both MDA-MB-231 cells and a second claudin-low breast cancer cell line, SUM159PT, that the c-MYC protein is initially degraded in response to low-dose MEK inhibitor but returns to near control levels over time as the cells reprogram their kinome and overcome MEK inhibition (10). Thus, even though c-MYC is rapidly degraded with MEK inhibition, c-MYC levels return to control levels after 96 h (Fig. 1G). Expression of miR-9-3p synergized with MEK inhibitor to sustain a loss of c-MYC protein after 96 h, whereas miR-9-3p mimic or MEK inhibition alone led to a level of recovery of c-MYC expression similar to control levels (Fig. 1G). In both MDA-MB-231 and SUM159PT cells, loss of c-MYC expression leads to an upregulation of multiple receptor tyrosine kinases within 24 h of MEK inhibition (10). We observed kinome reprogramming characterized by AZD6224-induced upregulation of PDGFRβ and DDR1 receptor tyrosine kinase in SUM159PT cells expressing miR-9-3p (not shown), indicating that miR-9-3p does not influence kinome reprogramming while sustaining suppression of c-MYC expression. RNAi knockdown of c-MYC expression resulted in cell growth inhibition, which was further potentiated by AZD6244 treatment (Fig. 1H). Cumulatively, these results show that the suppression of c-MYC expression with the combination of MEK inhibitor and miR-9-3p expression inhibits growth of MDA-MB-231 cells.
Epigenetic silencing of miR-9 loci.
Initial quantitative RT-PCR studies using probes for mature miR-9-3p revealed high cycle threshold (CT) values in both MDA-MB-231 (CT = 30.4) and SUM159PT (CT = 35.8) cells (Fig. 2A). The expression of miR-9-3p in additional claudin-low cell lines, WHIM12 and BT549, yielded comparable CT values of 30.2 and 31.3, respectively. We screened additional breast cancer cell lines, including Her2/Neu amplified, basal, and luminal subtypes. The cell line with the highest relative miR-9-3p expression was SUM149 basal-like cells, with a CT value of 26.9, representing a >600-fold relative quantification (RQ) value relative to the levels of miR-9-3p in SUM159PT cells. We found that, with the exception of SUM149 cells, overall miR-9-3p expression was low or nearly nondetectable in the tested breast cancer lines, including telomerase-immortalized human mammary epithelial cells.
Fig 2.

mir-9 loci are methylated in breast cancer subtype cell lines. (A) Quantitative RT-PCR analysis of mature miR-9-3p across breast cancer subtype cell lines. CT values are indicated for each cell line, showing low relative levels of mature miR-9-3p in claudin-low lines and the highest relative expression in the basal line SUM149. U6 snRNA was used for the quantitative RT-PCR internal control. HMEC, human mammary epithelial cells. (B) Schematic of the three mir-9 genomic loci. CpG islands assayed for methylation (see the legend to panel D below) are depicted in red (9); proximal CpG islands are shown in black. Arrows indicate the direction of transcription. Genomic coordinates were determined using the hg19 genome assembly (UCSC Genome Browser). Chr., chromosome. (C) Quantitative RT-PCR analysis showing induction of mature miR-9-3p expression upon 5 μM 5-aza-2′-deoxycytidine (5AZA) treatment in SUM159PT cells. U6 snRNA was used for the quantitative RT-PCR internal control. (D) COBRA methylation assay for the three mir-9 genes across breast cancer subtype cell lines. The CpG islands assayed for methylation are schematized in panel B as red rectangles. Arrows indicate the size of the methylated allele upon restriction digestion of bisulfite-treated DNA. Red asterisks indicate which cell lines show predominant CpG island methylation at each mir-9 locus. Lanes M, molecular size markers, with the molecular sizes indicated on the left. (E) ChIP-PCR showing relative H3K9me3 or H3K27me3 enrichment at the mir-9 loci in MDA-MB-231 cells normalized to SUM149 levels. A constitutively active gene, EEF1A1, was chosen as a negative control for histone H3 lysine trimethylation. DNA methylation at the mir-9-1 locus (F) or mir-9-3 locus (G) in human breast tumors of the indicated subtype in the TCGA database. By the Wilcoxon rank sum test, P was equal to 1.505E−5 (mir-9-1) or 2.146E−5 (mir-9-3) between normal breast-like tumors and tumors of all other subtypes. Methylation status was determined using Illumina Infinium 450K arrays and quantified by calculating the methylated probe intensity to the total intensity at each locus. Results for 332 tumors are as follows: basal = 46, Her2 = 24, LumA = 151, LumB = 88, and normal breast-like = 23. Genomic coordinates (hg19) of CpG island methylation probes are indicated.
There are three miR-9 genes, mir-9-1, mir-9-2, and mir-9-3, transcribed from different chromosomal loci (Fig. 2B), yet all yield identical mature miRNA products. Following a bioinformatic search for candidate CpG islands 5′ of miRNA genes, it was initially shown that the mir-9-1 gene was hypermethylated in primary invasive breast tumors (22). Additional studies have since shown that mir-9 loci are epigenetically silenced in gastric tumors (9), breast mammosphere models (23), oral squamous cell carcinoma (24), and non-small-cell lung cancers, where methylation of mir-9-3 can serve as a prognostic indicator (25, 26). To see if methylation was a contributing silencing mechanism in our system, we first treated cells with the methyltransferase inhibitor 5-aza-2′-deoxycytidine (5AZA). Following 48 h of 5 μM 5AZA treatment in SUM159PT cells, quantitative RT-PCR showed a 14.8-fold increase in the levels of miR-9-3p relative to those in vehicle-treated control cells, while the levels of an oncogenic miRNA transcript not expected to be silenced, miR-21, did not change (Fig. 2C). These data suggested that promoter methylation contributed to the low level of miR-9-3p in claudin-low cells. To validate this suggestion, we performed COBRA (9, 27) (Fig. 2D). In the claudin-low lines tested, prominent CpG island methylation was detected at all three mir-9 genes for MDA-MB-231 cells, at mir-9-1 and mir-9-2 in SUM159PT cells, and at mir-9-2 in WHIM12 cells. For all but one cell line assayed (SUM149), different claudin-low, Her2/Neu-overexpressing, and luminal subtype cell lines tested had methylation of at least one mir-9 locus, but, more commonly, multiple mir-9 loci were methylated. The SUM149 cell line was not methylated at any of the three loci and concordantly showed the highest levels of endogenous miR-9-3p expression.
As epigenetic mechanisms in addition to cytosine methylation could be contributing to mir-9 silencing, we profiled histone H3 trimethylation at the three mir-9 genomic loci by chromatin immunoprecipitation-PCR. Consistent with transcriptional repression of miR-9-3p in MDA-MB-231 cells but not in SUM149 cells (Fig. 2A), a 4.5-fold enrichment of lysine 9 trimethylation of histone H3 (H3K9) in MDA-MB-231 cells relative to SUM149 cells was detected within the 500 bp 5′ of the mir-9-1 hairpin but not appreciably at the mir-9-2 or mir-9-3 locus (Fig. 2E). We failed to detect significant trimethylation of histone H3K27 in MDA-MB-231 cells relative to SUM149 cells at any of the three mir-9 loci. Analysis of The Cancer Genome Atlas (TCGA) breast cancer database showed CpG island methylation at both the miR-9-1 and miR-9-3 promoters in four breast cancer subtypes (Fig. 2F and G). Claudin-low tumors as well as the miR-9-2 gene were not represented in the TCGA DNA methylation data set (28). Thus, in the breast cancer cell lines tested (except for SUM149) and human breast cancers, mir-9 gene promoters have significant CpG island methylation, suggesting that DNA methylation contributes to the epigenetic silencing of mir-9.
miR-9-3p sensitizes MDA-MB-231 and SUM159PT cells to MEK inhibitor-induced growth arrest.
miR-9-3p mediated a synthetic growth suppression phenotype in MDA-MB-231 cells and in SUM159PT cells in the presence of the MEK inhibitor AZD6244 (Fig. 3A and B). A similar synthetic enhancer effect was observed with a second MEK inhibitor also in clinical trials, GSK1120212, demonstrating that the synthetic enhancement seen with miR-9-3p is a function of a cooperative effect of the miRNA and MEK inhibition. Expression of miR-9-3p had a modest but measureable effect alone on growth of MDA-MB-231 cells but not SUM159PT cells. This baseline effect contributed to SUM159PT cells displaying an increased miR-9-3p/MEK inhibition synthetic effect relative to MDA-MB-231 cells upon renormalization of the growth curves to the DMSO value for each miRNA, control, or miR-9-3p (Fig. 3B). miR-9-3p sensitized both cell lines to low-dose MEK inhibitor, demonstrating that miR-9-3p is targeting genes whose expression is required for ERK1/2-dependent cell proliferation. Consistent with results of the primary screen, miR-9-5p failed to yield the synthetic enhancement driven by the miR-9-3p form and, instead, decreased the relative growth inhibition of both cell lines in response to MEK inhibitor.
Fig 3.

miR-9-3p enhances MEK inhibitor-induced growth suppression. (A) Dose-response analysis for MDA-MB-231 cells or SUM159PT cells using the MEK inhibitor AZD6244 or GSK1120212 in the presence of control, miR-9-3p, or miR-9-5p miRNA mimics, showing growth attenuation with miR-9-3p and growth rescue with miR-9-5p. Cells were treated with drug and miRNA for 96 h prior to assaying cell viability by CellTiter-Glo luminescence, which was normalized to the value for control miRNA treated with DMSO. Error bars indicate SEMs of three experiments. (B) Dose-response curves as in panel A normalized to the value for each miRNA treated with DMSO separately for miR-9-3p or control miRNA. (C) DNA content determined by propidium iodide (PI) flow cytometry of SUM159PT cells 96 h after miR-9-3p or control miRNA treatment with or without 250 nM AZD6244. High-dose (500 nM) GSK1120212 was used as a positive control for the G0/G1 arrest induced by MEK inhibition. (D) Cell cycle stage quantification and percent growth inhibition from the flow cytometry data in panel C. (E) DIC image showing enhanced dynamic blebbing (arrows) after dual treatment of MDA-MB-231 cells with miR-9-3p and 500 nM AZD6244 for 96 h relative to control miRNA treated with DMSO condition. Bars = 50 μm. See Movie S1 in the supplemental material. (F) MDA-MB-231 cell blotting for endogenous BIM protein 96 h after transfection with the indicated miRNA mimics and treatment with 1.5 μM AZD6244 or DMSO. (G) BIM immunoblotting at 2, 4, and 6 days after transfection of SUM159PT cells with the indicated miRNA mimics and treatment with 500 nM AZD6244 or DMSO. Loading controls were actin or ERK2.
We further characterized the growth arrest caused by miR-9-3p plus MEK inhibitor by flow cytometry. Cell cycle staging by propidium iodide staining yielded the expected G0/G1 arrest in SUM159PT cells following 96 h of treatment with a high dose of MEK inhibitor (500 nM GSK1120212) that sustains MEK inhibition and a loss of c-MYC expression (10). In contrast, a modest dose of MEK inhibitor in combination with miR-9-3p gave only partial arrest of cell proliferation, with no discrete cell cycle stage arrest relative to that under control miRNA conditions (Fig. 3C and D). Flow cytometry analyses indicated little sub-G0 DNA content, consistent with little or no induced apoptosis. The findings show that the decreased cell proliferation observed with miR-9-3p in combination with a low dose of MEK inhibitor does not cause cell cycle stage arrest or progression to apoptosis but, rather, causes a prolonged progression of the cell cycle.
Specific to MDA-MB-231 cells, cells dually treated with miR-9-3p and AZD6244 were smaller in size and displayed a dynamic membrane blebbing (Fig. 3E; see Movie S1 in the supplemental material). Because of this morphological phenotype, we assessed the proapoptotic marker BIM in MDA-MB-231 cells. We observed increased BIM levels in MDA-MB-231 cells treated with miR-9-3p and AZD6244 (Fig. 3F). SUM159PT cells did not show a membrane blebbing-like morphology, nor did they show evidence of apoptosis by flow cytometry (Fig. 3C), but they did show increased BIM protein at 2, 4, and 6 days of treatment with miR-9-3p plus AZD6244 (Fig. 3G). Despite the expression of BIM, neither the MDA-MB-231 nor SUM159PT cells underwent apoptosis. These results suggest that the membrane blebbing-like response is unrelated to apoptosis but that the increased BIM expression would presumably prime the cells for apoptosis.
Treatment with miR-9-3p plus MEK inhibitor inhibits cell migration and invasion.
To gain a more detailed understanding of the miR-9-3p growth suppression phenotype, we performed multiday time-lapse imaging in a VivaView CO2 incubator microscope, allowing capture of cell phenotypes over time. MDA-MB-231 cells (Fig. 4A; see Movie S2 in the supplemental material) and SUM159PT cells (Fig. 4B; see Movie S3 in the supplemental material) showed significant inhibition of proliferation when they were treated with the combination of miR-9-3p and AZD6244. In addition, the movies clearly showed a marked decrease in random cell migration (see Movies S2 and S3 in the supplemental material). There was no decrease in random migration in control AZD6244-treated cells in the absence of miR-9-3p expression or in the miR-9-3p-transfected cells in the absence of AZD6244. To quantify the migration defect, we performed Transwell migration assays (Fig. 4C and D). The migration of miR-9-3p-transfected and AZD6244-treated MDA-MB-231 cells was reduced to 33.4% of the mean value of AZD6244-treated cells transfected with control miRNA, while migration was reduced to 36.1% for SUM159PT cells. The invasive capacity of AZD6244 in the presence or absence of miR-9-3p was assessed using the Matrigel matrix transwell assay. As observed in the migration assays, treatment of cells with miR-9-3p plus AZD6244 resulted in a stronger inhibition of invasion than treatment of cells with single agents alone, with invasion of MDA-MB-231 cells being reduced to 20.9% and that of SUM159PT cells being reduced to 32.4% of the mean value of control miRNA-transfected, AZD6244-treated cells (Fig. 4E and F). Thus, miR-9-3p expression synergizes with MEK inhibitor for inhibition of proliferation, migration, and invasion of MDA-MB-231 and SUM159PT cells.
Fig 4.
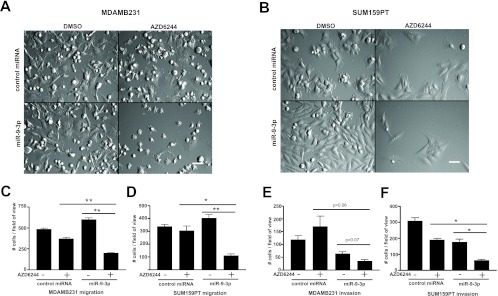
Inhibition of cell migration and invasion by miR-9-3p plus MEK inhibitor. (A and B) DIC imaging of MDA-MB-231 (A) or SUM159PT (B) cells treated with miR-9-3p or control miRNA mimic, with or without AZD6244 treatment (MDA-MB-231 cells were treated with 500 nM, SUM159PT cells were treated with 250 nM). Shown is frame 207 of 34- or 42-h time-lapse imaging with 10-min intervals using a ×20 objective, showing reduced proliferation and migration of cells dually treated with miR-9-3p and AZD6244 (see Movies S2 and S3 in the supplemental material). Bars = 100 μm. (C to F) Transwell migration (C and D) or Matrigel invasion (E and F) assays for MDA-MB-231 and SUM159PT cells treated with or without miR-9-3p and with or without MEK inhibitor. Cells were allowed to migrate/invade Transwells for a 24-h duration 48 h after miRNA transfection and pretreatment with 500 nM (MDA-MB-231 cells) or 250 nM (SUM159PT cells) AZD6244. Error bars indicate SEMs of three experiments. *, P < 0.05, **, P < 0.01.
Identification of ITGB1 as an miR-9-3p target.
The MicroCosm miRNA target algorithm (13) predicted the presence of two independent miR-9-3p binding sites within the 3′ UTR of the ITGB1 transcript. Seven base pairs of identity between the ITGB1 transcript and the miR-9-3p seed sequence exist at both putative target sites (Fig. 5A). A third 3′ UTR site, not detected by MicroCosm, harbored the identical seed sequence identity but lacked homology to the 3′ region of miR-9-3p relative to the other two predicted sites (Fig. 5A). We blotted for endogenous ITGB1 protein following miR-9-3p mimic transfection of both MDA-MB-231 and SUM159PT cells (Fig. 5B). ITGB1 protein was markedly reduced with transfection of miR-9-3p in both cell lines. Expression of the opposite-strand miR-9-5p mimic had no effect on ITGB1 protein expression in MDA-MB-231 cells. In addition to protein levels, miR-9-3p treatment of SUM159PT cells reduced ITGB1 transcript levels to 44.8% of the levels detected in cells treated with control miRNA (Fig. 5C). Because the ITGB1 transcript loss assessed by quantitative RT-PCR did not appear to be as complete as the ITGB1 protein loss upon Western blotting, it is likely that miR-9-3p elicits translational repression effects, in addition to effects on mRNA stability.
Fig 5.
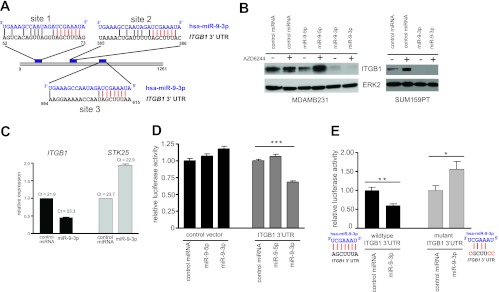
The β1 integrin gene (ITGB1) is a target of miR-9-3p. (A) Alignment of miR-9-3p with two putative binding sites (sites 1 and 2) within ITGB1 3′ UTR, as predicted by MicroCosm Targets v5 (EMBL-EBI). A third site with the identical seed sequence homology but weaker overall homology to miR-9-3p is shown as site 3. Seed sequence identity is highlighted in red. (B) (Left) Western blot showing the loss of endogenous ITGB1 protein in MDA-MB-231 cells 96 h posttransfection with the miR-9-3p mimic but not the miR-9-5p mimic in the presence or absence of 500 nM AZD6244; (right) loss of endogenous ITGB1 protein in SUM159PT cells 48 h after transfection with the miR-9-3p mimic in the presence or absence of 250 nM AZD6244. (C) Real-time PCR showing decreased levels of the ITGB1 transcript in SUM159PT cells 48 h after miR-9-3p mimic transfection. STK25 transcript levels are shown as a negative control. (D) Dual-luciferase reporter assay showing miR-9-3p dampening of the firefly luciferase transcript linked to the full-length human ITGB1 3′ UTR. The firefly luciferase signal was normalized to the signal obtained for Renilla luciferase to control for transfection efficiency, and this ratio was then normalized to the value for control miRNA-treated cells for control or ITGB1 3′ UTR vectors. Error bars indicate SEMs of 10 replicate wells within a 96-well assay plate. ***, P < 0.001. (E) Loss of miR-9-3p-mediated suppression of luciferase-ITGB1 3′ UTR reporter expression with mutation of three predicted miR-9-3p binding sites (A). *, P < 0.05, **, P < 0.01. The ITGB1 3′ UTR nucleotide substitutions designed to disrupt miR-9-3p seed sequence binding are indicated in red.
To further confirm that ITGB1 is a target of miR-9-3p, we used a luciferase reporter vector harboring the ITGB1 3′ UTR sequence. Transient miR-9-3p overexpression dampened the mean luciferase readout to 68.0% (P < 0.001) of that for cells transfected with control miRNA, with no luciferase attenuation detected upon miR-9-5p transfection (Fig. 5D). Combined mutation of the three ITGB1 3′ UTR sites predicted to bind the miR-9-3p seed sequence (Fig. 5A) completely rescued the luciferase reporter repression caused by transient miR-9-3p overexpression, validating that these predicted sites are functional sites of miR-9-3p binding (Fig. 5E). Together, these data validate, for the first time, ITGB1 as a target for miR-9-3p.
ITGB1 expression is elevated in claudin-low breast cancer.
We queried the UNC337 gene array database with expression data comprising tumors of normal-like, luminal A, luminal B, HER2-enriched, basal-like, and claudin-low intrinsic subtypes for expression of ITGB1 (6). ITGB1 was more highly expressed in claudin-low tumors than the other intrinsic breast cancer subtypes (Fig. 6; P = 2.2E−5), suggesting a contributing function in the mesenchymal-like features of claudin-low tumor cells. We therefore targeted ITGB1 in claudin-low MDA-MB-231 and SUM159PT cells as a druggable protein regulated by miR-9-3p.
Fig 6.
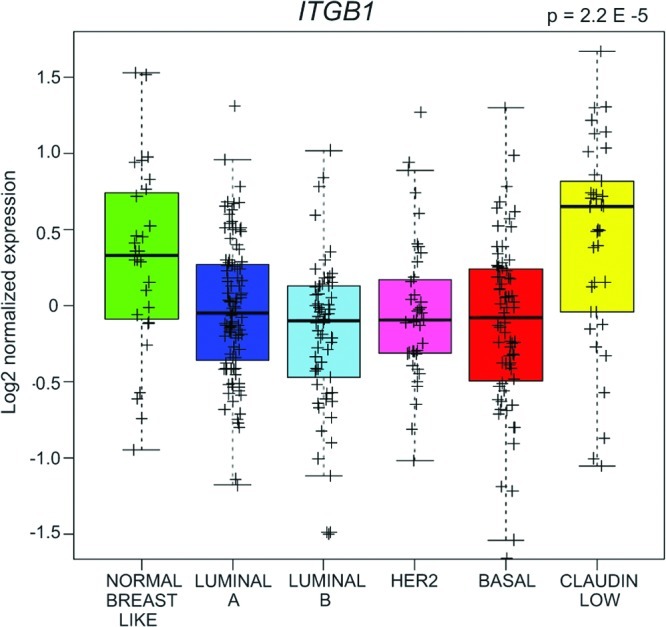
Elevated ITGB1 expression in human claudin-low tumors relative to tumors of the remaining indicated subtypes from the UNC337 gene array database. P = 2.2E−5 by the unequal variance t test; n = 337 tumors; whiskers = 1.5 interquartile range.
ITGB1 regulation of MDA-MB-231 and SUM159PT cell proliferation, migration, and invasion.
We used both siRNA knockdown of ITGB1 expression and a function-blocking monoclonal antibody, AIIB2 (29), in experiments to test the function of ITGB1 in MDA-MB-231 and SUM159PT cells (Fig. 7A and B). siRNA knockdown of ITGB1 expression in both cell types significantly inhibited proliferation (Fig. 7A), indicating that ITGB1 positively regulates cell growth. RNAi knockdown of ITGB1 in combination with AZD6244 further inhibited growth of both cell lines, consistent with ITGB1 being a major target of miR-9-3p whose repression enhances growth inhibition of the two cell lines by MEK inhibitor.
Fig 7.
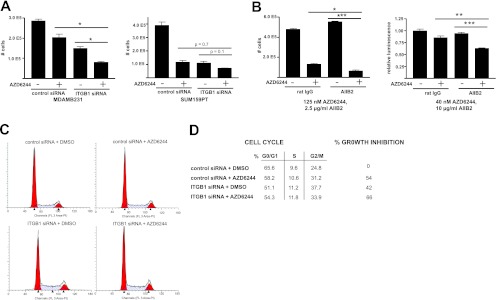
ITGB1 perturbation potentiates growth inhibition by MEK inhibitor. (A) The effect of β1 integrin perturbation/MEK inhibition on cell proliferation using ITGB1 siRNA. MDA-MB-231 or SUM159PT cells were treated with 500 nM (MDA-MB-231) or 125 nM (SUM159PT) AZD6244 or DMSO for 96 h, followed by hemocytometer cell counts. (B) Effect of β1 integrin perturbation/MEK inhibition on SUM159PT cell growth using 2.5 μg/ml (left) or 10 μg/ml (right) β1 integrin blocking antibody in the presence of 125 nM (left) or 40 nM (right) AZD6244. Growth inhibition was assayed by hemocytometer cell counts or CellTiter-Glo luminescence 72 h after addition of drug-antibody. Error bars represent SEMs of 3 replicates for panels A and B. *, P < 0.05, **, P < 0.01, ***, P < 0.001. (C) DNA content determined by propidium iodide flow cytometry of SUM159PT cells 96 h after ITGB1 siRNA or control siRNA treatment with or without 250 nM AZD6244. (D) Cell cycle stage quantification and percent growth inhibition from flow cytometry data in panel C.
At a dose of 2.5 μg/ml, the AIIB2 β1 integrin function-blocking antibody significantly enhanced AZD6244 (125 nM)-mediated growth arrest of SUM159PT cells (with the mean cell counts decreasing from 27.6% to 13.9% of the mean cell counts of control IgG-treated cells in the absence of AZD6244) (Fig. 7B, left). A 4-fold increase in AIIB2 dose synergized with MEK inhibition to decrease cell viability (to 63.3% of that for control IgG-treated cells in the absence of AZD6244), despite a lower dose (40 nM versus 125 nM) of AZD6244 (Fig. 7B, right), demonstrating a reciprocal dosing relationship between MEK and ITGB1 inhibition.
As performed for miR-9-3p, we characterized the effect of siRNA knockdown of ITGB1 on cell cycle progression by propidium iodide flow cytometry. The effect of ITGB1 siRNA was concordant with transient transfection of the miR-9-3p mimic, resulting in overall diminution of cell cycle progression with no stage-specific arrest (Fig. 7C and D).
Although the AIIB2 antibody had a modest effect on SUM159PT proliferation relative to siRNA knockdown of ITGB1 (Fig. 7A and B), in the presence of AZD6244, it had robust effects on both migration and invasion (Fig. 8A to F; see Movies S4 and S5 in the supplemental material). Attenuation of both migration and invasion by AIIB2 in the presence of MEK inhibitor compared to that achieved with either agent alone was quantified using Transwell assays (Fig. 8A to D). The inhibition of migration and invasion seen with the AIIB2 antibody was phenocopied by siRNA knockdown of ITGB1 (Fig. 8A to D, G, and H; see Movies S6 and S7 in the supplemental material). Importantly, cell numbers were normalized before assay of migration and invasion, so that changes in cell number resulting from growth inhibition did not significantly contribute to differences in cell number during Transwell assays. Cumulatively, these results show that inhibition of ITGB1 function in combination with MEK inhibition has pronounced inhibitory effects on migration and invasion of MDA-MB-231 and SUM159PT cells.
Fig 8.

β1 integrin perturbation further attenuates cell migration and invasion in the presence of MEK inhibition. (A to D) Transwell migration and Matrigel invasion assays for MDA-MB-231 (A and B) and SUM159PT (C and D) cells with or without 2.5 μg/ml AIIB2 β1 integrin inhibitory antibody (top) or with or without ITGB1 siRNA (bottom) and with or without MEK inhibition. Cells were allowed to migrate/invade for a 24-h duration 48 h after pretreatment with AZD6244 and AIIB2 antibody or ITGB1 siRNA. Error bars indicate SEMs of three experiments. *, P < 0.05; **, P < 0.01; ***, P < 0.001. (E to H) DIC imaging of MDA-MB-231 or SUM159PT cells treated with AIIB2 β1 integrin blocking antibody (E and F) or ITGB1 siRNA (G, H) with or without AZD6244 treatment. Shown is frame 122 of 59 h of time-lapse imaging with 20-min intervals using a ×20 objective, showing reduced proliferation and migration of cells treated with both integrin perturbation and AZD6244 (see Movies S4 to S7 in the supplemental material). Cells dually treated with ITGB1 siRNA and AZD6244 were larger and displayed a more spread morphology. Bars = 200 μm. AZD6244 was used at 500 nM and 250 nM for MDA-MB-231 and SUM159PT cells, respectively, for all experiments whose results are presented in Fig. 8.
DISCUSSION
Our synthetic enhancer screen, by design, yielded candidate growth-suppressive miRNAs. In this study, we verified that miR-9-3p plays a tumor-suppressive role in the claudin-low cell lines MDA-MB-231 and SUM159PT. mir-9 is epigenetically silenced by promoter methylation in these cells, which is a common observation for many tumor-suppressive miRNAs (30). To date, much of the miR-9-5p/3p characterization has stemmed from studies in neurons, where expression is abundant and due to the conservation of miR-9-5p/3p neural expression across species (31). Studies exploiting mir-9-2 mir-9-3 double-knockout mice (32) and other animal models (33, 34) have demonstrated a role for miR-9-5p/3p in the proliferation and migration of neural progenitor cells. This has been thought to be in large part due to the direct targeting of transcription factors by miR-9-5p/3p (35, 36). Furthermore, miR-9-5p/3p along with miR-124 has been shown to influence neural fate determination via chromatin remodeling complexes (37).
In addition to these neuronal miR-9-5p/3p functions, increasing attention to its role in cancer has stemmed from initial studies showing effects on metastasis by miR-9-5p targeting E-cadherin (18) and multiple studies showing tumor-specific epigenetic silencing of the mir-9 loci in diverse cancer types (9, 22–26). It is now appreciated that in cancer miRNA functionality is contextual; that is, a given miRNA can be tumor suppressive or oncogenic, depending on the cell type or environment. This can be due to the relative abundance of a target mRNA, alternative polyadenylation sites resulting in the loss or gain of miRNA transcript binding sites, or mutation of miRNA binding sites (reviewed in reference 38). In fact, rather than being epigenetically silenced, mir-9 was shown to be overexpressed in Hodgkin's lymphoma (39), in lymphoma of the central nervous system (40), and in gastric cancer (41). In our screen, the miR-9-5p strand yielded a growth phenotype opposite that yielded by our synthetic enhancer hit, miR-9-3p. In cases where both strands are functional and not degraded, there are examples of the 5p and 3p strands cooperating temporally, despite targeting different mRNAs, resulting in a synergistic effect. An example includes miR-155-5p and miR-155-3p, whereby the two strands cooperatively regulate the balance of interferon production: miR-155-5p targets IRAKM, resulting in positive regulation of interferon, while miR-155-3p targets TAB2, functioning as a negative regulator of the response (42). Interestingly, miR-9-5p and miR-9-3p have been shown to regulate different members of the same transcriptional regulatory complex, REST/CoREST, which represses transcription of neuronal genes (36). In our system, the different functional strands have opposing effects on cell proliferation. This suggests that the miR-9-5p/miR-9-3p ratios are under strict posttranscriptional regulation in cells where the mir-9 genes are not silenced.
The identification of miR-9-3p from our primary screen allowed us to subsequently identify a new target for this miRNA, ITGB1. Humanized function-blocking antibodies (43, 44) against epithelial α5β1 heterodimers are now in preclinical, phase I, and phase II trials. In addition, the small fibronectin peptide antagonist of α5β1 ATN-161 (45–47) entered phase I studies for glioma and renal cell carcinoma, while the α5β1 antagonist JSM6427 (48, 49) entered phase I studies for age-related macular degeneration. In HER-2-overexpressing breast cancer cells, the ITGB1-inhibitory antibody AIIB2 synergizes with the HER-2 monoclonal antibody trastuzumab to increase growth suppression (50). Our data suggest that such a combinatorial strategy with dual MEK and ITGB1 inhibition can be effective for two different claudin-low breast cancer cell lines. The influence of MEK/ERK on integrin signaling is well established: integrin activation by extracellular matrix ligation commonly leads to mitogen-activated protein kinase activation via FAK and SRC, while ERK activation can also influence surface integrin expression (51). The miR-9-3p/MEK inhibition-induced phenotype of decreased proliferation, migration, and invasion in the absence of apoptosis is consistent with the purported role of ITGB1 in breast cancer tumor cell dormancy, growth, and metastasis (52, 53). Our analysis of expression data from the UNC337 database showed that ITGB1 mRNA was expressed at the highest levels in human claudin-low breast tumors relative to other breast cancer subtypes (6). Data from both cell lines and TCGA patient breast tumors showed significant cytosine methylation of mir-9 promoter regions, which would be consistent with the UNC337 breast cancer patient database showing significant ITGB1 mRNA expression in claudin-low tumors. Claudins have been shown to mediate breast cancer cell metastasis to liver in part via regulation of surface expression of α2β1 and α5β1 integrin heterodimers (54). Thus, elevated integrin expression in claudin-low tumors might allow a compensation mechanism for low baseline claudin expression in this breast cancer subtype.
The claudin-low cell lines employed in this study harbor activating Ras mutations: G13D KRAS in MDA-MB-231 cells and G12D HRAS in SUM159PT cells (55). Current evidence suggests that there is an overall low frequency of Ras mutations in breast cancer, especially among the HER2-positive and luminal subtypes. There was a paucity of Ras mutations identified in TCGA patient breast tumors, with only one activating Ras mutation, of the basal-like subtype, being found (28). It should be noted that claudin-low tumors were markedly underrepresented in TCGA patient tumors, with only 4 or 5 tumors that profiled as claudin low being found in the entire study (n = 501). Despite this low prevalence of activating mutations, 30% of basal-like tumors analyzed in the TCGA study harbored genomic amplification of KRAS (28). Ras is amplified during tumor progression in the C3(1)/simian virus 40 TAg mouse model of basal-like/claudin-low breast cancer, whereby comparative genomic hybridization analysis revealed up to 40-fold amplification of the KRAS locus (56). In addition to many claudin-low human cell lines having activating Ras mutations, each of the murine cell lines established from the C3 TAg GEMM and the T11 claudin-low mouse model (57) has activating Ras mutations. Thus, the role of activating Ras mutations in claudin-low breast cancer is just beginning to be defined. A role for mutant Ras in different tumor types where Ras has not previously been thought to play a role is illustrated in a recent study that documented a selection for a mutant Ras leukemia in melanoma patients receiving the Raf inhibitor vemurafenib (58). An analogous enrichment for mutant or amplified Ras may be occurring in claudin-low tumors. Thus, we believe that the relevance of the findings presented here are truly representative of the claudin-low subtype.
The findings support a model whereby in claudin-low breast cancer cells there is sufficient methylation at the promoters of each of the mir-9 genomic loci to significantly silence expression that could result in diminished miR-9-3p-mediated regulation of ITGB1 expression. This could increase integrin and c-MYC expression, whereby the cells could have enhanced migration and invasion as well as the potential for increased proliferation. Low-dose AZD6244 or GSK1120212 synergized with miR-9-3p to elicit the inhibition of growth, migration, and invasion. A key aspect of AZD6244 inhibition of MEK-ERK activity in claudin-low cell lines is enhanced c-MYC degradation, with subsequent kinome reprogramming leading to RTK upregulation (10), and loss of the c-MYC protein strongly suppresses growth of claudin-low breast cancer cells (59). miR-9-3p sustained the loss of c-MYC expression in the presence of MEK inhibitor. miR-9-3p also inhibited ITGB1 expression, and the loss of ITGB1 inhibited MDA-MB-231 and SUM159PT cell growth. Thus, the combination of MEK inhibitor and mIR-9-3p has a cumulative effect of inhibiting both ITGB1 and c-MYC functions.
In cells where mir-9 loci are not silenced, ITGB1 signaling may be attenuated by miR-9-3p, yielding a baseline level of integrin function, as opposed to a more aggressive invasive/migratory phenotype. Consistent with this notion, miR-9-3p expression has been shown to be significantly lower in metastatic tumors than primary tumors (60). In sum, the results show that miR-9-3p silencing can be pharmacologically overcome using MEK inhibitor in combination with ITGB1 inhibition in claudin-low cells; similar approaches using synthetic enhancement screens should identify additional druggable targets of silenced tumor-suppressive miRNAs.
Supplementary Material
ACKNOWLEDGMENTS
This work was supported by NIH grants GM30324 and GM101141 and a UCRF Innovation Award to G.L.J.
We acknowledge the UNC RNAi screening facility, the UNC Flow Cytometry Core Facility, and the UNC-Olympus Imaging Research Center. The monoclonal antibody AIIB2 developed by Caroline H. Damsky was obtained from the Developmental Studies Hybridoma Bank developed under the auspices of the NICHD and maintained by the University of Iowa, Department of Biology, Iowa City, IA.
Footnotes
Published ahead of print 25 March 2013
Supplemental material for this article may be found at http://dx.doi.org/10.1128/MCB.00269-13.
REFERENCES
- 1. Chandarlapaty S, Sawai A, Scaltriti M, Rodrik-Outmezguine V, Grbovic-Huezo O, Serra V, Majumder PK, Baselga J, Rosen N. 2011. AKT inhibition relieves feedback suppression of receptor tyrosine kinase expression and activity. Cancer Cell 19:58–71 [DOI] [PMC free article] [PubMed] [Google Scholar]
- 2. Johannessen CM, Boehm JS, Kim SY, Thomas SR, Wardwell L, Johnson LA, Emery CM, Stransky N, Cogdill AP, Barretina J, Caponigro G, Hieronymus H, Murray RR, Salehi-Ashtiani K, Hill DE, Vidal M, Zhao JJ, Yang X, Alkan O, Kim S, Harris JL, Wilson CJ, Myer VE, Finan PM, Root DE, Roberts TM, Golub T, Flaherty KT, Dummer R, Weber BL, Sellers WR, Schlegel R, Wargo JA, Hahn WC, Garraway LA. 2010. COT drives resistance to RAF inhibition through MAP kinase pathway reactivation. Nature 468:968–972 [DOI] [PMC free article] [PubMed] [Google Scholar]
- 3. Villanueva J, Vultur A, Lee JT, Somasundaram R, Fukunaga-Kalabis M, Cipolla AK, Wubbenhorst B, Xu X, Gimotty PA, Kee D, Santiago-Walker AE, Letrero R, D'Andrea K, Pushparajan A, Hayden JE, Brown KD, Laquerre S, McArthur GA, Sosman JA, Nathanson KL, Herlyn M. 2010. Acquired resistance to BRAF inhibitors mediated by a RAF kinase switch in melanoma can be overcome by cotargeting MEK and IGF-1R/PI3K. Cancer Cell 18:683–695 [DOI] [PMC free article] [PubMed] [Google Scholar]
- 4. Pillay V, Allaf L, Wilding AL, Donoghue JF, Court NW, Greenall SA, Scott AM, Johns TG. 2009. The plasticity of oncogene addiction: implications for targeted therapies directed to receptor tyrosine kinases. Neoplasia 11:448–458, 2 p following 458 [DOI] [PMC free article] [PubMed] [Google Scholar]
- 5. Perou CM. 2010. Molecular stratification of triple-negative breast cancers. Oncologist 15(Suppl. 5):39–48 [DOI] [PubMed] [Google Scholar]
- 6. Prat A, Parker JS, Karginova O, Fan C, Livasy C, Herschkowitz JI, He X, Perou CM. 2010. Phenotypic and molecular characterization of the claudin-low intrinsic subtype of breast cancer. Breast Cancer Res. 12:R68 doi:10.1186/bcr2635 [DOI] [PMC free article] [PubMed] [Google Scholar]
- 7. Baldwin A, Grueneberg DA, Hellner K, Sawyer J, Grace M, Li W, Harlow E, Munger K. 2010. Kinase requirements in human cells. V. Synthetic lethal interactions between p53 and the protein kinases SGK2 and PAK3. Proc. Natl. Acad. Sci. U. S. A. 107:12463–12468 [DOI] [PMC free article] [PubMed] [Google Scholar]
- 8. Luo J, Emanuele MJ, Li D, Creighton CJ, Schlabach MR, Westbrook TF, Wong K-K, Elledge SJ. 2009. A genome-wide RNAi screen identifies multiple synthetic lethal interactions with the Ras oncogene. Cell 137:835–848 [DOI] [PMC free article] [PubMed] [Google Scholar]
- 9. Tsai K-W, Liao Y-L, Wu C-W, Hu L-Y, Li S-C, Chan W-C, Ho M-R, Lai C-H, Kao H-W, Fang W-L, Huang K-H, Lin W. 2011. Aberrant hypermethylation of miR-9 genes in gastric cancer. Epigenetics 6:1189–1197 [DOI] [PMC free article] [PubMed] [Google Scholar]
- 10. Duncan JS, Whittle MC, Nakamura K, Abell AN, Midland AA, Zawistowski JS, Johnson NL, Granger DA, Jordan NV, Darr DB, Usary J, Kuan P-F, Smalley DM, Major B, He X, Hoadley KA, Zhou B, Sharpless NE, Perou CM, Kim WY, Gomez SM, Chen X, Jin J, Frye SV, Earp HS, Graves LM, Johnson GL. 2012. Dynamic reprogramming of the kinome in response to targeted MEK inhibition in triple-negative breast cancer. Cell 149:307–321 [DOI] [PMC free article] [PubMed] [Google Scholar]
- 11. Li Q, Chow AB, Mattingly RR. 2010. Three-dimensional overlay culture models of human breast cancer reveal a critical sensitivity to mitogen-activated protein kinase kinase inhibitors. J. Pharmacol. Exp. Ther. 332:821–828 [DOI] [PMC free article] [PubMed] [Google Scholar]
- 12. Yeh TC, Marsh V, Bernat BA, Ballard J, Colwell H, Evans RJ, Parry J, Smith D, Brandhuber BJ, Gross S, Marlow A, Hurley B, Lyssikatos J, Lee PA, Winkler JD, Koch K, Wallace E. 2007. Biological characterization of ARRY-142886 (AZD6244), a potent, highly selective mitogen-activated protein kinase kinase 1/2 inhibitor. Clin. Cancer Res. 13:1576–1583 [DOI] [PubMed] [Google Scholar]
- 13. Griffiths-Jones S, Saini HK, Van Dongen S, Enright AJ. 2008. miRBase: tools for microRNA genomics. Nucleic Acids Res. 36:D154–D158 [DOI] [PMC free article] [PubMed] [Google Scholar]
- 14. Betel D, Wilson M, Gabow A, Marks DS, Sander C. 2008. The microRNA.org resource: targets and expression. Nucleic Acids Res. 36:D149–D153 [DOI] [PMC free article] [PubMed] [Google Scholar]
- 15. Krek A, Grün D, Poy MN, Wolf R, Rosenberg L, Epstein EJ, MacMenamin P, Da Piedade I, Gunsalus KC, Stoffel M, Rajewsky N. 2005. Combinatorial microRNA target predictions. Nat. Genet. 37:495–500 [DOI] [PubMed] [Google Scholar]
- 16. Friedman RC, Farh KK-H, Burge CB, Bartel DP. 2009. Most mammalian mRNAs are conserved targets of microRNAs. Genome Res. 19:92–105 [DOI] [PMC free article] [PubMed] [Google Scholar]
- 17. Alam N, Goel HL, Zarif MJ, Butterfield JE, Perkins HM, Sansoucy BG, Sawyer TK, Languino LR. 2007. The integrin-growth factor receptor duet. J. Cell. Physiol. 213:649–653 [DOI] [PubMed] [Google Scholar]
- 18. Ma L, Young J, Prabhala H, Pan E, Mestdagh P, Muth D, Teruya-Feldstein J, Reinhardt F, Onder TT, Valastyan S, Westermann F, Speleman F, Vandesompele J, Weinberg RA. 2010. miR-9, a MYC/MYCN-activated microRNA, regulates E-cadherin and cancer metastasis. Nat. Cell Biol. 12:247–256 [DOI] [PMC free article] [PubMed] [Google Scholar]
- 19. Onnis A, De Falco G, Antonicelli G, Onorati M, Bellan C, Sherman O, Sayed S, Leoncini L. 2010. Alteration of microRNAs regulated by c-Myc in Burkitt lymphoma. PLoS One 5:e12960 doi:10.1371/journal.pone.0012960 [DOI] [PMC free article] [PubMed] [Google Scholar]
- 20. Sears R, Nuckolls F, Haura E, Taya Y, Tamai K, Nevins JR. 2000. Multiple Ras-dependent phosphorylation pathways regulate Myc protein stability. Genes Dev. 14:2501–2514 [DOI] [PMC free article] [PubMed] [Google Scholar]
- 21. Gilmartin AG, Bleam MR, Groy A, Moss KG, Minthorn EA, Kulkarni SG, Rominger CM, Erskine S, Fisher KE, Yang J, Zappacosta F, Annan R, Sutton D, Laquerre SG. 2011. GSK1120212 (JTP-74057) is an inhibitor of MEK activity and activation with favorable pharmacokinetic properties for sustained in vivo pathway inhibition. Clin. Cancer Res. 17:989–1000 [DOI] [PubMed] [Google Scholar]
- 22. Lehmann U, Hasemeier B, Christgen M, Müller M, Römermann D, Länger F, Kreipe H. 2008. Epigenetic inactivation of microRNA gene hsa-mir-9-1 in human breast cancer. J. Pathol. 214:17–24 [DOI] [PubMed] [Google Scholar]
- 23. Hsu P-Y, Deatherage DE, Rodriguez BAT, Liyanarachchi S, Weng Y-I, Zuo T, Liu J, Cheng ASL, Huang TH-M. 2009. Xenoestrogen-induced epigenetic repression of microRNA-9-3 in breast epithelial cells. Cancer Res. 69:5936–5945 [DOI] [PMC free article] [PubMed] [Google Scholar]
- 24. Minor J, Wang X, Zhang F, Song J, Jimeno A, Wang X-J, Lu X, Gross N, Kulesz-Martin M, Wang D, Lu S-L. 2012. Methylation of microRNA-9 is a specific and sensitive biomarker for oral and oropharyngeal squamous cell carcinomas. Oral Oncol. 48:73–78 [DOI] [PMC free article] [PubMed] [Google Scholar]
- 25. Heller G, Weinzierl M, Noll C, Babinsky V, Ziegler B, Altenberger C, Minichsdorfer C, Lang G, Döme B, End-Pfützenreuter A, Arns B-M, Grin Y, Klepetko W, Zielinski CC, Zöchbauer-Müller S. 2012. Genome-wide miRNA expression profiling identifies miR-9-3 and miR-193a as targets for DNA methylation in non-small cell lung cancers. Clin. Cancer Res. 18:1619–1629 [DOI] [PubMed] [Google Scholar]
- 26. Kitano K, Watanabe K, Emoto N, Kage H, Hamano E, Nagase T, Sano A, Murakawa T, Nakajima J, Goto A, Fukayama M, Yatomi Y, Ohishi N, Takai D. 2011. CpG island methylation of microRNAs is associated with tumor size and recurrence of non-small-cell lung cancer. Cancer Sci. 102:2126–2131 [DOI] [PubMed] [Google Scholar]
- 27. Xiong Z, Laird PW. 1997. COBRA: a sensitive and quantitative DNA methylation assay. Nucleic Acids Res. 25:2532–2534 [DOI] [PMC free article] [PubMed] [Google Scholar]
- 28. Cancer Genome Atlas Network 2012. Comprehensive molecular portraits of human breast tumours. Nature 490:61–70 [DOI] [PMC free article] [PubMed] [Google Scholar]
- 29. Werb Z, Tremble PM, Behrendtsen O, Crowley E, Damsky CH. 1989. Signal transduction through the fibronectin receptor induces collagenase and stromelysin gene expression. J. Cell Biol. 109:877–889 [DOI] [PMC free article] [PubMed] [Google Scholar]
- 30. Wong KY, Yu L, Chim CS. 2011. DNA methylation of tumor suppressor miRNA genes: a lesson from the miR-34 family. Epigenomics 3:83–92 [DOI] [PubMed] [Google Scholar]
- 31. Yuva-Aydemir Y, Simkin A, Gascon E, Gao F-B. 2011. MicroRNA-9: functional evolution of a conserved small regulatory RNA. RNA Biol. 8:557–564 [DOI] [PMC free article] [PubMed] [Google Scholar]
- 32. Shibata M, Nakao H, Kiyonari H, Abe T, Aizawa S. 2011. MicroRNA-9 regulates neurogenesis in mouse telencephalon by targeting multiple transcription factors. J. Neurosci. 31:3407–3422 [DOI] [PMC free article] [PubMed] [Google Scholar]
- 33. Bonev B, Pisco A, Papalopulu N. 2011. MicroRNA-9 reveals regional diversity of neural progenitors along the anterior-posterior axis. Dev. Cell 20:19–32 [DOI] [PMC free article] [PubMed] [Google Scholar]
- 34. Leucht C, Stigloher C, Wizenmann A, Klafke R, Folchert A, Bally-Cuif L. 2008. MicroRNA-9 directs late organizer activity of the midbrain-hindbrain boundary. Nat. Neurosci. 11:641–648 [DOI] [PubMed] [Google Scholar]
- 35. Laneve P, Gioia U, Andriotto A, Moretti F, Bozzoni I, Caffarelli E. 2010. A minicircuitry involving REST and CREB controls miR-9-2 expression during human neuronal differentiation. Nucleic Acids Res. 38:6895–6905 [DOI] [PMC free article] [PubMed] [Google Scholar]
- 36. Packer AN, Xing Y, Harper SQ, Jones L, Davidson BL. 2008. The bifunctional microRNA miR-9/miR-9* regulates REST and CoREST and is downregulated in Huntington's disease. J. Neurosci. 28:14341–14346 [DOI] [PMC free article] [PubMed] [Google Scholar]
- 37. Yoo AS, Sun AX, Li L, Shcheglovitov A, Portmann T, Li Y, Lee-Messer C, Dolmetsch RE, Tsien RW, Crabtree GR. 2011. MicroRNA-mediated conversion of human fibroblasts to neurons. Nature 476:228–231 [DOI] [PMC free article] [PubMed] [Google Scholar]
- 38. Kasinski AL, Slack FJ. 2011. Epigenetics and genetics. MicroRNAs en route to the clinic: progress in validating and targeting microRNAs for cancer therapy. Nat. Rev. Cancer 11:849–864 [DOI] [PMC free article] [PubMed] [Google Scholar]
- 39. Leucci E, Zriwil A, Gregersen LH, Jensen KT, Obad S, Bellan C, Leoncini L, Kauppinen S, Lund AH. 2012. Inhibition of miR-9 de-represses HuR and DICER1 and impairs Hodgkin lymphoma tumour outgrowth in vivo. Oncogene 31:5081–5089 [DOI] [PubMed] [Google Scholar]
- 40. Fischer L, Hummel M, Korfel A, Lenze D, Joehrens K, Thiel E. 2011. Differential micro-RNA expression in primary CNS and nodal diffuse large B-cell lymphomas. Neuro. Oncol. 13:1090–1098 [DOI] [PMC free article] [PubMed] [Google Scholar]
- 41. Inoue T, Iinuma H, Ogawa E, Inaba T, Fukushima R. 2012. Clinicopathological and prognostic significance of microRNA-107 and its relationship to DICER1 mRNA expression in gastric cancer. Oncol. Rep. 27:1759–1764 [DOI] [PubMed] [Google Scholar]
- 42. Zhou H, Huang X, Cui H, Luo X, Tang Y, Chen S, Wu L, Shen N. 2010. miR-155 and its star-form partner miR-155* cooperatively regulate type I interferon production by human plasmacytoid dendritic cells. Blood 116:5885–5894 [DOI] [PubMed] [Google Scholar]
- 43. Li G, Zhang L, Chen E, Wang J, Jiang X, Chen JH, Wickman G, Amundson K, Bergqvist S, Zobel J, Buckman D, Baxi SM, Bender SL, Casperson GF, Hu-Lowe DD. 2010. Dual functional monoclonal antibody PF-04605412 targets integrin alpha5beta1 and elicits potent antibody-dependent cellular cytotoxicity. Cancer Res. 70:10243–10254 [DOI] [PubMed] [Google Scholar]
- 44. Ricart AD, Tolcher AW, Liu G, Holen K, Schwartz G, Albertini M, Weiss G, Yazji S, Ng C, Wilding G. 2008. Volociximab, a chimeric monoclonal antibody that specifically binds alpha5beta1 integrin: a phase I, pharmacokinetic, and biological correlative study. Clin. Cancer Res. 14:7924–7929 [DOI] [PMC free article] [PubMed] [Google Scholar]
- 45. Khalili P, Arakelian A, Chen G, Plunkett ML, Beck I, Parry GC, Doñate F, Shaw DE, Mazar AP, Rabbani SA. 2006. A non-RGD-based integrin binding peptide (ATN-161) blocks breast cancer growth and metastasis in vivo. Mol. Cancer Ther. 5:2271–2280 [DOI] [PubMed] [Google Scholar]
- 46. Livant DL, Brabec RK, Pienta KJ, Allen DL, Kurachi K, Markwart S, Upadhyaya A. 2000. Anti-invasive, antitumorigenic, and antimetastatic activities of the PHSCN sequence in prostate carcinoma. Cancer Res. 60:309–320 [PubMed] [Google Scholar]
- 47. Stoeltzing O, Liu W, Reinmuth N, Fan F, Parry GC, Parikh AA, McCarty MF, Bucana CD, Mazar AP, Ellis LM. 2003. Inhibition of integrin alpha5beta1 function with a small peptide (ATN-161) plus continuous 5-FU infusion reduces colorectal liver metastases and improves survival in mice. Int. J. Cancer 104:496–503 [DOI] [PubMed] [Google Scholar]
- 48. Stragies R, Osterkamp F, Zischinsky G, Vossmeyer D, Kalkhof H, Reimer U, Zahn G. 2007. Design and synthesis of a new class of selective integrin alpha5beta1 antagonists. J. Med. Chem. 50:3786–3794 [DOI] [PubMed] [Google Scholar]
- 49. Zahn G, Vossmeyer D, Stragies R, Wills M, Wong CG, Löffler KU, Adamis AP, Knolle J. 2009. Preclinical evaluation of the novel small-molecule integrin alpha5beta1 inhibitor JSM6427 in monkey and rabbit models of choroidal neovascularization. Arch. Ophthalmol. 127:1329–1335 [DOI] [PubMed] [Google Scholar]
- 50. Huang C, Park CC, Hilsenbeck SG, Ward R, Rimawi MF, Wang Y-C, Shou J, Bissell MJ, Osborne CK, Schiff R. 2011. β1 integrin mediates an alternative survival pathway in breast cancer cells resistant to lapatinib. Breast Cancer Res. 13:R84 doi:10.1186/bcr2936 [DOI] [PMC free article] [PubMed] [Google Scholar]
- 51. Woods D, Cherwinski H, Venetsanakos E, Bhat A, Gysin S, Humbert M, Bray PF, Saylor VL, McMahon M. 2001. Induction of beta3-integrin gene expression by sustained activation of the Ras-regulated Raf-MEK-extracellular signal-regulated kinase signaling pathway. Mol. Cell. Biol. 21:3192–3205 [DOI] [PMC free article] [PubMed] [Google Scholar]
- 52. Aguirre Ghiso JA, Kovalski K, Ossowski L. 1999. Tumor dormancy induced by downregulation of urokinase receptor in human carcinoma involves integrin and MAPK signaling. J. Cell Biol. 147:89–104 [DOI] [PMC free article] [PubMed] [Google Scholar]
- 53. Barkan D, El Touny LH, Michalowski AM, Smith JA, Chu Davis IAS, Webster JD, Hoover S, Simpson RM, Gauldie J, Green JE. 2010. Metastatic growth from dormant cells induced by a col-I-enriched fibrotic environment. Cancer Res. 70:5706–5716 [DOI] [PMC free article] [PubMed] [Google Scholar]
- 54. Tabariès S, Dong Z, Annis MG, Omeroglu A, Pepin F, Ouellet V, Russo C, Hassanain M, Metrakos P, Diaz Z, Basik M, Bertos N, Park M, Guettier C, Adam R, Hallett M, Siegel PM. 2011. Claudin-2 is selectively enriched in and promotes the formation of breast cancer liver metastases through engagement of integrin complexes. Oncogene 30:1318–1328 [DOI] [PubMed] [Google Scholar]
- 55. Hollestelle A, Elstrodt F, Nagel JHA, Kallemeijn WW, Schutte M. 2007. Phosphatidylinositol-3-OH kinase or RAS pathway mutations in human breast cancer cell lines. Mol. Cancer Res. 5:195–201 [DOI] [PubMed] [Google Scholar]
- 56. Liu ML, Von Lintig FC, Liyanage M, Shibata MA, Jorcyk CL, Ried T, Boss GR, Green JE. 1998. Amplification of Ki-ras and elevation of MAP kinase activity during mammary tumor progression in C3(1)/SV40 Tag transgenic mice. Oncogene 17:2403–2411 [DOI] [PubMed] [Google Scholar]
- 57. Roberts PJ, Usary JE, Darr DB, Dillon PM, Pfefferle AD, Whittle MC, Duncan JS, Johnson SM, Combest AJ, Jin J, Zamboni WC, Johnson GL, Perou CM, Sharpless NE. 2012. Combined PI3K/mTOR and MEK inhibition provides broad antitumor activity in faithful murine cancer models. Clin. Cancer Res. 18:5290–5303 [DOI] [PMC free article] [PubMed] [Google Scholar]
- 58. Callahan MK, Rampal R, Harding JJ, Klimek VM, Chung YR, Merghoub T, Wolchok JD, Solit DB, Rosen N, Abdel-Wahab O, Levine RL, Chapman PB. 2012. Progression of RAS-mutant leukemia during RAF inhibitor treatment. N. Engl. J. Med. 367:2316–2321 [DOI] [PMC free article] [PubMed] [Google Scholar]
- 59. Cappellen D, Schlange T, Bauer M, Maurer F, Hynes NE. 2007. Novel c-MYC target genes mediate differential effects on cell proliferation and migration. EMBO Rep. 8:70–76 [DOI] [PMC free article] [PubMed] [Google Scholar]
- 60. Gravgaard KH, Lyng MB, Laenkholm A-V, Søkilde R, Nielsen BS, Litman T, Ditzel HJ. 2012. The miRNA-200 family and miRNA-9 exhibit differential expression in primary versus corresponding metastatic tissue in breast cancer. Breast Cancer Res. Treat. 134:207–217 [DOI] [PubMed] [Google Scholar]
Associated Data
This section collects any data citations, data availability statements, or supplementary materials included in this article.