

Abstract
The preeminent mode of action of the broad-spectrum antiviral nucleoside ribavirin in the therapy of chronic hepatitis C is currently unresolved. Particularly under contest are possible mutagenic effects of ribavirin that may lead to viral extinction by lethal mutagenesis of the hepatitis C virus (HCV) genome. We applied ultradeep sequencing to determine ribavirin-induced sequence changes in the HCV coding region (nucleotides [nt] 330 to 9351) of patients treated with 6-week ribavirin monotherapy (n = 6) in comparison to placebo (n = 6). Baseline HCV RNA levels maximally declined on average by −0.8 or −0.1 log10 IU/ml in ribavirin- versus placebo-treated patients. No general increase in rates of nucleotide substitutions in ribavirin-treated patients was observed. However, more HCV genome positions with high G-to-A and C-to-U transition rates were detected between baseline and treatment week 6 in ribavirin-treated patients in comparison to placebo-treated patients (rate of 0.0041 transitions per base pair versus rate of 0.0022 transitions per base pair; P = 0.049). Similarly, the sensitive detection of low-frequency minority variants by statistical filtering indicated significantly more positions with G-to-A and C-to-U transitions in ribavirin-treated patients than in placebo-treated patients (rate of 0.0331 transitions versus rate of 0.0186 transitions per G/C-containing position at baseline; P = 0.018). In contrast, non-ribavirin-associated A-to-G and U-to-C transitions were not enriched in the ribavirin group (P = 0.152). We conclude that ribavirin exerts a mutagenic effect on the virus in patients with chronic hepatitis C by facilitating G-to-A and C-to-U nucleotide transitions.
INTRODUCTION
The guanosine analogue ribavirin (1-β-d-ribofuranosyl-1,2,4-triazole-3-carboxamide) displays broad antiviral activity against RNA and DNA viruses in vitro and is used for the treatment of hepatitis C virus (HCV), respiratory syncytial virus (RSV), and Lassa fever virus infections (1–3). Monotherapy of patients with chronic HCV infection with ribavirin causes declining serum aminotransferase levels but leads to only a moderate and transient reduction of HCV RNA levels (4, 5). In spite of the inefficacy of ribavirin monotherapy, the drug acts synergistically with (pegylated) alpha interferon (IFN-α) during anti-HCV therapy, resulting in roughly 3-fold-enhanced sustained virologic response (SVR) rates compared to those resulting from interferon monotherapy (6, 7). Similar effects of ribavirin were observed for triple therapies of HCV genotype 1-infected patients that included direct antiviral agents. Here the addition of ribavirin to an NS3/4A protease inhibitor and pegylated IFN-α (PEG-IFN-α) resulted in increased antiviral efficacy and reduced viral breakthroughs associated with resistant viral variants (8–10). Furthermore, even in the context of a combination of two direct antiviral agents in patients with chronic hepatitis C which led to frequent treatment failure, the addition of ribavirin without PEG-IFN-α enhanced the initial virus decline and reduced the number of viral breakthrough events (11).
The preeminent mode of action of ribavirin in the therapy of chronic hepatitis C is unresolved. It was recently shown that ribavirin in conjunction with IFN-α/PEG-IFN-α induces the expression of specific interferon-stimulated genes (ISGs) in vitro and in vivo, thereby potentiating the anti-HCV effect of interferon (12–14). Other possible mechanisms of ribavirin action include the following models: strengthening of the adaptive antiviral immune response, impairment of the cellular enzyme IMP dehydrogenase (IMPDH), direct inhibition of the HCV nonstructural 5B (NS5B) RNA-dependent RNA polymerase, and exertion of a mutagenic effect on RNA viruses and the resulting error catastrophe (15, 16). The lack of proofreading activity of the HCV polymerase results in a population of divergent but closely related viruses, termed viral quasispecies, that optimizes viral evolutionary fitness by maximizing genetic variation. Quasispecies are assumed to exist at the edge of a genomic error threshold (17). Exceeding this error threshold may lead the quasispecies into a sequence of error catastrophes, termed lethal mutagenesis, that results in viral extinction (15, 18). The application of a model poliovirus polymerase showed that the incorporation of ribavirin templates the incorporation of cytidine and uridine, leading to a mutagenic effect which coincided with reduced poliovirus infectivity as well as with the observation of G-to-A and C-to-U transitions in mutagenized genomes (19). Ribavirin-induced mutagenesis of the HCV genome has been demonstrated in vitro based on sequenced isolates from ribavirin-treated HCV cell culture systems (20–22). Furthermore, HCV cell culture experiments revealed the selection of several HCV mutations (23, 24) as well as changes in the cell line (23), both conferring ribavirin resistance. In vivo analyses of ribavirin-induced mutations in the HCV genome, on the other hand, remain inconclusive. Several studies reported selective mutations in NS5A/B as well as increased nucleotide substitution rates consistent with G-to-A and C-to-U nucleotide transitions in NS3/NS5B in patients under ribavirin monotherapy (25–27). Also, in patients undergoing therapy with IFN-α plus ribavirin, an increased mutation rate and a mutational spectrum with increased G-to-A and C-to-U transitions were detected during treatment based on E1/E2 and NS5A sequencing studies (28). A greater nucleotide sequence variation with an increase in C-to-U transitions within NS3 and NS5B was also observed for patients treated with a NS3 inhibitor and a NS5B inhibitor in combination with ribavirin-containing regimens (29). In contrast, other results showed only transient (30) or no (31) increases in substitution rates in NS5B and NS3/4A, respectively. Selection for a ribavirin-associated resistance mutation in NS5B that is suggestive of a mutagenic effect of ribavirin (26) was not verified in nonresponder patients who were treated with ribavirin in combination with IFN-α or PEG-IFN-α (32). In this study, we employed ultradeep sequencing of the HCV coding region (nucleotides [nt] 330 to 9351) in order to investigate the ribavirin-induced mutagenesis of the viral quasispecies in detail over time in 12 patients under ribavirin monotherapy versus placebo.
MATERIALS AND METHODS
Patients.
In a prospective, randomized, placebo-controlled study, 68 patients with chronic HCV genotype 1 infection were randomized and treated at the University Hospitals in Frankfurt, Berlin, Hannover, and Homburg/Saar, Germany, as well as at an Independent Medical Center in Frankfurt between 2007 and 2010. Initially, for 6 weeks, patients received either placebo or ribavirin at 1,000 to 1,200 mg per day according to body weight or 180 μg PEG-IFN-α2a per week. Subsequently, all patients received antiviral treatment according to the standard of care (180 μg PEG-IFN-α-2a once weekly plus 1,000 to 1,200 mg ribavirin daily, body weight adapted) (56). For deep-sequencing analysis of HCV quasispecies, serum samples during monotherapy were selected from 12 patients (HCV subtype 1b [n = 6], ribavirin [n = 6], and placebo) at baseline (before treatment) and at treatment day 42. Enrollment in the clinical study as well as the usage of patient serum samples for HCV sequencing studies were approved by the local ethics committee, and written informed consent was obtained from all patients. Quantitative HCV RNA measurement was performed by using a commercially available assay (COBAS AmpliPrep/COBAS TaqMan HCV test; Roche Diagnostics).
HCV RNA extraction, reverse transcription, and PCR.
For HCV RNA extraction, 140 μl of serum was used (QIAamp viral RNA minikit; Qiagen, Hilden, Germany). cDNA synthesis was performed in triplicates by using SuperScript III reverse transcriptase (Invitrogen) with random or specific primers and 8 μl of viral RNA corresponding to 0.5 μg of viral RNA on average. Amplification of the HCV genome from the 5′ N-terminal region (NTR) to NS5B (nt 145 to 9351) occurred in 5 overlapping PCR amplicons with gene-specific primers for outer and inner nested PCRs. Patient-specific primers were designed after sequencing and alignment of the primer binding regions of all patients. Nested PCRs were conducted with 1/20 of cDNA or outer PCR product, using the Expand High FidelityPlus PCR system (Roche Applied Science) containing a DNA polymerase and a proofreading protein. Primer sequences and PCR conditions are listed in Table S1 in the supplemental material. The resulting amplicons were analyzed for correct size and purity on 0.8% agarose gels stained with ethidium bromide.
Deep sequencing.
For a first analysis, four patients (ribavirin-treated patients 1 and 2 and placebo-treated patients 7 and 8) were selected for 454 deep sequencing. Based on the results for the comparison of mutational frequencies among baseline, day 7, day 21, and day 42 of treatment with ribavirin versus placebo, eight additional patients (ribavirin-treated patients 3 to 6 and placebo-treated patients 9 to 12) were subsequently enrolled for deep sequencing analysis (Illumina technology) at baseline and day 42. Per patient and time point, five HCV amplicons were generated for deep sequencing analysis. All amplicons were purified by using Agencourt CleanSeq beads on a BioMek NX workstation (Beckman Coulter), quantified fluorometrically on a FluoStar Optima instrument (BMG Labtech) by using Quant-iT Picogreen double-stranded DNA (dsDNA) reagent (Invitrogen), and sample-specific amplicons were pooled equimolarly for library preparation.
For 454 deep sequencing, amplicons were fragmented by nebulization. Next, a sizing solution was applied to remove fragments shorter than 400 bp on a BioMek NX workstation, and the size distribution of the DNA was confirmed by a 2100 Bioanalyzer (Agilent Technologies). DNA adaptors containing primer binding sites for deep sequencing as well as multiplex identifiers (MIDs) for sample bar coding were ligated into the purified DNA fragments by using a GS FLX Titanium Rapid Library Preparation kit (Roche Applied Science). The library was subjected to emulsion PCR for clonal amplification of DNA fragments on water-in-oil emulsion microreactors followed by enrichment and counting of DNA containing beads (GS FLX Titanium LV emPCR kit [Lib-L] and GS FLX Titanium emPCR breaking kit LV/MV 12pc; Roche Applied Science). Subsequently, microbeads were collected and loaded onto the PicoTiter plate of the FLX Genome Sequencer (Roche Applied Science). 454 FLX second-generation sequencing technology with an average read length of 400 bp was performed according to the manufacturer's protocols by using the GS FLX Titanium sequencing kit (Roche Applied Science).
For the preparation of libraries for Illumina deep sequencing, equimolarly pooled amplicons were “tagmentated” (fragmented and tagged) by using a Nextera DNA sample preparation and index kit (Illumina) according to the manufacturer's manual. DNA fragments shorter than 400 bp were removed as described above. Resulting libraries were quantified on a 2100 Bioanalyzer (Agilent Technologies) and diluted to 10 pM for cluster generation and subsequent sequencing on an Illumina MiSeq platform using the paired-end sequencing protocol for 2× 250-bp runs.
The theoretical mean coverages were calculated to be approximately 4,900 reads by using the 454 platform and 8,200 reads by using Illumina deep sequencing technology, assuming optimal quantity and length of generated reads (see Tables S3 and S4 in the supplemental material for the actual coverages). To compare 454 and Illumina deep sequencing, one patient sample was sequenced at baseline and at day 42 with both platforms, and the generated reads were compared. Although variants determined by the 454 and Illumina platforms were highly correlated, we computed substitution and nucleotide transition rates exclusively on pairs of samples that underwent identical library preparation and that were sequenced on the same platform and the same sequencing run. After nucleotide transition and substitution rates were thus generated in a platform-dependent manner, these quantities were combined and subjected to further statistical analysis.
Mapping of deep sequencing data.
A standard flowgram format (SFF) file containing the nucleotide sequence reads was generated for each sequenced sample by the 454 sequencing software (GS Run Processor; Roche Applied Sciences) provided with the instrument. Reads produced by Illumina software were provided in FASTQ format. Subsequently, Phred quality scores were extracted from the reads, and primer sequences were removed from the start of the reads. For 454 reads, bases succeeding the first base call with a Phred quality score below 10 were trimmed, as reported in previous studies (33), and reads produced by the Illumina platform were trimmed to a Phred quality score of 20. We note that Phred scores have a slightly different interpretation on both platforms, denoting the probability of a miscalled base and incorrect read length for Illumina and 454 technologies, respectively. Reads with no “N” base calls and a length of more than 25 bases were retained, and quality control metrics were computed for the trimmed reads to ensure consistent high quality across all samples. The resulting high-quality reads were mapped to the HCV-J reference genome (34) with the gapped read mapper SMALT (Wellcome Trust Sanger Center), the successor of the popular long-read mapper SSAHA2 (35) that displays increased specificity and sensitivity according to both the original authors and external validations (36). Base insertions and deletions, both common errors in deep sequencing, were detected and marked in the alignment and were not included in subsequent evaluations. Subsequently, nucleotide variant distributions were called for each variant position in the alignment (nt 330 to 9351) by the SAMtools suite (37). The uniformity of the base distribution at each alignment position was quantified with an entropy measure. HCV sequences from patient samples taken at baseline and during ribavirin monotherapy and placebo treatment, respectively, were compared.
Variant calling.
For each base position of an aligned read set (HCV coding region at nt 330 to 9351) at two time points, t1 and t2 (baseline and day 42, respectively), we consider the frequencies of the single bases A, C, G, and T. The predominant substitution rate, S, at a specific position describes the dominant base mutation comparing time points t1 and t2: S (t1, t2) = max [|Freqt1(B) − Freqt2(B)|] (where B is A, C, G, or U).
Based on previous approaches (26, 27), at each position, an indicator, T, of ribavirin-supported transition rates comparing time points t1 and t2 is defined as follows: T (t1, t2) = 1/2 {[Freqt2(A) − Freqt2(G)] − [Freqt1(A) − Freqt1(G)] + [Freqt2(U) − Freqt2(C)] − [Freqt1(U) − Freqt1(C)]}.
Transitions from G to A and C to U are considered to be facilitated by ribavirin (19, 20, 25, 27, 28, 38). A cutoff value of 0.4 for the evaluation of substitution rates and transition rates was chosen from a first evaluation of a first patient treated with ribavirin compared with a patient treated with placebo by comparing several possible values. Unfortunately, the limited number of patients in this study does not allow a refined optimization of the cutoff levels.
Investigation of deep sequencing error rates.
In order to determine the technical error rates of library preparation and deep sequencing using 454 and Illumina platforms, amplicon 3 (2,228-bp fragment ranging from NS3 to NS4B) of one patient and time point was cloned into a pSC-A-amp/kan vector and transformed into Escherichia coli competent cells (StrataClone PCR cloning kit; Agilent Technologies). The plasmid DNA was purified (QIAprep Spin miniprep kit; Qiagen) and Sanger sequenced with M13 forward and reverse as well as internal template-specific primers (see Table S2 in the supplemental material), according to the manufacturer's protocol (BigDye Terminator v1.1 cycle sequencing kit; Applied Biosystems), on an ABI Prism 3130xl genetic analyzer (Applied Biosystems). The insert of one sequenced plasmid clone was excised from the vector with the restriction enzyme EcoRI and was deep sequenced in parallel with the other PCR amplicon samples. In accordance with other studies (33, 39–43), the technical error rate was calculated by counting all nucleotide variants of the plasmid reads in the alignment that did not correspond to the sequence of the clone determined by Sanger sequencing. While insertion errors were subject to automatic removal during the mapping of the sequencing reads to the HCV-J reference genome (34), deletions with respect to the reference sequence were detected during the mapping and quantified as errors but excluded from all further analyses.
Minority variant calling based on a statistical filtering procedure.
Low-frequency nucleotide variants were distinguished from technical errors by utilizing the statistical filtering procedure deepSNV (where SNV is single-nucleotide variants) (44). The filtering procedure estimates sequence-specific and strand-specific error rates to derive a position-wise test statistic for reliably identifying low-frequency minority variants that display increased frequencies in a test sample compared to a given control. Using this method, we computed FDR (false discovery rate)-corrected P values for all nucleotide variants. To calculate ribavirin-supported G-to-A and C-to-U nucleotide transitions between two time points, only positions within the HCV coding region (nt 330 to 9351) containing a G or C in the consensus baseline sequence were considered. At these positions, variants were considered for further analysis if they showed a significant increase of A or U frequencies, respectively, between two time points, as characterized by a position-wise P value of the statistical filtering procedure below a cutoff of 0.001. The computation of non-ribavirin-associated A-to-G and U-to-C transitions occurred analogously to the calculation described above. Thereby, variants with a significant increase of G or C between both time points were considered at positions with an A or U in the consensus baseline sequence.
Statistical analysis.
The predominant substitution rate, S, and the nucleotide transition rate, T, of ribavirin- and placebo-treated patients were compared by random-effect models for these rates and testing for group effects. Statistical analysis was conducted based on the metaprop procedure of the meta package by Guido Schwarzer for R software (R Foundation for Statistical Computing, Vienna, Austria). P values of less than 0.05 were considered significant.
Deep sequencing data access.
The deep sequencing data from this study have been deposited in the Sequence Read Archive (SRA) under accession number ERP001566.
RESULTS
HCV RNA kinetics and analysis of deep sequencing.
For the investigation of ribavirin-induced mutations, we used clinical serum samples from HCV genotype 1-infected patients (see Materials and Methods). We selected an overall number of 12 patients (n = 6 for ribavirin; n = 6 for placebo) with the same HCV genotype (GT1b) and similar HCV RNA concentrations (between around 1 × 10⁶ and 1.5 × 10⁷ IU/ml) before initiation of therapy (baseline) for deep sequencing analysis of the HCV quasispecies. As it is not known whether a mutagenic effect of ribavirin would be reflected by a decline of the HCV RNA concentration, we chose patients under ribavirin monotherapy or placebo treatment who displayed various HCV kinetics (Fig. 1A). On average, baseline HCV RNA levels maximally decreased by −0.8 or −0.1 log10 IU/ml in ribavirin- versus placebo-treated patients. 454 deep sequencing of the HCV quasispecies from four patients (see Materials and Methods) during the 6-week monotherapy resulted in an average of 160,250 sequenced reads per sample, with a mean read length of 316.6 bp after removing low-quality bases. A total of 99.1% of high-quality reads could be unambiguously aligned to the HCV-J reference genome, resulting in a mean minimum coverage (averaged over all patients and positions) of 4,394.3 (range, 597 to 17,542) reads per position for the 454 platform (Fig. 1B). Samples from further patients included in the study (ribavirin-treated patients 3 to 6 and placebo-treated patients 9 to 12) were sequenced by using the Illumina platform, which produced an average of 527,968 high-quality reads per sample, with a mean read length of 133.4 bp after clipping of bases with low quality. The alignment of 94.9% of high-quality reads to the HCV-J reference genome (34) gave rise to a mean minimum coverage of 4,649.2 (range, 0 to 27,033) reads per position (Fig. 1C). We observed a decreased coverage of the Illumina sequencing reads between positions 1500 and 1550 (E2) and at position 8627 (NS5B). The reduced coverage within E2 is attributed mainly to hypervariable region 1 (HVR-1), which is known to produce difficulties during the alignment process due to its high variability. Furthermore, the Nextera method used for library preparation for Illumina deep sequencing was shown to produce biased data sets (45). As position 8627 is located before a large G/C stretch, this may influence the recovery of these sequences during library preparation. Nonetheless, during statistical filtering, positions with low coverages are rejected from further analyses. To compare the sequencing results produced by 454 and Illumina deep sequencing, two samples (baseline and day 42) from one patient were each processed with both platforms. The nucleotide ratios of these samples were compared between the 454 and the Illumina data, and an R-squared correlation resulted in a correlation of >0.995 for the ratios of all four nucleotides (A, C, G, and T). Alignment of the deep sequencing reads produced nucleotide counts of the four possible bases (A, C, G, and U) at every position of the HCV-J reference genome (34). These nucleotide counts were analyzed for each sample and compared between baseline and day 42 in order to investigate a potential ribavirin-induced increase in the number of nucleotide substitutions.
Fig 1.

Deep sequencing of HCV quasispecies of 12 patients during the 6-week monotherapy phase (n = 6 for ribavirin; n = 6 for placebo). For each patient, samples were sequenced at two time points (baseline and day 42) during monotherapy. (A) HCV RNA kinetics for selected patients during monotherapy. (B) Minimal coverage of the HCV genome (nt 330 to 9351) after 454 deep sequencing of PCR amplicons (A1 to A5) averaged over two patients who received ribavirin monotherapy and two patients who received placebo. (C) Minimal coverage of the HCV genome (nt 330 to 9351) after Illumina deep sequencing of PCR amplicons (A1 to A5) of ribavirin-treated (n = 4) and placebo-treated (n = 4) patients.
Ribavirin does not generally induce mutations in the HCV genome.
To determine whether ribavirin treatment is associated with the fixation of mutations in the HCV genome, we estimated S, the change rate of the predominant substitution between two consecutive sampling time points (see Materials and Methods). S values exceeding a 40% threshold, indicating large changes of the HCV quasispecies, were observed at slightly more HCV genome positions in patients undergoing ribavirin monotherapy than in patients receiving placebo between baseline and day 42 (rate of 0.0085 substitutions per base pair versus rate of 0.0052 substitutions per base pair) (Table 1 and Fig. 2). However, no significant differences between the ribavirin group and the placebo group were detected (P = 0.230), and no local clustering of S values within the HCV genome of patients treated with ribavirin was detected (Fig. 2). This indicates that ribavirin does not lead to a generally increased mutation rate.
Table 1.
Comparison of predominant substitution rates and transition rates of HCV quasispecies between patients treated with ribavirin and those treated with placebo between baseline and day 42 of the studya
| Patientc | S (per 9,022 nt)b | Rate of S (per bp) | 95% confidence interval for S | T (per 9,022 nt)b | Rate of T (per bp) | 95% confidence interval for T |
|---|---|---|---|---|---|---|
| Rbv Pat 1 | 98 | 0.0085 | 0.0056–0.0127 | 47 | 0.0041 | 0.0027–0.0063 |
| Rbv Pat 2 | 143 | 72 | ||||
| Rbv Pat 3 | 94 | 42 | ||||
| Rbv Pat 4 | 18 | 4 | ||||
| Rbv Pat 5 | 134 | 62 | ||||
| Rbv Pat 6 | 48 | 24 | ||||
| Plac Pat 7 | 57 | 0.0052 | 0.0027–0.0102 | 24 | 0.0022 | 0.0014–0.0034 |
| Plac Pat 8 | 39 | 14 | ||||
| Plac Pat 9 | 21 | 10 | ||||
| Plac Pat 10 | 156 | 44 | ||||
| Plac Pat 11 | 41 | 19 | ||||
| Plac Pat 12 | 35 | 18 |
The P value for S was 0.230, and the P value for T was 0.049. S, substitution rate; T, transition rate.
Indicated is the number of HCV genome positions with changes in the respective parameter exceeding a 0.4 cutoff threshold referring to the entire analyzed HCV coding region (nt 330 to 9351).
Rbv Pat, patient given ribavirin; Plac Pat, patient given placebo.
Fig 2.
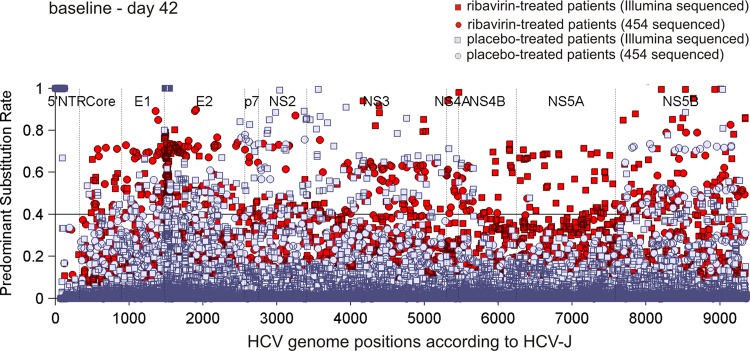
HCV genome positions for ribavirin- versus placebo-treated patients with changes in predominant substitution rates. The horizontal line at the 0.4 level represents the cutoff used for the evaluation of the predominant substitution rate, S, between baseline and day 42.
Accumulation of ribavirin-induced nucleotide transitions.
Misincorporation of the guanosine analogue ribavirin in the viral RNA results in mutation of the viral genome by acting as a nonspecific nucleotide template for the incorporation of both cytidine and uridine. This mutagenic effect may lead the viral quasispecies into error catastrophe and lethal mutagenesis (15, 19). Increased nucleotide substitution rates and accumulation of G-to-A and C-to-U transitions within NS3 and NS5B of patients with chronic HCV infection receiving ribavirin monotherapy support this hypothesis (27). We computed the change in substitution rates of ribavirin-associated transitions, T (G to A and C to U), between baseline and day 42 by expanding on approaches introduced in previous work (26, 27) (see Materials and Methods). Patients under ribavirin monotherapy exhibited significantly more HCV genome positions with large (T > 40%) increases in rates of ribavirin-associated transitions than the placebo group (rate of 0.0041 transitions per base pair versus rate of 0.0022 transitions per base pair; P = 0.049) (Table 1 and Fig. 3) between baseline and day 42. An enhancement of ribavirin-associated transitions in ribavirin-treated patients was still observable after small alterations of the 0.4 cutoff level. To characterize the mutation spectrum at baseline, quasispecies entropy was calculated for all samples at baseline. Entropy was determined to be highly similar for the ribavirin and placebo groups, indicating similar mutation spectra at baseline. Furthermore, the frequency of positions with a C/G in the baseline consensus sequences was comparable between ribavirin- and placebo-treated patients (data not shown). Moreover, we did not observe any favored localization of ribavirin-associated transitions within the HCV genome of ribavirin-treated patients (Fig. 3).
Fig 3.
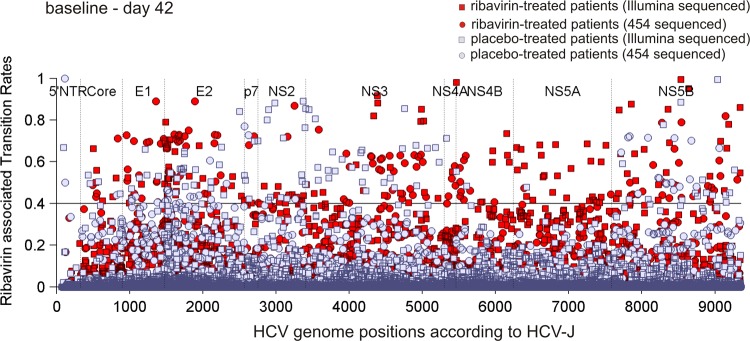
Comparison of HCV genome positions with changes in nucleotide transition rates, T, comprising G-to-A and C-to-U transitions between patients receiving ribavirin and those receiving placebo, respectively. The cutoff used for the assessment of the nucleotide transition rate, T, between baseline and day 42 is depicted by the horizontal line at the 0.4 level.
Analysis after statistical filtering procedure.
In order to differentiate low-frequency nucleotide variants from technical errors, we applied an involved statistical filtering procedure that allows the identification of such minority variants with high sensitivity and specificity (44). Using this method, P values were computed for each HCV genome position, quantifying the significance of occurring nucleotide substitutions between two time points. Ribavirin-supported G-to-A and C-to-U nucleotide transitions were calculated by considering only positions which exhibited a G or a C in the consensus sequence at baseline and displayed a significant (α = 0.001) increase in A and U frequencies, respectively, between baseline and day 42. Based on the application of this strategy for filtering of deep sequencing data, we confirmed that patients under ribavirin monotherapy display significantly more HCV genome positions with significant G-to-A and C-to-U transitions than patients treated with placebo (rate of 0.0331 transitions versus rate of 0.0186 transitions per G/C-containing position at baseline; P = 0.018) (Table 2). Furthermore, ribavirin-induced transitions did not display a preferred nucleotide signature in ribavirin-treated patients in comparison to placebo-treated patients, indicating that these transitions do not occur in a certain context of surrounding nucleotides (data not shown).
Table 2.
Number of HCV genome positions from patients treated with ribavirin and placebo after application of statistical filteringa
| Patient | No. of ribavirin-associated transitions per G/C-containing position | Rate of ribavirin-associated transitions per G/C-containing bp | 95% confidence interval |
|---|---|---|---|
| Rbv Pat1 | 148/5,307 | 0.0331 | 0.0228–0.0479 |
| Rbv Pat 2 | 105/5,319 | ||
| Rbv Pat 3 | 339/5,307 | ||
| Rbv Pat 4 | 111/5,334 | ||
| Rbv Pat 5 | 209/5,360 | ||
| Rbv Pat 6 | 234/5,292 | ||
| Plac Pat 7 | 60/5,271 | 0.0186 | 0.0138–0.0250 |
| Plac Pat 8 | 91/5,267 | ||
| Plac Pat 9 | 106/5,289 | ||
| Plac Pat 10 | 87/5,273 | ||
| Plac Pat 11 | 174/5,255 | ||
| Plac Pat 12 | 96/5,276 |
Statistical filtering considers positions with a significant increase (α = 0.001) in A and U frequencies between baseline and day 42 related to the number of positions showing a G or C, respectively, in the baseline consensus sequence. The P value was 0.018.
We intended to determine whether differences from ribavirin-supported transitions originate from many small or from large transitions. Therefore, we analyzed the magnitude and the corresponding frequencies of G-to-A and C-to-U transitions and compared the results before and after application of the data-filtering strategy (Fig. 4A and B). Both before and after filtering of deep sequencing data, ribavirin-treated patients displayed an overall increase in the number of G-to-A and C-to-U transitions in comparison to placebo-treated patients between baseline and day 42 that encompassed small, medium, and large changes in ribavirin-associated transitions, T. Application of the statistical filtering procedure especially eliminated variants with nonsignificant small changes, affirming the importance of this method for differentiating genuine variants from technical errors. However, when small nucleotide transition changes (including changes of <40%) were included in the analysis without statistical filtering, we observed no significant differences between the ribavirin and the placebo groups, indicating that ribavirin-associated transitions are generated predominantly via medium and large nucleotide changes. Transitions in the reverse direction (A-to-G and U-to-C) were not significantly enhanced in ribavirin-treated patients in comparison to placebo-treated patients (rate of 0.0184 transitions versus rate of 0.0128 transitions per A/U-containing position at baseline; P = 0.152) (Table 3) between baseline and day 42. Therefore, the mutagenic effect of ribavirin is attributed mainly to the generation of G-to-A and C-to-U transitions.
Fig 4.

Occurrence of ribavirin-associated G-to-A and C-to-U transitions between baseline and day 42 in the HCV genome of ribavirin- and placebo-treated patients. The vertical dashed line at the 0.4 level displays the cutoff, which was applied to differentiate small versus medium/large changes in ribavirin-associated transitions. (A) Frequency of HCV genome positions with changes in ribavirin-associated transitions before statistical filtering of deep sequencing data. All HCV genome positions with transition changes are shown. (B) Frequency of HCV genome positions with changes in ribavirin-associated transitions after application of statistical filtering. HCV genome positions with significant transition changes are represented.
Table 3.
HCV genome positions from patients treated with ribavirin and placebo after application of statistical filteringa
| Patient | No. of non-ribavirin-associated transitions per A/U-containing position | Rate of non-ribavirin-associated transitions per A/U-containing bp | 95% confidence interval |
|---|---|---|---|
| Rbv Pat1 | 85/3,712 | 0.0184 | 0.0131–0.0256 |
| Rbv Pat2 | 48/3,698 | ||
| Rbv Pat3 | 98/3,711 | ||
| Rbv Pat4 | 25/3,684 | ||
| Rbv Pat5 | 108/3,656 | ||
| Rbv Pat6 | 76/3,725 | ||
| Plac Pat 7 | 19/3,748 | 0.0128 | 0.0090–0.0183 |
| Plac Pat 8 | 56/3,753 | ||
| Plac Pat 9 | 48/3,732 | ||
| Plac Pat 10 | 82/3,686 | ||
| Plac Pat 11 | 71/3,766 | ||
| Plac Pat 12 | 34/3,744 |
Statistical filtering considers positions with a significant increase (α = 0.001) in G and C frequencies between baseline and day 42 related to the number of positions showing an A or U, respectively, in the baseline consensus sequence. The P value was 0.152.
Determination of deep sequencing error rates.
In order to estimate the technical error rate of our sequencing approach, a plasmid-amplified clonal sample of a fragment ranging from NS3 to NS4B was sequenced by using 454 and Illumina technologies with the same parameters as those used for samples from the main study. Sequencing reads and nucleotide distributions from this positive control were compared with the Sanger sequence corresponding to the clone, which also matched the consensus sequences generated from the 454 and Illumina reads. Sanger sequencing is commonly used as a comparator for the determination of deep sequencing errors (33, 40–42) and is expected to have an error rate of 0.01% (46) to 1% (47), depending on the software applied (48). All sequenced nucleotides differing from the Sanger sequence were considered technical errors attributable to library preparation and the sequencing process. Following this protocol, we estimated a technical error rate of 0.507% erroneous substitutions per sequenced nucleotide for 454 deep sequencing and an error rate of 0.036% erroneous substitutions per sequenced nucleotide for Illumina deep sequencing. These rates include mismatches (454, 0.158%; Illumina, 0.035%) and deletions (454, 0.349%; Illumina, 0.001%) while excluding insertion errors due to the particularities of the alignment process (see Materials and Methods).
DISCUSSION
Existing studies on the preeminent mode of action of ribavirin in HCV therapy and particularly the significance of ribavirin-induced mutagenesis remained inconclusive. Several in vitro analyses of poliovirus (19, 38, 49), GB virus B (50), hantaan virus (51), and foot-and-mouth disease virus (52) showed that ribavirin exhibits mutagenic properties. In contrast, studies investigating ribavirin-induced HCV mutagenesis in patients receiving ribavirin monotherapy concentrated mainly on the analysis of small regions of the HCV genome (NS3, NS5A, and NS5B) via standard clonal sequencing or direct sequencing of PCR products at a depth of about 30 clones per time point, which yielded contradictory results (25–27, 30, 31). We performed deep sequencing of the complete HCV coding region of patients with chronic hepatitis C undergoing ribavirin monotherapy in order to analyze systematically and with high sensitivity whether ribavirin induces nucleotide substitutions. An increased mutation rate may indicate an error catastrophe, which is followed by viral extinction. Alternatively, it is also conceivable that viruses which are generated in the presence of ribavirin display decreased infectivity and reduced replication capacities (53), which could lead, in combination with interferon, to the antiviral effect against HCV (54). Our results do not reveal significantly higher frequencies of predominant substitutions in ribavirin-treated patients, indicating that the number of mutations is not generally increased. As during ribavirin monotherapy, only a slight reduction of the HCV load is detectable, a continuous accumulation of mutations with a consecutive increasing probability for the generation of defective viruses is presumably not taking place. The mutagenic effect of ribavirin seems to lead rather to the continuous production of new viruses with increased numbers of ribavirin-induced mutations incorporated, which exhibit slightly reduced replication capacity and/or infectivity, thereby explaining the weak HCV load reduction. This may result in a continuous process with a constant exchange of viral variants. In the present study, we demonstrate that during the 6-week ribavirin monotherapy, the rate of G-to-A and C-to-U transitions, which are specifically induced by the guanosine analogue ribavirin, is enhanced within the HCV genome of ribavirin-treated patients in comparison to placebo-treated patients. In a subgroup of four patients, additional time points between baseline and day 42 (day 7 and day 21) were investigated. In line with our hypothesis, here we observed significant mutational differences between each time point without an overall constant increase in the rate of mutations from baseline to day 42 (data not shown).
The observed transitions were not limited to NS3 and NS5B, as reported previously (27), but occurred throughout the full HCV genome, with no preferential location of transitions in certain HCV genome regions.
In principle, ultradeep sequencing allows the sensitive detection of HCV variants. Nevertheless, it is critical to differentiate minor variants from technical errors associated with library preparation and the sequencing process. By sequencing a clonal fragment, we determined for the 454 platform and the Illumina platform error rates in good accordance with data from previous studies (39, 41, 43, 45, 55). Although specialized software for additional error correction exists (33, 40), we refrained from employing it in this setting due to the risk of discarding genuine minority variants. Instead, we applied an alternative approach that explicitly incorporates error modeling into the calculation of changes in variant frequencies between two time points (see below). Furthermore, a quality control of deep sequencing reads ensured that only reads with high-quality scores and sufficient read length were used for mapping and downstream analyses (see Materials and Methods). In order to discriminate low-frequency nucleotide variants from technical errors, we employed deepSNV, a statistical filtering procedure that calculates the significance of changes in variant frequencies between two time points for each HCV genome position. Although this method was validated on virus data generated by the Illumina platform, the underlying mathematical model of deepSNV does not make assumptions about the sequencing platform or platform-specific error patterns and is thus also generally applicable to 454 data (N. Beerenwinkel, personal communication). To estimate the genuine number of ribavirin-supported G-to-A and C-to-U transitions, only positions with significant increases in these transitions were considered. This additional analysis confirms our results, further supporting the conclusion that patients under ribavirin monotherapy exhibit significantly more HCV genome positions with G-to-A and C-to-U transitions than do placebo-treated patients. Moreover, non-ribavirin-associated A-to-G and U-to-C transitions were not significantly enriched in ribavirin-treated patients, indicating that ribavirin specifically induces G-to-A and C-to-U transitions.
Both analyses (with and without statistical filtering) show that ribavirin-supported transitions occur as small, medium, and large changes in nucleotide substitutions between two time points. Differences in medium- and high-frequency transitions (>40% change) between both patient groups could readily be detected without statistical filtering of the deep sequencing data. In ribavirin-treated patients, small transition changes (including changes of <40%) were not significantly enriched, suggesting that ribavirin-associated transitions originate mainly from medium and large nucleotide changes. However, statistical filtering was essential for distinguishing low-level transitions from technical errors in both patient groups, underlining the importance of the statistical filtering method, particularly for the sensitive detection of minority variants.
Nevertheless, our study has several limitations. Due to difficulties of full-length HCV genome amplification and the high costs of deep sequencing of the entire HCV genome, we were able to sequence the HCV genomes of only a limited number of patients. Therefore, our results do not allow a direct conclusion on the extent of the effect of ribavirin-induced mutagenesis on virologic response. The clinical results of the study in which the patients analyzed here were included are reported elsewhere (56). Furthermore, we have not yet performed functional analyses to clarify the potential mechanism of action of ribavirin-induced mutagenesis.
Finally, our findings do not readily explain the enhanced virological response rates for treatment with IFN-α in combination with ribavirin. It is conceivable that the clinical effect of ribavirin may be at least partially mediated by resetting the IFN responsiveness in the liver (14). In conclusion, this explorative study analyzed ribavirin-induced mutations with high sensitivity and demonstrated that ribavirin induces nucleotide transitions during monotherapy. This effect seems to be a relevant factor for the antiviral activity of ribavirin, which is independent of the additional application of PEG-IFN-α and may explain the efficiency of ribavirin in combination with other direct-acting antivirals. The observed mutagenesis of the HCV genome in patients undergoing ribavirin monotherapy is based on the generation of G-to-A and C-to-U transitions. Ribavirin-induced mutagenesis does not explain the normalization of serum aminotransferase levels observed in patients undergoing ribavirin monotherapy, which we also detected in the patients analyzed here. Therefore, other mechanisms of action are likely also involved in the antiviral activity of ribavirin.
Supplementary Material
ACKNOWLEDGMENT
This study was supported by a DFG grant to Eva Herrmann, Wolf Peter Hofmann, Ulrike Mihm, Christoph Sarrazin, Sven-Eric Schelhorn, and Stefan Zeuzem (Klinische Forschergruppe, KFO 129).
Footnotes
Published ahead of print 27 March 2013
Supplemental material for this article may be found at http://dx.doi.org/10.1128/JVI.02778-12.
REFERENCES
- 1. Sidwell RW, Huffman JH, Khare GP, Allen LB, Witkowski JT, Robins RK. 1972. Broad-spectrum antiviral activity of Virazole: 1-beta-D-ribofuranosyl-1,2,4-triazole-3-carboxamide. Science 177:705–706 [DOI] [PubMed] [Google Scholar]
- 2. Streeter DG, Witkowski JT, Khare GP, Sidwell RW, Bauer RJ, Robins RK, Simon LN. 1973. Mechanism of action of 1-D-ribofuranosyl-1,2,4-triazole-3-carboxamide (Virazole), a new broad-spectrum antiviral agent. Proc. Natl. Acad. Sci. U. S. A. 70:1174–1178 [DOI] [PMC free article] [PubMed] [Google Scholar]
- 3. Crotty S, Cameron C, Andino R. 2002. Ribavirin's antiviral mechanism of action: lethal mutagenesis? J. Mol. Med. 80:86–95 [DOI] [PubMed] [Google Scholar]
- 4. Di Bisceglie AM, Shindo M, Fong TL, Fried MW, Swain MG, Bergasa NV, Axiotis CA, Waggoner JG, Park Y, Hoofnagle JH. 1992. A pilot study of ribavirin therapy for chronic hepatitis C. Hepatology 16:649–654 [DOI] [PubMed] [Google Scholar]
- 5. Pawlotsky JM, Dahari H, Neumann AU, Hezode C, Germanidis G, Lonjon I, Castera L, Dhumeaux D. 2004. Antiviral action of ribavirin in chronic hepatitis C. Gastroenterology 126:703–714 [DOI] [PubMed] [Google Scholar]
- 6. Poynard T, Marcellin P, Lee SS, Niederau C, Minuk GS, Ideo G, Bain V, Heathcote J, Zeuzem S, Trepo C, Albrecht J. 1998. Randomised trial of interferon alpha2b plus ribavirin for 48 weeks or for 24 weeks versus interferon alpha2b plus placebo for 48 weeks for treatment of chronic infection with hepatitis C virus. International Hepatitis Interventional Therapy Group (IHIT). Lancet 352:1426–1432 [DOI] [PubMed] [Google Scholar]
- 7. McHutchison JG, Gordon SC, Schiff ER, Shiffman ML, Lee WM, Rustgi VK, Goodman ZD, Ling MH, Cort S, Albrecht JK. 1998. Interferon alfa-2b alone or in combination with ribavirin as initial treatment for chronic hepatitis C. Hepatitis Interventional Therapy Group. N. Engl. J. Med. 339:1485–1492 [DOI] [PubMed] [Google Scholar]
- 8. Hezode C, Forestier N, Dusheiko G, Ferenci P, Pol S, Goeser T, Bronowicki JP, Bourliere M, Gharakhanian S, Bengtsson L, McNair L, George S, Kieffer T, Kwong A, Kauffman RS, Alam J, Pawlotsky JM, Zeuzem S. 2009. Telaprevir and peginterferon with or without ribavirin for chronic HCV infection. N. Engl. J. Med. 360:1839–1850 [DOI] [PubMed] [Google Scholar]
- 9. Kwo PY, Lawitz EJ, McCone J, Schiff ER, Vierling JM, Pound D, Davis MN, Galati JS, Gordon SC, Ravendhran N, Rossaro L, Anderson FH, Jacobson IM, Rubin R, Koury K, Pedicone LD, Brass CA, Chaudhri E, Albrecht JK. 2010. Efficacy of boceprevir, an NS3 protease inhibitor, in combination with peginterferon alfa-2b and ribavirin in treatment-naive patients with genotype 1 hepatitis C infection (SPRINT-1): an open-label, randomised, multicentre phase 2 trial. Lancet 376:705–716 [DOI] [PubMed] [Google Scholar]
- 10. Shimakami T, Lanford RE, Lemon SM. 2009. Hepatitis C: recent successes and continuing challenges in the development of improved treatment modalities. Curr. Opin. Pharmacol. 9:537–544 [DOI] [PMC free article] [PubMed] [Google Scholar]
- 11. Zeuzem S, Buggisch P, Agarwal K, Marcellin P, Sereni D, Klinker H, Moreno C, Zarski JP, Horsmans Y, Mo H, Arterburn S, Knox S, Oldach D, McHutchison JG, Manns MP, Foster GR. 2012. The protease inhibitor, GS-9256, and non-nucleoside polymerase inhibitor tegobuvir alone, with ribavirin, or pegylated interferon plus ribavirin in hepatitis C. Hepatology 55:749–758 [DOI] [PubMed] [Google Scholar]
- 12. Feld JJ, Nanda S, Huang Y, Chen W, Cam M, Pusek SN, Schweigler LM, Theodore D, Zacks SL, Liang TJ, Fried MW. 2007. Hepatic gene expression during treatment with peginterferon and ribavirin: identifying molecular pathways for treatment response. Hepatology 46:1548–1563 [DOI] [PMC free article] [PubMed] [Google Scholar]
- 13. Thomas E, Feld JJ, Li Q, Hu Z, Fried MW, Liang TJ. 2011. Ribavirin potentiates interferon action by augmenting interferon-stimulated gene induction in hepatitis C virus cell culture models. Hepatology 53:32–41 [DOI] [PMC free article] [PubMed] [Google Scholar]
- 14. Rotman Y, Noureddin M, Feld JJ, Guedj J, Witthaus M, Han H, Park YJ, Park SH, Heller T, Ghany MG, Doo E, Koh C, Abdalla A, Gara N, Sarkar S, Thomas E, Ahlenstiel G, Edlich B, Titerence R, Hogdal L, Rehermann B, Dahari H, Perelson AS, Hoofnagle JH, Liang TJ. Effect of ribavirin on viral kinetics and liver gene expression in chronic hepatitis C. Gut. 2013 Feb 8; doi: 10.1136/gutjnl-2012-303852. [Epub ahead of print.] doi: 10.1136/gutjnl-2012-303852. [DOI] [PMC free article] [PubMed] [Google Scholar]
- 15. Hofmann WP, Herrmann E, Sarrazin C, Zeuzem S. 2008. Ribavirin mode of action in chronic hepatitis C: from clinical use back to molecular mechanisms. Liver Int. 28:1332–1343 [DOI] [PubMed] [Google Scholar]
- 16. Feld JJ, Hoofnagle JH. 2005. Mechanism of action of interferon and ribavirin in treatment of hepatitis C. Nature 436:967–972 [DOI] [PubMed] [Google Scholar]
- 17. Eigen M. 1993. The origin of genetic information: viruses as models. Gene 135:37–47 [DOI] [PubMed] [Google Scholar]
- 18. Anderson JP, Daifuku R, Loeb LA. 2004. Viral error catastrophe by mutagenic nucleosides. Annu. Rev. Microbiol. 58:183–205 [DOI] [PubMed] [Google Scholar]
- 19. Crotty S, Maag D, Arnold JJ, Zhong W, Lau JY, Hong Z, Andino R, Cameron CE. 2000. The broad-spectrum antiviral ribonucleoside ribavirin is an RNA virus mutagen. Nat. Med. 6:1375–1379 [DOI] [PubMed] [Google Scholar]
- 20. Contreras AM, Hiasa Y, He W, Terella A, Schmidt EV, Chung RT. 2002. Viral RNA mutations are region specific and increased by ribavirin in a full-length hepatitis C virus replication system. J. Virol. 76:8505–8517 [DOI] [PMC free article] [PubMed] [Google Scholar]
- 21. Kanda T, Yokosuka O, Imazeki F, Tanaka M, Shino Y, Shimada H, Tomonaga T, Nomura F, Nagao K, Ochiai T, Saisho H. 2004. Inhibition of subgenomic hepatitis C virus RNA in Huh-7 cells: ribavirin induces mutagenesis in HCV RNA. J. Viral Hepat. 11:479–487 [DOI] [PubMed] [Google Scholar]
- 22. Brochot E, Duverlie G, Castelain S, Morel V, Wychowski C, Dubuisson J, Francois C. 2007. Effect of ribavirin on the hepatitis C virus (JFH-1) and its correlation with interferon sensitivity. Antivir. Ther. 12:805–813 [PubMed] [Google Scholar]
- 23. Pfeiffer JK, Kirkegaard K. 2005. Ribavirin resistance in hepatitis C virus replicon-containing cell lines conferred by changes in the cell line or mutations in the replicon RNA. J. Virol. 79:2346–2355 [DOI] [PMC free article] [PubMed] [Google Scholar]
- 24. Feigelstock DA, Mihalik KB, Feinstone SM. 2011. Selection of hepatitis C virus resistant to ribavirin. Virol. J. 8:402 doi:10.1186/1743-422X-8-402 [DOI] [PMC free article] [PubMed] [Google Scholar]
- 25. Asahina Y, Izumi N, Enomoto N, Uchihara M, Kurosaki M, Onuki Y, Nishimura Y, Ueda K, Tsuchiya K, Nakanishi H, Kitamura T, Miyake S. 2005. Mutagenic effects of ribavirin and response to interferon/ribavirin combination therapy in chronic hepatitis C. J. Hepatol. 43:623–629 [DOI] [PubMed] [Google Scholar]
- 26. Young KC, Lindsay KL, Lee KJ, Liu WC, He JW, Milstein SL, Lai MM. 2003. Identification of a ribavirin-resistant NS5B mutation of hepatitis C virus during ribavirin monotherapy. Hepatology 38:869–878 [DOI] [PubMed] [Google Scholar]
- 27. Hofmann WP, Polta A, Herrmann E, Mihm U, Kronenberger B, Sonntag T, Lohmann V, Schonberger B, Zeuzem S, Sarrazin C. 2007. Mutagenic effect of ribavirin on hepatitis C nonstructural 5B quasispecies in vitro and during antiviral therapy. Gastroenterology 132:921–930 [DOI] [PubMed] [Google Scholar]
- 28. Cuevas JM, Gonzalez-Candelas F, Moya A, Sanjuan R. 2009. Effect of ribavirin on the mutation rate and spectrum of hepatitis C virus in vivo. J. Virol. 83:5760–5764 [DOI] [PMC free article] [PubMed] [Google Scholar]
- 29. Hebner C, Martin R, Miller MD, Mo HM, Svarovskaia ES. 2011. The effects of combining two direct acting antivirals, ribavirin, and pegylated interferon on the detection of drug resistance mutations early in treatment of HCV. Hepatology 54:997a doi:10.1128/JCM.00838-12 [Google Scholar]
- 30. Lutchman G, Danehower S, Song BC, Liang TJ, Hoofnagle JH, Thomson M, Ghany MG. 2007. Mutation rate of the hepatitis C virus NS5B in patients undergoing treatment with ribavirin monotherapy. Gastroenterology 132:1757–1766 [DOI] [PubMed] [Google Scholar]
- 31. Chevaliez S, Brillet R, Lazaro E, Hezode C, Pawlotsky JM. 2007. Analysis of ribavirin mutagenicity in human hepatitis C virus infection. J. Virol. 81:7732–7741 [DOI] [PMC free article] [PubMed] [Google Scholar]
- 32. Ward CL, Dev A, Rigby S, Symonds WT, Patel K, Zekry A, Pawlotsky JM, McHutchison JG. 2008. Interferon and ribavirin therapy does not select for resistance mutations in hepatitis C virus polymerase. J. Viral Hepat. 15:571–577 [DOI] [PubMed] [Google Scholar]
- 33. Zagordi O, Klein R, Daumer M, Beerenwinkel N. 2010. Error correction of next-generation sequencing data and reliable estimation of HIV quasispecies. Nucleic Acids Res. 38:7400–7409 [DOI] [PMC free article] [PubMed] [Google Scholar]
- 34. Kato N, Hijikata M, Ootsuyama Y, Nakagawa M, Ohkoshi S, Sugimura T, Shimotohno K. 1990. Molecular cloning of the human hepatitis C virus genome from Japanese patients with non-A, non-B hepatitis. Proc. Natl. Acad. Sci. U. S. A. 87:9524–9528 [DOI] [PMC free article] [PubMed] [Google Scholar]
- 35. Ning Z, Cox AJ, Mullikin JC. 2001. SSAHA: a fast search method for large DNA databases. Genome Res. 11:1725–1729 [DOI] [PMC free article] [PubMed] [Google Scholar]
- 36. Oliver GR. 2012. Considerations for clinical read alignment and mutational profiling using next-generation sequencing. F1000 Res. 1:2 doi:10.3410/f1000research.1-2.v2 [DOI] [PMC free article] [PubMed] [Google Scholar]
- 37. Li H, Handsaker B, Wysoker A, Fennell T, Ruan J, Homer N, Marth G, Abecasis G, Durbin R. 2009. The Sequence Alignment/Map format and SAMtools. Bioinformatics 25:2078–2079 [DOI] [PMC free article] [PubMed] [Google Scholar]
- 38. Pfeiffer JK, Kirkegaard K. 2003. A single mutation in poliovirus RNA-dependent RNA polymerase confers resistance to mutagenic nucleotide analogs via increased fidelity. Proc. Natl. Acad. Sci. U. S. A. 100:7289–7294 [DOI] [PMC free article] [PubMed] [Google Scholar]
- 39. Gilles A, Meglecz E, Pech N, Ferreira S, Malausa T, Martin JF. 2011. Accuracy and quality assessment of 454 GS-FLX Titanium pyrosequencing. BMC Genomics 12:245 doi:10.1186/1471-2164-12-245 [DOI] [PMC free article] [PubMed] [Google Scholar]
- 40. Hedskog C, Mild M, Jernberg J, Sherwood E, Bratt G, Leitner T, Lundeberg J, Andersson B, Albert J. 2010. Dynamics of HIV-1 quasispecies during antiviral treatment dissected using ultra-deep pyrosequencing. PLoS One 5:e11345 doi:10.1371/journal.pone.0011345 [DOI] [PMC free article] [PubMed] [Google Scholar]
- 41. Kagan RM, Johnson EP, Siaw M, Biwas P, Chapman DS, Su Z, Platt JL, Pesano RL. 2012. A genotypic test for HIV-1 tropism combining Sanger sequencing with ultradeep sequencing predicts virologic response in treatment-experienced patients. PLoS One 7:e46334 doi:10.1371/journal.pone.0046334 [DOI] [PMC free article] [PubMed] [Google Scholar]
- 42. Wang C, Mitsuya Y, Gharizadeh B, Ronaghi M, Shafer RW. 2007. Characterization of mutation spectra with ultra-deep pyrosequencing: application to HIV-1 drug resistance. Genome Res. 17:1195–1201 [DOI] [PMC free article] [PubMed] [Google Scholar]
- 43. Niu B, Fu L, Sun S, Li W. 2010. Artificial and natural duplicates in pyrosequencing reads of metagenomic data. BMC Bioinformatics 11:187 doi:10.1186/1471-2105-11-187 [DOI] [PMC free article] [PubMed] [Google Scholar]
- 44. Gerstung M, Beisel C, Rechsteiner M, Wild P, Schraml P, Moch H, Beerenwinkel N. 2012. Reliable detection of subclonal single-nucleotide variants in tumour cell populations. Nat. Commun. 3:811 doi:10.1038/ncomms1814 [DOI] [PubMed] [Google Scholar]
- 45. Quail MA, Smith M, Coupland P, Otto TD, Harris SR, Connor TR, Bertoni A, Swerdlow HP, Gu Y. 2012. A tale of three next generation sequencing platforms: comparison of Ion Torrent, Pacific Biosciences and Illumina MiSeq sequencers. BMC Genomics 13:341 doi:10.1186/1471-2164-13-341 [DOI] [PMC free article] [PubMed] [Google Scholar]
- 46. Noguchi H, Park J, Takagi T. 2006. MetaGene: prokaryotic gene finding from environmental genome shotgun sequences. Nucleic Acids Res. 34:5623–5630 [DOI] [PMC free article] [PubMed] [Google Scholar]
- 47. Keith CS, Hoang DO, Barrett BM, Feigelman B, Nelson MC, Thai H, Baysdorfer C. 1993. Partial sequence analysis of 130 randomly selected maize cDNA clones. Plant Physiol. 101:329–332 [DOI] [PMC free article] [PubMed] [Google Scholar]
- 48. Hoff KJ. 2009. The effect of sequencing errors on metagenomic gene prediction. BMC Genomics 10:520 doi:10.1186/1471-2164-10-520 [DOI] [PMC free article] [PubMed] [Google Scholar]
- 49. Crotty S, Cameron CE, Andino R. 2001. RNA virus error catastrophe: direct molecular test by using ribavirin. Proc. Natl. Acad. Sci. U. S. A. 98:6895–6900 [DOI] [PMC free article] [PubMed] [Google Scholar]
- 50. Lanford RE, Chavez D, Guerra B, Lau JY, Hong Z, Brasky KM, Beames B. 2001. Ribavirin induces error-prone replication of GB virus B in primary tamarin hepatocytes. J. Virol. 75:8074–8081 [DOI] [PMC free article] [PubMed] [Google Scholar]
- 51. Chung DH, Sun Y, Parker WB, Arterburn JB, Bartolucci A, Jonsson CB. 2007. Ribavirin reveals a lethal threshold of allowable mutation frequency for Hantaan virus. J. Virol. 81:11722–11729 [DOI] [PMC free article] [PubMed] [Google Scholar]
- 52. Sierra M, Airaksinen A, Gonzalez-Lopez C, Agudo R, Arias A, Domingo E. 2007. Foot-and-mouth disease virus mutant with decreased sensitivity to ribavirin: implications for error catastrophe. J. Virol. 81:2012–2024 [DOI] [PMC free article] [PubMed] [Google Scholar]
- 53. Dixit NM, Perelson AS. 2006. The metabolism, pharmacokinetics and mechanisms of antiviral activity of ribavirin against hepatitis C virus. Cell. Mol. Life Sci. 63:832–842 [DOI] [PMC free article] [PubMed] [Google Scholar]
- 54. Dixit NM, Layden-Almer JE, Layden TJ, Perelson AS. 2004. Modelling how ribavirin improves interferon response rates in hepatitis C virus infection. Nature 432:922–924 [DOI] [PubMed] [Google Scholar]
- 55. Loman NJ, Misra RV, Dallman TJ, Constantinidou C, Gharbia SE, Wain J, Pallen MJ. 2012. Performance comparison of benchtop high-throughput sequencing platforms. Nat. Biotechnol. 30:434–439 [DOI] [PubMed] [Google Scholar]
- 56. Mihm U, Welker MW, Teuber G, Wedemeyer H, Berg T, Sarrazin C, Böhm S, Alshuth U, Herrmann E, Zeuzem S. Impact of ribavirin priming on viral kinetics and treatment response in chronic hepatitis C genotype 1 infection. J. Viral Hepat., in press [DOI] [PubMed] [Google Scholar]
Associated Data
This section collects any data citations, data availability statements, or supplementary materials included in this article.