

Abstract
Objective
To evaluate the feasibility of conjunctival hemodynamic measurements based on assessment of reproducibility, validity, and response to acute hypotension.
Methods
Image sequences of the conjunctival microvasculature of rabbits were captured using a slit lamp biomicroscope under a steady state condition, after topical administration of phenylephrine, and after intravenous administration of esmolol. Venous hemodynamic parameters (diameter, blood velocity, blood flow, wall shear stress) were derived.
Results
Conjunctival venous diameters ranged from 9 to 34 μm and blood velocities ranged from 0.08 to 0.95 mm/s. Coefficients of variation of venous diameter and blood velocity were on average 6% and 14%, respectively. Automated and manual measurements of venous diameter and velocity were highly correlated (R = 0.97; p < 0.001; N = 16). With phenylephrine administration, diameter and velocity were reduced by 21% and 69%, respectively. Following esmolol administration, blood pressure was reduced with a concomitant decrease in velocity, followed by recovery to baseline. Venous blood velocity, flow, and wall shear stress were correlated with blood pressure (R ≥ 0.52; p ≤ 0.01).
Conclusions
The feasibility of quantifying alterations in microvascular hemodynamics in the bulbar conjunctiva was established. The method is of potential value in evaluating microcirculatory hemodynamics related to cardiovascular function.
Keywords: conjunctiva, microcirculation, hypotension, blood flow, wall shear stress, rabbit
Introduction
Despite advances in prevention of cardiovascular disease, the prevalence of stroke and heart disease continue to climb [50]. Heart disease is the leading cause of death among all populations in the U.S. [21]. Although the mortality associated with stroke is significantly lower than heart disease, the occurrence of non-lethal stroke leads to significant morbidity and often results in life-long physical disability [21,28].
Currently, our ability to reasonably predict the occurrence of impending cardiovascular events remains poor and prevention is primarily based on control of blood pressure and blood sugar among diseases associated with cardiovascular disease, notably hypertension and diabetes mellitus, respectively.
Although mechanisms leading to blood vessel occlusion and thrombosis associated with cardiovascular disease are complex, the basis of thrombus formation involves abnormal blood flow, change in blood rheology, and endothelial dysfunction or injury leading to reduced tissue perfusion as defined by Virchow’s triad [36]. It is notable that blood vessel wall shear stress, the tangential force applied to the endothelium surface with blood flow, plays a key role in maintaining endothelial integrity. Shear stress luminal receptors are sensitive to changes in flow characteristics leading to alteration in signal kinases [19]. Recent studies suggest that wall shear stress regulates the activity of apoptosis-signal kinase-1 (ASK1) [53]. Under low wall shear stress (low flow), phosphorylation of ASK1 is increased, mediating expression of vascular cell adhesion molecule-1 [53], which in turn, promotes leukocyte adhesion, intimal inflammation and ultimately plaque formation [5,19]. Therefore, not only does wall shear stress play an important role in the etiology of luminal inflammatory disease, it can be potentially exploited clinically as a powerful tool to assess the risk for arteriosclerotic disease and as a biomarker for optimizing drug therapies known to alter blood coagulability and viscosity.
Clinically, non-invasive examination of the human microcirculation can be performed in the bulbar conjunctival tissue of the eye with the use of a conventional slit lamp biomicroscope. The accessibility of the conjunctiva for direct viewing makes it an ideal site for assessment of hemodynamics in small caliber vessels, where vascular resistance is high and blood is prone to stagnation. Furthermore, the conjunctiva is a corollary end organ akin to the brain and is thought to exhibit similar hemodynamic responses to changes in blood pressure and head position [37]. Indeed, several studies have established a correlation between blood flow in the bulbar conjunctiva and cerebral cortex [1,39,44]. Moreover, hemodynamic and morphologic abnormalities of the conjunctival microcirculation, such as alterations in blood flow, erythrocyte aggregation, microvascular density and deformation of the venous wall, have been reported in patients with history of atherosclerosis, stroke [6,9,33] and chronic heart failure [22].
The ability to assess microvascular structure and function is important in improving our fundamental understanding of pathophysiological processes in many areas of cardiovascular disease, especially those involving hypertension, diabetes and heart failure. In clinical research, monitoring the microcirculation could be of great value in assessing the effects of medical or surgical interventions in clinical trials. In clinical practice, evaluating the microcirculation could assist in diagnosis, risk stratification, and monitoring disease progression or therapeutic interventions in individual patients.
Furthermore, it is important to note that in addition to cardiovascular disease, conditions such as septic and hypovolemic shock can also affect microvascular flow [11]. Therefore, valid quantitative tools for hemodynamic assessment of microvascular beds, such as found in the conjunctiva, may be exploited to gain valuable information concerning vascular perfusion, as well as to evaluate the response to drug or surgical interventions that target microcirculatory abnormalities.
We have previously developed a novel technique for the combined measurements of blood velocity and vessel diameter, allowing for calculation of blood flow in the conjunctival microcirculation [45]. In the current study, the reproducibility of our method was determined based on repeated conjunctival hemodynamic measurements. The validity was established by comparing manual and automated measurements and by determining changes with topical administration of phenylephrine, a potent sympathomimetic agent with primary alpha 1 adrenergic activity known to act directly on vascular smooth muscle resulting in vasoconstriction and vasopressor activity [14,23]. To further establish the method, we measured the response of conjunctival hemodynamics to hypotension by systemic administration of esmolol, a short acting beta blocker known for its negative inotropic and chronotropic effects, resulting in a decrease in cardiac output [47]. The primary use of esmolol is for rapid intervention of cardiac abnormalities, notably supraventricular tachycardia [52]. Previous studies have suggested that esmolol at lower doses results in a significant decrease in total peripheral resistance [3,38], while at higher doses a diminished cardiac index was reported [16]. This dose dependent response may reflect the dual action of esmolol on cardiac beta receptors and cardiac electrophysiology.
Materials and Methods
Animals
Conjunctival microcirculation imaging was performed in 2 New Zealand white rabbits (weight = 3.2 ± 0.1 kg; mean ± SD) following a protocol approved by the institution’s animal care committee. The animals were anesthetized with intraperitoneal injections of ketamine (35 mg/kg) and xylazine (4 mg/kg). Anesthesia was maintained by supplemental injections of ketamine and xylazine as needed. Body temperature was held at 37°C using a heated blanket placed over the animals.
A central ear artery and a marginal ear vein were catheterized. The venous catheter provided an intravenous route for drug administration, while the arterial catheter was used for drawing blood to determine the systemic blood hematocrit. The systemic blood hematocrit measurements were 41.1 ± 0.2% and 38.9 ± 1.4% (N = 2) in rabbit 1 and 2, respectively. The arterial catheter was connected to a pressure transducer linked to a data acquisition system (Biopac Systems Inc., Goleta, CA, USA) for real-time and continuous monitoring of blood pressure and heart rate.
The animal was secured to an animal holder and placed in front of a slit lamp biomicroscope for imaging. During imaging, the eyelid was taped open to expose the bulbar conjunctival surface and artificial tears were periodically applied to the conjunctival surface to prevent dryness. To induce temporary vasoconstriction of the conjunctival microvasculature, one drop of 2.5% phenylephrine diluted to 0.31% (3.1 mg/mL) was applied to the eye. For determining the effect of acute hypotension on the conjunctival microcirculation, a bolus of esmolol was intravenously injected at a dosage of 10 mg/kg. A decrease in blood pressure occurred immediately after administration of esmolol and reverted to baseline after approximately 3 minutes. Response of conjunctival hemodynamics to esmolol was studied one week following phenylephrine studies to avoid a combination effect of drugs.
Imaging
The optical system for imaging the conjunctival microcirculation has been previously described [45]. Briefly, images of the conjunctival microvasculature were captured using a slit lamp biomicroscope equipped with an electron multiplying charge-coupled device camera (Q Imaging, Surrey, BC, Canada). The size of the camera sensor elements were 8 × 8 μm and the fill factor was 100%. The conjunctiva was illuminated using the slit lamp light source with a green filter (540 ± 5 nm) to improve the visibility of blood within the microvasculature. Image sequences were acquired at a rate of 62 Hz for 2 seconds. An example image of the rabbit conjunctival microcirculation is shown in Fig 1.
Fig 1.
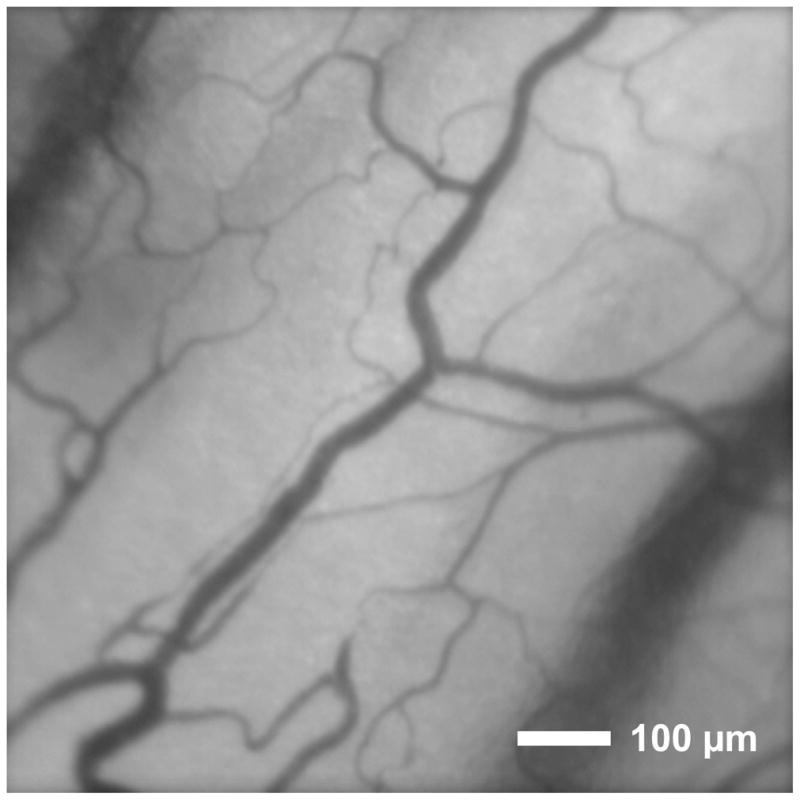
An example image of the conjunctival microcirculation of a rabbit displaying an area of 850 μm × 850 μm.
Each image in the sequence was comprised of 502 × 501 pixels with a pixel resolution of 1.7 × 1.7 μm at the conjunctiva image plane. Image sequences were registered semi-automatically to correct for animal motion during imaging. In the venules, inner luminal diameter (D) and axial blood velocity (Va) were determined with an automated technique from the registered image sequences as previously described [45]. Manual measurements of D were determined by the length of a line drawn between the vessel walls and perpendicular to the vessel axis. Manual measurements of Va were obtained by dividing the travel distance of a red blood cell (or a gap between red blood cells) by the time interval.
Data Analysis
Blood Velocity, Blood Flow and Wall Shear Stress Calculation
The average cross sectional blood velocity (V) was calculated from Va using a previously defined function introduced by Koutsiaris et al [31,32]. From the automated measurements of D and V, blood flow (Q) was determined using a standard flow rate equation: Q = VΠ D2/4. Wall shear stress (WSS) was calculated as 8ηV/D, where η is the microvascular blood viscosity, which was estimated from the in vivo viscosity law [32,40] using D and the venule discharge hematocrit. The venule discharge hematocrit was estimated based on the Fahreus effect, assuming the ratio of the microvessel hematocrit and venule discharge hematocrit to be 0.7 [17,32] and the microvessel hematocrit to be 34% of the systemic blood hematocrit [32]. The average venule discharge hematocrit estimations were 19.9 ± 0.1% and 18.9 ± 0.7% in rabbit 1 and 2, respectively.
Reproducibility
Reproducibility was determined based on 3 to 5 repeated measurements of D and V obtained within a time period of 3 minutes in 8 venules of each rabbit. The coefficients of variation (CV = 100×standard deviation/mean) of venular hemodynamic parameters (D, V, Q, and WSS) were calculated and averaged over 8 venules in each rabbit.
Validation
Validation of the automated measurements was performed by comparison with venous D and Va measurements obtained manually and determining the correlation coefficient. Furthermore, the validity of the method was established by comparing the mean of 4 measurements of each hemodynamic parameter obtained in 2 venules of each rabbit before (baseline) and 3 minutes (typical duration for the venous diameter to reach a minimum value) following topical administration of phenylephrine (after). Maximum percent change (MPC) of each hemodynamic parameter was calculated according to: (after - baseline) × 100 / baseline.
Conjunctival Hemodynamic Response to Esmolol
Blood pressure, heart rate and conjunctival hemodynamic parameters were recorded before and following esmolol administration, approximately every 7 seconds, until blood pressure returned to the baseline level. The mean of 4 measurements of each hemodynamic parameter before esmolol administration was calculated (baseline). Depending on the blood pressure recovery time, the number of measurements in each venule ranged between 9 and 36 (excluding baseline measurements). Percent changes (PC) were calculated by comparing baseline hemodynamic parameters or blood pressure with measurements obtained after esmolol administration, until blood pressure recovered to baseline. MPC in each hemodynamic parameter was calculated by comparing baseline and a single measurement obtained at approximately 30 seconds (typical duration for the blood pressure to reach a minimum value) after esmolol administration (after). Linear regression analysis was performed to determine the relationships between hemodynamic parameters and blood pressure during recovery from hypotension. Statistical significance was accepted at p < 0.05.
Results
Reproducibility
The minimum and maximum of venous D and V measurements, and the mean CV for each rabbit are listed in Table 1. The average CV of venous D and V measurements in 2 rabbits were 6% and 14%, respectively. The average CV of venous Q and WSS were 18% and 22%, respectively. The relationship between venous WSS and D, based on data obtained in both rabbits, is shown in Fig 2. The best fit curve to the data points had the following equation: WSS = 178.8D−2.2 (R = 0.83, N = 16).
Table 1.
The minimum (Min), maximum (Max), and mean coefficient of variation (CV) of conjunctival venous diameter and blood velocity based on 3 to 5 repeated measurements in 8 venules of each rabbit.
| Diameter | Velocity | |||||
|---|---|---|---|---|---|---|
| Min (μm) | Max (μm) | CV (%) | Min (mm/s) | Max (mm/s) | CV (%) | |
| Rabbit 1 | 11 | 26 | 7 | 0.08 | 0.25 | 19 |
| Rabbit 2 | 9 | 34 | 5 | 0.13 | 0.95 | 10 |
| Mean | - | - | 6 | - | - | 14 |
Fig 2.

Relationship between wall shear stress and diameter measurements obtained in 8 conjunctival venules of each rabbit. The best fit curve and its equation are displayed.
Validation
The correlation coefficients of manual and automated measurements of both venous D and Va were 0.97 (p < 0.001; N = 16). Baseline and MPC of venous hemodynamic parameters obtained in 2 venules of each rabbit following topical administration of phenylephrine are presented in Table 2. Baseline venous D measurements were on average 14 and 19 μm in rabbits 1 and 2, respectively. Baseline venous V measurements were on average 0.6 and 0.1 mm/s in rabbits 1 and 2, respectively. As expected, vasoconstriction was observed as venous D decreased on average by 21%, while venous V decreased by 69%. Accordingly, venous Q and WSS decreased on average by 72% and 61%, respectively.
Table 2.
Baseline and maximum percent change (MPC) of conjunctival venous diameter (D), velocity (V), flow (Q), and wall shear stress (WSS) based on measurements averaged over 2 venules of each rabbit, 3 minutes following phenylephrine administration.
| Rabbit | D | V | Q | WSS | ||||
|---|---|---|---|---|---|---|---|---|
|
| ||||||||
| Baseline (μm) | MPC (%) | Baseline (mm/s) | MPC (%) | Baseline (pL/s) | MPC (%) | Baseline (N/m2) | MPC (%) | |
| 1 | 14 | −12 | 0.6 | −53 | 100 | −52 | 0.79 | −50 |
| 2 | 19 | −30 | 0.1 | −85 | 39 | −93 | 0.10 | −73 |
| Mean | −21 | −69 | −72 | −61 | ||||
Conjunctival Hemodynamic Response to Esmolol
An example of the time course of PCs in blood pressure and venous hemodynamic parameters following esmolol administration in one rabbit is shown in Fig 3. At baseline, the average blood pressure and heart rate were 74 mmHg and 192 bpm, respectively. Venous hemodynamic parameters of D, V, Q and WSS were 33 μm, 0.78 mm/s, 682 pL/s and 0.33 N/m2, respectively. Approximately 30 seconds following esmolol administration, blood pressure decreased by 65% and heart rate increased by 8%. During this period, venous V decreased by 98% while D remained relatively constant. Accordingly, both venous Q and WSS declined by 98%. All systemic and venous hemodynamic parameters recovered to baseline levels approximately 3 minutes following esmolol administration.
Fig 3.

Time course of percent changes in blood pressure (BP), conjunctival venous diameter (D), velocity (V), flow (Q), and wall shear stress (WSS) in one rabbit. Esmolol was administered at time = 0 seconds.
Baseline and MPC of venous hemodynamic parameters following esmolol administration are presented in Table 3. Baseline blood pressure measurements (N = 4) were 68 ± 0.03 mmHg and 77 ± 5 mmHg in rabbits 1 and 2, respectively. In each rabbit, measurements were obtained in 4 venules with baseline D ranging between 9 and 33 μm. On average, in response to esmolol, venous D increased by 4% and 1% in rabbit 1 and 2, respectively, while venous V decreased by 95% in both rabbits.
Table 3.
Baseline and maximum percent changes (MPC) of conjunctival venous diameter (D), velocity (V), flow (Q), and wall shear stress (WSS) in 4 venules of each rabbit, following esmolol administration.
| Rabbit | D | V | Q | WSS | ||||
|---|---|---|---|---|---|---|---|---|
|
| ||||||||
| Baseline (μm) | MPC (%) | Baseline (mm/s) | MPC (%) | Baseline (pL/s) | MPC (%) | Baseline (N/m2) | MPC (%) | |
| 1 | 9 | −16 | 0.37 | −92 | 22 | −94 | 1.30 | −87 |
| 1 | 13 | 18 | 0.12 | −100 | 15 | −100 | 0.21 | −100 |
| 1 | 19 | 12 | 0.09 | −100 | 27 | −100 | 0.08 | −100 |
| 1 | 33 | 0 | 0.08 | −87 | 66 | −87 | 0.04 | −87 |
| Mean ± SD | 4 ± 15 | −95 ± 6 | −95 ± 6 | −93 ± 7 | ||||
|
| ||||||||
| 2 | 9 | −6 | 0.95 | −89 | 56 | −90 | 3.38 | −88 |
| 2 | 12 | −1 | 0.57 | −91 | 70 | −92 | 0.99 | −91 |
| 2 | 19 | 12 | 0.50 | −100 | 137 | −100 | 0.48 | −100 |
| 2 | 33 | 1 | 0.78 | −98 | 682 | −98 | 0.33 | −98 |
| Mean ± SD | 1 ± 7 | −95 ± 5 | −95 ± 5 | −94 ± 6 | ||||
Examples of the relationships of venous hemodynamic parameters with blood pressure obtained from one venule in each rabbit are shown in Fig 4(A–D). In one rabbit 1, venous D was correlated (positively) with blood pressure (R = 0.68; p = 0.001; N = 19), while in rabbit 2, venous D was not correlated with blood pressure (R = 0.18; p = 0.28; N = 36). In both venules, venous V, Q and WSS were correlated (positively) with blood pressure (R ≥ 0.83; p < 0.01). Compiled data from 8 venules in both rabbits showed venous D and blood pressure were correlated (positively) in 4 of 8 venules (R = ≥ 0.55; p ≤ 0.02; N = 19 to 23), correlated (negatively) in 2 of 8 venules (R ≤ −0.48; p ≤ 0.02; N =18 or 25), and not significantly correlated in 2 of 8 venules (R ≤ 0.18; p ≥ 0.28; N = 9 or 36). Venous V, Q and WSS were positively correlated with blood pressure in all 8 venules (R ≥ 0.52; p ≤ 0.01; N = 9 to 36).
Fig 4.

A–D) Examples of relationships between hemodynamic parameters and blood pressure in 2 similar caliber conjunctival venules of 2 rabbits: diameter (D), velocity (V), flow (Q), and wall shear stress (WSS) (black and white circles indicate measurements from rabbit 1 and 2, respectively). E–F) Examples of relationships between percent changes in hemodynamic parameters and percent changes in blood pressure of the same venules: flow (Q) and wall shear stress (WSS). Best fit regression lines (black and white lines for black and white circles, respectively) are displayed.
Examples of the relationships of PCs in venous Q and WSS with PCs in blood pressure are shown in Fig 4(E–F). In both venules, changes in venous Q and WSS were correlated (positively) with changes in blood pressure (R ≥ 0.83; p ≤ 0.001; N = 19 or 36). Of note, in the venule with lower velocity, Q was higher than baseline after blood pressure recovery. Compiled data from 8 venules in both rabbits showed PCs in Q and WSS were correlated (positively) with PCs in blood pressure (R ≥ 0.52; p ≤ 0.01; N = 9 to 36). The slopes of the regression lines relating PCs in Q and blood pressure were on average 1.3 ± 0.5 and 1.5 ± 0.1 for rabbit 1 (N = 4) and rabbit 2 (N = 4), respectively. The slopes of the regression lines relating PCs in WSS and blood pressure were on average 1.1 ± 0.7 and 1.4 ± 0.2 for rabbit 1 and 2, respectively.
Discussion
Alterations in microvascular hemodynamic parameters can be readily measured due to the accessibility of the conjunctival microcirculation [7,8,13,44,46], and may reflect pathologic conditions or diseases that affect systemic circulation. In the current study, we established and validated our technique for measuring venous D, V, Q, and WSS in the bulbar conjunctiva of rabbits and demonstrated a significant association between hemodynamic parameters (V, Q, WSS) and blood pressure in response to acute experimental hypotension.
The reproducibility of venous D and V measurements of the rabbit conjunctiva was similar to those previously reported in conjunctival vessels of humans [32,45]. In addition, venous D and Va measurements were highly correlated with those obtained manually, providing validation of our hemodynamic quantification technique. Our finding of decreased venous D after topical phenylephrine administration is in agreement with a previous published result of a 12% venous diameter constriction in human conjunctiva with phenylephrine [23]. Additionally, decreases in venous V with phenylephrine application were also demonstrated in the current study, likely due to upstream arterial and venous vasoconstriction and a corresponding reduction in blood flow. Reduced blood flow in the microcirculatory bed is expected to lower oxygen delivery, consistent with a previously reported reduction in conjunctival oxygen tension with topical phenylephrine administration [26]. Furthermore, a marked reduction in blood flow of the optic nerve head following topical phenylephrine administration has been observed, presumably through a mechanism involving systemic absorption of the drug [48].
Following esmolol administration, changes in conjunctival blood flow paralleled the decrease in blood pressure. The response of venous D to hypotension was not consistent among all venules, similar to previous studies that reported lack of response or passive collapse due to hypotension [10]. Moreover, the observed vasodilatory effect of esmolol is supported by previous studies that demonstrated a reduction in total peripheral resistance with blood pressure [16,38], though in other studies, reduced peripheral resistance was largely attributed to arterial vasodilation [10,30,49]. Nonetheless, due to a consistent reduction in venous V, a significant positive correlation between conjunctival venous Q and blood pressure was observed in all venules, consistent with a previous study that showed a direct effect of esmolol on reducing both blood pressure and cerebral blood flow velocity [18]. Furthermore, our finding also agrees with previous studies that demonstrated a high correlation between latissimus dorsi microcirculatory blood flow and arterial blood pressure following extradual nerve blocking [4], and between sublingual microvascular blood flow and coronary perfusion pressure in pigs following cardiac arrest [15].
Baseline measurements of V in venules with similar diameters were found to vary between rabbits, on average by a factor of 6, larger than the reported variations among human subjects [32]. The variability in venous V may be attributed to several factors, including systemic physiological differences such as blood pressure, variation in local blood hemorheology [12], structural differences among vascular networks, and inter-subject variations [43]. Differences of microcirculatory flow characteristics are also likely to be related to local oxygen demand and perfusion pressure. Despite the observed differences in venous V, the rates of PCs in Q with blood pressure were similar among venules of different diameters and between rabbits. This finding indicates that the rate of decrease in venous Q due to hypotension may be independent of the initial magnitude of venous Q, at least within the studied range of venule calibers. Interestingly, venous Q following recovery from hypotension was greater than baseline in some venules. This result may be attributed to cerebral hyperemia, similar to findings in post-ischemic subjects [20,25,41].
Venous WSS measurements in the rabbit conjunctiva were comparable to previously reported values in similar caliber venules of the human conjunctiva [32] and mouse cremaster muscle [27], but lower than those in the cat intestinal mesentery [35]. Variations in WSS of similar caliber vessels of different tissues are expected due to variations in the vascular network and blood velocity [34]. However, the relationship between venous WSS and D in the current study paralleled those reported in post-capillary venules of other tissues [24,32,34,54]. Although Q and WSS are both determined by V and D, WSS provides information about the stress exerted on the vessel wall from the movement of blood by accounting for blood viscosity, and is likely a more pertinent parameter involved in vasoregulation and endothelial function.
Blood flow in most vascular beds is expected to remain relatively constant due to myogenic vasoregulation within a normal blood pressure range of 70 to 120 mmHg [10]. Under extreme hypotension, which can occur in subjects with reduced cardiac output, such as in cardiogenic shock, regulatory vasodilation will not be able to compensate for the reduction in blood flow [49]. Hence, venous Q and WSS become dependent on blood pressure, as observed in the current study. Since reduced blood pressure has a larger effect on small caliber blood vessels due to their higher resistance, the finding that WSS in the conjunctiva microvasculature is related to blood pressure supports the potential of this parameter to provide information about the level of microvascular perfusion in vital tissue under impaired cardiovascular conditions.
One limitation of the current study was that conjunctival hemodynamic parameters were measured in venules, which are more numerous than arterioles on the conjunctival surface [7,51], and therefore more accessible for imaging. Nevertheless, wall shear stress is expected to affect vasoregulation and endothelial function in veins [29,42], similar to arteries[2]. It is possible to assess a larger network of conjunctival blood vessels by imaging multiple fields of view, which will allow examination of simultaneous flow characteristics among multiple arterioles and venules of varying calibers [11]. In future studies, by increasing the sample size and including a larger range of vessel calibers, the response of conjunctival hemodynamics to esmolol and other pharmacological agents, conditional on vessel type and caliber, will be established in a more comprehensive manner. Additionally, the variability of blood flow and wall shear stress within and among individuals with cardiovascular conditions will be determined in comparison with healthy subjects. These observations will aid in evaluating the association between blood pressure and conjunctival perfusion, and will give important insight into hemodynamic relationships not only in the eye, but also in other critical organs, notably the brain.
In summary, this study demonstrated that alteration in microvascular hemodynamics due to experimental hypotension can be readily observed and monitored in the bulbar conjunctiva. Quantitative measurements of conjunctival hemodynamic parameters have the potential to provide a noninvasive means to monitor microcirculation perfusion and potentially aid in prevention of impending cardiovascular events.
Perspectives.
The feasibility of quantifying alterations in conjunctival hemodynamic measurements was established by assessment of reproducibility, validity, and the response to acute hypotension. During recovery from hypotension, conjunctival blood flow and wall shear stress were significantly correlated with blood pressure. Noninvasive assessment of conjunctival microcirculation is potentially useful for monitoring cardiovascular function.
Acknowledgments
Grant numbers and sources of support: National Eye Institute, Bethesda, MD, R01 EY17918, P30 EY01792, Research to Prevent Blindness, New York, NY, senior scientific investigator award (MS), an unrestricted departmental award (UIC), Illinois Society for the Prevention of Blindness, Chicago, IL, 2010 Research Seed Grant (BG and PT).
List of Abbreviations
- D
Diameter
- V
Average Cross Sectional Velocity
- Q
Flow
- WSS
Wall Shear Stress
- CV
Coefficient of Variation
- MPC
Maximum Percent Change
- PC
Percent Change
References
- 1.Alizade IT. Acoustic dysfunction and microcirculation in patients with diabetes mellitus. Vestn Otorinolaringol. 2007;1:11–13. [PubMed] [Google Scholar]
- 2.Ando J, Yamamoto K. Effects of shear stress and stretch on endothelial function. Antioxid Redox Signal. 2011;15:1389–403. doi: 10.1089/ars.2010.3361. [DOI] [PubMed] [Google Scholar]
- 3.Angaran DM, Schultz NJ, Tschida VH. Esmolol hydrochloride: an ultrashort-acting, beta-adrenergic blocking agent. Clin Pharm. 1986;5:288–303. [PubMed] [Google Scholar]
- 4.Banic A, Krejci V, Erni D, Petersen-Felix S, Sigurdsson GH. Effects of extradural anesthesia on microcirculatory blood flow in free latissimus dorsi musculocutaneous flaps in pigs. Plast Reconstr Surg. 1997;100:945–956. doi: 10.1097/00006534-199709001-00017. [DOI] [PubMed] [Google Scholar]
- 5.Blankenberg S, Barbaux S, Tiret L. Adhesion molecules and atherosclerosis. Atherosclerosis. 2003;170:191–203. doi: 10.1016/s0021-9150(03)00097-2. [DOI] [PubMed] [Google Scholar]
- 6.Chernukh AM. Conjunctival biomicroscopy and heart diseases. Bibl Anat. 1979;18:313–318. [PubMed] [Google Scholar]
- 7.Cheung AT, Chen PC, Larkin EC, Duong PL, Ramanujam S, Tablin F, Wun T. Microvascular abnormalities in sickle cell disease: a computer-assisted intravital microscopy study. Blood. 2002;99:3999–4005. doi: 10.1182/blood.v99.11.3999. [DOI] [PubMed] [Google Scholar]
- 8.Cheung AT, Harmatz P, Wun T, Chen PC, Larkin EC, Adams RJ, Vichinsky EP. Correlation of abnormal intracranial vessel velocity, measured by transcranial Doppler ultrasonography, with abnormal conjunctival vessel velocity, measured by computer-assisted intravital microscopy, in sickle cell disease. Blood. 2001;97:3401–3404. doi: 10.1182/blood.v97.11.3401. [DOI] [PubMed] [Google Scholar]
- 9.Davis E. An evaluation of clinical biomicroscopy of the small blood vessels. Bibl Anat. 1973;11:233–238. [PubMed] [Google Scholar]
- 10.Davis MJ, Hill MA, Kuo L. Local Regulation of Microvascular Perfusion. In: Tuma RF, Duran WN, Ley K, editors. Microcirculation. Sandiego, CA, USA: Academic Press; 2008. pp. 161–284. [Google Scholar]
- 11.De Backer D, Ospina-Tascon G, Salgado D, Favory R, Creteur J, Vincent JL. Monitoring the microcirculation in the critically ill patient: current methods and future approaches. Intensive Care Med. 2010;36:1813–1825. doi: 10.1007/s00134-010-2005-3. [DOI] [PubMed] [Google Scholar]
- 12.Ellis CG, Wrigley SM, Groom AC. Heterogeneity of red blood cell perfusion in capillary networks supplied by a single arteriole in resting skeletal muscle. Circ Res. 1994;75:357–368. doi: 10.1161/01.res.75.2.357. [DOI] [PubMed] [Google Scholar]
- 13.Embury SH, Mohandas N, Paszty C, Cooper P, Cheung AT. In vivo blood flow abnormalities in the transgenic knockout sickle cell mouse. J Clin Invest. 1999;103:915–920. doi: 10.1172/JCI5977. [DOI] [PMC free article] [PubMed] [Google Scholar]
- 14.Faber JE. In situ analysis of alpha-adrenoceptors on arteriolar and venular smooth muscle in rat skeletal muscle microcirculation. Circ Res. 1988;62:37–50. doi: 10.1161/01.res.62.1.37. [DOI] [PubMed] [Google Scholar]
- 15.Fries M, Weil MH, Chang YT, Castillo C, Tang W. Microcirculation during cardiac arrest and resuscitation. Crit Care Med. 2006;34:S454–S457. doi: 10.1097/01.CCM.0000247717.81480.B2. [DOI] [PubMed] [Google Scholar]
- 16.Fujiwara K, Miasuda R, Takeda S. Causative factors of esmolol-induced reduction in arterial blood pressure differ in accordance with its doses. Masui. 2011;60:353–60. [PubMed] [Google Scholar]
- 17.Goldsmith HL, Cokelet GR, Gaehtgens P. Robin Fahraeus: evolution of his concepts in cardiovascular physiology. Am J Physiol. 1989;257:H1005–H1015. doi: 10.1152/ajpheart.1989.257.3.H1005. [DOI] [PubMed] [Google Scholar]
- 18.Grillo P, Bruder N, Auquier P, Pellissier D, Gouin F. Esmolol blunts the cerebral blood flow velocity increase during emergence from anesthesia in neurosurgical patients. Anesth Analg. 2003;96:1145–1149. doi: 10.1213/01.ANE.0000055647.54957.77. [DOI] [PubMed] [Google Scholar]
- 19.Harrison DG. The shear stress of keeping arteries clear. Nat Med. 2005;11:375–376. doi: 10.1038/nm0405-375. [DOI] [PubMed] [Google Scholar]
- 20.Heiss WD, Hayakawa T, Waltz AG. Patterns of Changes of Blood-Flow and Relationships to Infarction in Experimental Cerebral Ischemia. Stroke. 1976;7:454–459. [Google Scholar]
- 21.Heron M. Deaths: Leading Causes for 2007. Natl Vital Stat Rep. 2011;59:1–96. [PubMed] [Google Scholar]
- 22.Houben AJ, Beljaars JH, Hofstra L, Kroon AA, De Leeuw PW. Microvascular abnormalities in chronic heart failure: a cross-sectional analysis. Microcirculation. 2003;10:471–478. doi: 10.1038/sj.mn.7800211. [DOI] [PubMed] [Google Scholar]
- 23.Houben AJ, Burgwinkel JP, De Leeuw PW. A novel approach to the study of human microcirculation: Reactivity to locally applied angiotensin II in the conjunctival microvascular bed. J Hypertens. 2006;24:2225–2230. doi: 10.1097/01.hjh.0000249700.11736.9e. [DOI] [PubMed] [Google Scholar]
- 24.House SD, Lipowsky HH. Microvascular hematocrit and red cell flux in rat cremaster muscle. Am J Physiol. 1987;252:H211–H222. doi: 10.1152/ajpheart.1987.252.1.H211. [DOI] [PubMed] [Google Scholar]
- 25.Humphreys SA, Koss MC. Role of nitric oxide in post-ischemic cerebral hyperemia in anesthetized rats. Eur J Pharmacol. 1998;347:223–9. doi: 10.1016/s0014-2999(98)00100-9. [DOI] [PubMed] [Google Scholar]
- 26.Isenberg SJ, Green BF. Effect of phenylephrine hydrochloride on conjunctival PO2. Arch Ophthalmol. 1984;102:1185–1186. doi: 10.1001/archopht.1984.01040030963026. [DOI] [PubMed] [Google Scholar]
- 27.Kim MB, Sarelius IH. Distributions of wall shear stress in venular convergences of mouse cremaster muscle. Microcirculation. 2003;10:167–178. doi: 10.1038/sj.mn.7800182. [DOI] [PubMed] [Google Scholar]
- 28.Kochanek KD, Xu J, Murphy SL, Minino AM, Kung HC. Deaths: Preliminary Data for 2009. Natl Vital Stat Rep. 2011;59:1–51. [PubMed] [Google Scholar]
- 29.Koller A, Dornyei G, Kaley G. Flow-induced responses in skeletal muscle venules: modulation by nitric oxide and prostaglandins. Am J Physiol. 1998;275:H831–H836. doi: 10.1152/ajpheart.1998.275.3.H831. [DOI] [PubMed] [Google Scholar]
- 30.Kontos HA, Wei EP, Navari RM, Levasseur JE, Rosenblum WI, Patterson JL., Jr Responses of cerebral arteries and arterioles to acute hypotension and hypertension. Am J Physiol. 1978;234:H371–83. doi: 10.1152/ajpheart.1978.234.4.H371. [DOI] [PubMed] [Google Scholar]
- 31.Koutsiaris AG. Volume flow estimation in the precapillary mesenteric microvasculature in vivo and the principle of constant pressure gradient. Biorheology. 2005;42:479–491. [PubMed] [Google Scholar]
- 32.Koutsiaris AG, Tachmitzi SV, Batis N, Kotoula MG, Karabatsas CH, Tsironi E, Chatzoulis DZ. Volume flow and wall shear stress quantification in the human conjunctival capillaries and post-capillary venules in vivo. Biorheology. 2007;44:375–386. [PubMed] [Google Scholar]
- 33.Leonberg SC, Jr, Elliott FA. Early detection of vascular disease. Am Fam Physician. 1974;9:150–152. [PubMed] [Google Scholar]
- 34.Lipowsky HH. Microvascular rheology and hemodynamics. Microcirculation. 2005;12:5–15. doi: 10.1080/10739680590894966. [DOI] [PubMed] [Google Scholar]
- 35.Lipowsky HH, Kovalcheck S, Zweifach BW. The distribution of blood rheological parameters in the microvasculature of cat mesentery. Circ Res. 1978;43:738–749. doi: 10.1161/01.res.43.5.738. [DOI] [PubMed] [Google Scholar]
- 36.Lowe GD. Virchow’s triad revisited: abnormal flow. Pathophysiol Haemost Thromb. 2003;33:455–457. doi: 10.1159/000083845. [DOI] [PubMed] [Google Scholar]
- 37.Meighan SS. Blood vessels of the bulbar conjunctiva in man. Br J Ophthalmol. 1956;40:513–526. doi: 10.1136/bjo.40.9.513. [DOI] [PMC free article] [PubMed] [Google Scholar]
- 38.Murthy VS, Hwang TF, Zagar ME, Vollmer RR, Schmidt DH. Cardiovascular pharmacology of ASL-8052, an ultra-short acting beta blocker. Eur J Pharmacol. 1983;94:43–51. doi: 10.1016/0014-2999(83)90440-5. [DOI] [PubMed] [Google Scholar]
- 39.Ohtani N. Laser Doppler flowmetry of the bulbar conjunctiva as a monitor of the cerebral blood flow. Nihon Kyobu Geka Gakkai Zasshi. 1996;44:1721–1728. [PubMed] [Google Scholar]
- 40.Pries AR, Secomb TW, Gessner T, Sperandio MB, Gross JF, Gaehtgens P. Resistance to blood flow in microvessels in vivo. Circ Res. 1994;75:904–915. doi: 10.1161/01.res.75.5.904. [DOI] [PubMed] [Google Scholar]
- 41.Pulsinelli WA, Levy DE, Duffy TE. Regional Cerebral Blood-Flow and Glucose-Metabolism Following Transient Forebrain Ischemia. Annals of Neurology. 1982;11:499–509. doi: 10.1002/ana.410110510. [DOI] [PubMed] [Google Scholar]
- 42.Racz A, Veresh Z, Erdei N, Bagi Z, Koller A. Thromboxane A(2) contributes to the mediation of flow-induced responses of skeletal muscle venules: role of cyclooxygenases 1 and 2. J Vasc Res. 2009;46:397–405. doi: 10.1159/000194270. [DOI] [PMC free article] [PubMed] [Google Scholar]
- 43.Saltzman DJ, Toth A, Tsai AG, Intaglietta M, Johnson PC. Oxygen tension distribution in postcapillary venules in resting skeletal muscle. Am J Physiol Heart Circ Physiol. 2003;285:H1980–H1985. doi: 10.1152/ajpheart.00322.2002. [DOI] [PubMed] [Google Scholar]
- 44.Schaser KD, Settmacher U, Puhl G, Zhang L, Mittlmeier T, Stover JF, Vollmar B, Menger MD, Neuhaus P, Haas NP. Noninvasive analysis of conjunctival microcirculation during carotid artery surgery reveals microvascular evidence of collateral compensation and stenosis-dependent adaptation. J Vasc Surg. 2003;37:789–797. doi: 10.1067/mva.2003.139. [DOI] [PubMed] [Google Scholar]
- 45.Shahidi M, Wanek J, Gaynes B, Wu T. Quantitative assessment of conjunctival microvascular circulation of the human eye. Microvasc Res. 2010;79:109–113. doi: 10.1016/j.mvr.2009.12.003. [DOI] [PMC free article] [PubMed] [Google Scholar]
- 46.Startseva J, Sulimova N, Cherkassov V, Kon K, Lysov A. The diagnosis of transcapillary flow disturbances in the lungs of lung cancer. Clin Hemorheol Microcirc. 2006;35:305–306. [PubMed] [Google Scholar]
- 47.Szmuk P, Ezri T, Chelly JE, Katz J. The onset time of rocuronium is slowed by esmolol and accelerated by ephedrine. Anesth Analg. 2000;90:1217–9. doi: 10.1097/00000539-200005000-00041. [DOI] [PubMed] [Google Scholar]
- 48.Takayama J, Mishima A, Ishii K. Effects of topical phenylephrine on blood flow in the posterior segments of monkey and aged human eyes. Jpn J Ophthalmol. 2004;48:243–248. doi: 10.1007/s10384-004-0051-5. [DOI] [PubMed] [Google Scholar]
- 49.Toyoda K, Fujii K, Ibayashi S, Nagao T, Kitazono T, Fujishima M. Role of nitric oxide in regulation of brain stem circulation during hypotension. J Cereb Blood Flow Metab. 1997;17:1089–1096. doi: 10.1097/00004647-199710000-00011. [DOI] [PubMed] [Google Scholar]
- 50.Truelsen T, Piechowski-Jozwiak B, Bonita R, Mathers C, Bogousslavsky J, Boysen G. Stroke incidence and prevalence in Europe: a review of available data. Eur J Neurol. 2006;13:581–598. doi: 10.1111/j.1468-1331.2006.01138.x. [DOI] [PubMed] [Google Scholar]
- 51.Wells R, Edgerton H. Blood flow in the microcirculation of the conjunctival vessels of man. Angiology. 1967;18:690–704. [PubMed] [Google Scholar]
- 52.William HF, Angela C, James N. Esmolol. In: William HF, Angela C, James N, editors. Current Cardiovascular Drugs. Vol. 169 Philadelphia, PA: Current Medicine LLC; 2005. [Google Scholar]
- 53.Yamawaki H, Pan S, Lee RT, Berk BC. Fluid shear stress inhibits vascular inflammation by decreasing thioredoxin-interacting protein in endothelial cells. J Clin Invest. 2005;115:733–8. doi: 10.1172/JCI200523001. [DOI] [PMC free article] [PubMed] [Google Scholar]
- 54.Zweifach BW, Lipowsky HH. Quantitative studies of microcirculatory structure and function. III. Microvascular hemodynamics of cat mesentery and rabbit omentum. Circ Res. 1977;41:380–390. doi: 10.1161/01.res.41.3.380. [DOI] [PubMed] [Google Scholar]