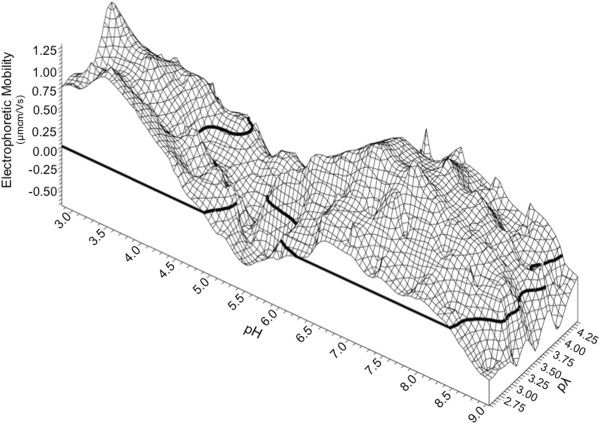
Figure 4.
BX08 gp140 trimer dynamic electrophoretic fingerprint (DEF) shown as a three dimensional wireframe model. Bolded lines show the line of zero electrophoretic mobility (LZM). There are three LZMs seen in the DEF: first at pH 4.9 and pλ 2.55 which curves left at higher pλ conditions; a second LZM is seen at a pH of 5.5 to 6.5 after which electrophoretic mobility increases to a maximum of 1.2 μmcm/Vs at pH 6.8-7.5 and pλ of 3.25; and a third LZM is seen at pH 8.5 above which mobility is negative. Data were plotted using direct linear interpolation.

