Abstract
Background
Complex anatomy and limited windows complicate echocardiographic assessments of ventricular function in Fontan patients. For the Pediatric Heart Network Fontan Cross-Sectional Study, data were acquired from which mean dP/dt during isovolumetric contraction (mean dP/dtic), Tei index and maximal systolic annular velocity (S') could be measured. The purpose of this study was to compare these non-geometric indices of ventricular function to Cardiac Magnetic Resonance (CMR) measurements of ventricular ejection fraction (EF).
Methods
Echocardiograms and CMRs were obtained prospectively using standardized protocols; measurements were completed by core laboratories. Data from both modalities were available from 137 patients.
Results
A weak, but statistically significant correlation was observed between mean dP/dtic and CMR-derived EF (R=0.20, p=0.022). This correlation was strengthened when preload was taken into account (R=0.30, p=0.001). Statistically significant correlations did not exist between CMR-derived EF and the Tei index or S'.
Conclusions
Among Fontan patients, the correlation between CMR-derived EF and non-geometric echocardiographic indices of ventricular function is not strong. Of the indices evaluated, however, mean dP/dtic appears to be the best.
Introduction
Patients with single ventricle physiology who have undergone the Fontan procedure often have complex abnormalities of ventricular anatomy and segmental wall motion. Consequently, obtaining a quantitative, objective, and reproducible echocardiographic assessment of ventricular function in these patients is challenging. Standard echocardiographic indices, such as the shortening fraction and the ejection fraction (EF), rely upon assumptions regarding ventricular geometry and symmetry that may not be valid for many Fontan patients. Furthermore, many of these patients have limited echocardiographic windows, and adequate visualization of the endocardial border at end-systole and end-diastole is often difficult or impossible. Indeed, perhaps as a result of these limitations, many past clinical studies of Fontan patients have not included echocardiographic assessments of ventricular function or have reported only subjective and semi-quantitative assessments.1–5
In contrast, cardiac magnetic resonance imaging (CMR) can provide accurate measurements of ventricular volume and EF, even in the presence of complex anatomy and segmental wall motion abnormalities. However, CMR expertise and facilities are not widely available. The procedure is relatively expensive, and may be contraindicated in patients with pacemakers and implantable cardioverters. Image artifacts from metallic implants also limit quantitative volumetric analyses in some Fontan patients. Furthermore, in young patients acquisition of CMR images often requires sedation. Hence, there still exists a need for a reliable, quantitative echocardiographic index of ventricular function that would be valid for patients with Fontan physiology.
For the National Heart, Lung and Blood Institute-sponsored Pediatric Heart Network Fontan Cross-Sectional Study, systemic blood pressures, pulsed Doppler echocardiographic tracings of systemic ventricular inflow and outflow, and tissue Doppler tracings of annular velocities were recorded according to a standardized protocol (these tracings can usually be obtained even in patients with poor echocardiographic windows).6 From these data the following geometry-independent indices of ventricular function may be calculated: mean ventricular pressure change during isovolumetric contraction (mean dP/dtic), the Tei index, and the maximum annular velocity during systole (S'). Furthermore, CMR studies were obtained in approximately one-third of study subjects. The primary purpose of this analysis was to assess the value of these easily-obtained, geometry-independent echocardiographic indices of ventricular function by comparing them to CMR-based estimates of ventricular EF, and to examine the relationship of these indices to each other. In addition, in light of Margossian et al.'s7 recent observation from the Fontan Cross-Sectional Study database that the mean difference between echocardiographic and CMR-based estimates of EF is small (although with wide limits of agreement) we also compared the geometry-independent indices of ventricular function with echocardiography-based estimates of EF.
Methods
Patient Sample
The Fontan Cross-Sectional Study was undertaken by the Pediatric Heart Network which consists of 7 pediatric cardiac centers in the United States and Canada and performs multicenter clinical studies with funding from the National Heart, Lung and Blood Institute of the National Institutes of Health. The purpose of the Fontan Cross-Sectional Study was to prospectively assess the correlation between measures of functional health status, ventricular function and exercise performance in young Fontan survivors. A total of 546 subjects aged 6 to 18 years were enrolled in the Fontan Cross-Sectional Study, at the time of their routine cardiologic follow-up, in 2003–2004. The Fontan Study design has been described.6 Two analytic cohorts from the study sample were used in this report: 1) subjects who had both CMR and echocardiographic data permitting the calculation of the echocardiographic indices of interest (patients who could not lie still without sedation and patients with metallic artifacts that precluded acquisition of a full CMR volumetric dataset were not included in this cohort); and 2) subjects with echocardiographic data irrespective of CMR completion. All institutions obtained Institutional Review Board approval to conduct the study and the parent or guardian of each provided written informed consent.
Echocardiographic Protocol
Two-dimensional and Doppler echocardiograms were obtained according to a standardized protocol Data were recorded at a paper speed of at least 100 mm/sec and all measurements were completed by a single observer at a core laboratory. The mean dP/dtic was calculated from the equation8:
The aortic diastolic pressure was obtained from an automated blood pressure monitoring system using an appropriately-sized cuff, during the echocardiogram. An average of at least 3 measurements was used for the calculation. The ventricular end-diastolic pressure was assumed to equal 5 mmHg. The isovolumetric contraction time was calculated by subtracting the time interval between the onset of the QRS complex and the closure of the systemic atrioventricular valve on the systemic ventricular inflow pulse Doppler tracing from the time interval between the onset of the QRS complex and the opening of the aortic valve on the systemic ventricular outflow pulsed Doppler tracing (Figure 1).9
Figure 1.
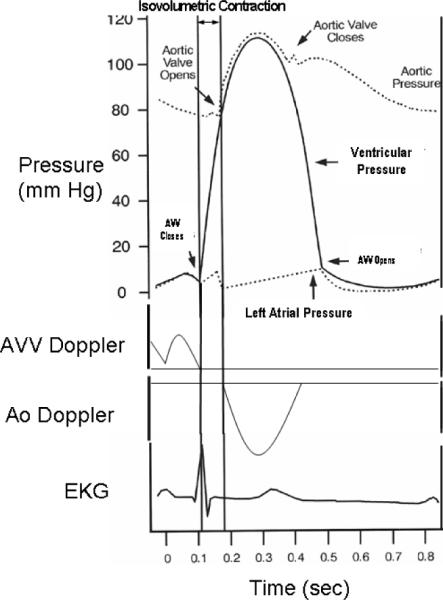
The IC time is calculated by subtracting the time interval between the onset of the QRS complex and the closure of the systemic AV valve (on AV valve inflow pulse Doppler tracing) from the time interval between the onset of the QRS complex and the opening of the aortic valve (on the aortic pulsed Doppler tracing). Aortic diastolic pressure is measured with a blood pressure cuff. Ventricular end-diastolic pressure is assumed to equal 5 mmHg. Because ventricular end-diastolic pressure is usually much less than aortic diastolic pressure, large errors in the estimation of ventricular end-diastolic pressure introduce relatively small errors into the calculation of mean dP/dtic.(Aortic diastolic pressure – ventricular end-diastolic pressure)/(IC time).
The S'was measured from tissue Doppler tracings of the systemic ventricular free wall at the level of the systemic atrioventricular valve. One measurement of an S' velocity of 24 cm/sec was considered unphysiologic and was therefore excluded from analysis. All other S' observations were < 16 cm/sec.
The Tei index was calculated from tissue Doppler imaging time intervals using the equation10:
Whenever present, the average of measurements from the septum and lateral walls was used; otherwise the single available site was utilized.
The isovolumetric contraction time was measured as the time from the end of the A' wave to the beginning of S'. The isovolumetric relaxation time was measured as the time from the end of S' to the beginning of the E' wave. The ejection time was measured as the duration of S' (Figure 2).
Figure 2.
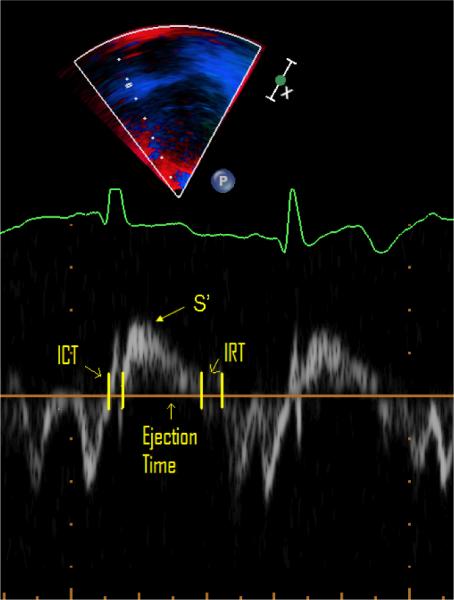
Measurement of Tei index from Tissue Doppler tracing. ET: ejection time; ICT: isovolumetric contraction time; IRT: isovolumetric relaxation time; S': peak systolic velocity
To evaluate the reproducibility of the geometry-independent indices of ventricular function, 20 studies were randomly selected and the relevant measurements were repeated twice by a second observer unaware of the results of the previous measurements.
Tracings the ventricle's endocardial border in the apical (ventricular long axis) and parasternal short axis views at end diastole and end sytole were obtained and estimates of ventricular volumes generated using a biplane-modified Simpson's rule. Ventricular morphology was characterized as left dominant (e.g., tricuspid atresia), right dominant (e.g., hypoplastic left heart syndrome) or mixed (e.g., unbalanced atrioventricular canal defect.7
For each patient, a single observer graded each AV valve's regurgitation qualitatively as: absent/trivial, mild, moderate or severe. Subjects were classified as having moderate/severe AV valve regurgitation if the right, left or common AV valve regurgitation was moderate or severe, or if both right and left AV valve regurgitation were graded mild.11
CMR Protocol
CMR was performed using a standardized imaging protocol developed by the core laboratory.7 Imaging was performed using locally available 1.5 T whole body scanners (General Electric Signa LX or TwinSpeed; Philips Intera; and Siemens Sonata or Maestro). The standardized imaging protocol included ECG-gated segmented k-space fast (turbo) gradient (14% of studies) or steady state free precession (86% of studies) cine MR acquisitions in the vertical and horizontal long-axis planes, and contiguous short-axis cine imaging from the atrioventricular junction through the cardiac apex. Studies were acquired within 3 months of the echocardiograms. De-identified CMR data were analyzed using commercially available software (MASS, Medis, Leiden, The Netherlands) at the Core CMR laboratory by a single observer.
Statistical Analysis
Summary statistics are presented as mean ± standard deviation (SD) or median and interquartile range. Patient characteristics for the group with a mean dP/dtic value and those without this measurement were compared using a Fisher exact test for categorical variables, the t-test for continuous non-skewed variables, and the Wilcoxon rank sum test for other continuous variables. Mean dP/dtic was divided by EDV/(BSA)1.3 to account for preload factors. We used generalized additive modeling to assess whether EF was linearly associated with the non-geometric parameters. Log-transformed mean dP/dtic had a linear association with EF and was therefore also used in correlation analyses. Linear regression of EF with an interaction term between valve regurgitation grade and predictor was used to identify differential correlations within patient subgroups defined by severity of valve regurgitation. An interaction term between ventricular morphology and dP/dtic was also fit to identify differential correlations within patient subgroups defined by ventricular morphology. A p-value of less than 0.05 was considered significant. All analyses were conducted using SAS 9.2 (SAS Institute, Inc., Cary, NC) and S-Plus (Insightful Corp., Seattle, WA).
Results
Study subjects
Of the 546 patients enrolled in the Fontan Cross-Sectional Study, 449 had data from which the mean dP/dtic could be calculated (Figure 3). Of these, 137 had CMR data from which the CMR-derived EF could be measured. Sample size was similar for the other non-geometric indices of ventricular function. The 137 patients who had both CMR and mean dP/dtic data were more likely to have had tricuspid atresia (30% vs. 19%), were older (mean±SD 12.1±3.4 vs. 11.8±3.4) and had Fontan surgery less recently than the other patients in the cohort.
Figure 3.

dP/dtic: mean ventricular pressure change during isovolumetric contraction; CMR: cardiac magnetic resonance imaging.
Mean dP/dtic and Subgroup Factors
In the cohort of 137 patients with CMR data, mean dP/dtic was 1224±774 mmHg/sec (median 977; range 381–5857). CMR-derived EF was 57±9%. Twenty percent had moderate atrioventricular valve regurgitation (none had severe). The distribution of ventricular morphology was 53% left (usually tricuspid atresia), 27%, right (usually hypoplastic left heart syndrome), and 20% mixed type (usually unbalanced atrioventricular canal variant). In the larger cohort of 449 patients with mean dP/dtic regardless of availability of CMR, the average value was slightly higher than that of the cohort with CMR data (1410±935 mmHg/sec p<0.05, Table 1). For these patients, the distributions of valve regurgitation and ventricular morphology were similar to those of the smaller CMR cohort.
Table 1.
Fontan Cross-Section Study Echocardiographic and CMR measures of ventricular function
| Variable | N | Mean±SD | Median | IQR | Range |
|---|---|---|---|---|---|
| Mean dP/dtic (mmHg/sec) | 449 | 1410±935 | 1125 | 802, 1700 | 239, 5857 |
| Log (Mean dP/dtic) | 449 | 7.1±0.6 | 7.0 | 6.7, 7.4 | 5.5, 8.7 |
| Mean dP/dtic / EDVZ(BSA)1.3 | 359 | 26.1±19.1 | 20.8 | 13.8, 30.8 | 2.8, 113.1 |
| Log (Mean dP/dtic / EDV/(BSA)1.3) | 359 | 3.0±0.7 | 3.0 | 2.6, 3.4 | 1.0, 4.7 |
| Echo ejection fraction (%) | 414 | 58.5±10.4 | 59.3 | 52.4, 66.0 | 25.9, 85.3 |
| S' (cm/sec) | 428 | 6.4±2.0 | 6.2 | 5.0, 7.5 | 2.4, 14.8 |
| Tei index | 462 | 0.64±0.19 | 0.61 | 0.52, 0.71 | 0.27, 1.62 |
| CMR ejection fraction (%) | 161 | 56.9±9.5 | 57.7 | 51.4, 64.2 | 14.2, 78.0 |
CMR = cardiac magnetic resonance
SD = standard deviation
IQR = interquartile range
EDV = end-diastolic volume
BSA = body surface area
Correlation between CMR-derived measurements of EF and non-geometric indices of ventricular function
Log (mean dP/dtic) was weakly correlated with CMR-derived EF (R=0.20, p=0.022; Table 2). It was not significantly correlated with CMR-based measurements of end-diastolic volume, end-systolic volume, mass or stroke volume. Because the mean dP/dtic may be influenced by preload, we attempted to correct for ventricular preload by indexing log (mean dP/dtic) using the echocardiographically-derived ventricular end diastolic volume normalized for body surface area [EDV/(BSA)]1.3.12 This correction strengthened the correlation with the CMR-derived EF (R=0.30, p=0.001; Table 2; Figure 4).
Table 2.
Pearson correlation (r) between CMR-derived EF and non-geometric indices of ventricular function
| Index | N | r | p-value |
|---|---|---|---|
| Log (mean dP/dtjC) | 137 | 0.20 | 0.022 |
| Log (mean dP/dtic / EDV/(BSA)1.3) | 110 | 0.30 | 0.001 |
| Tei index | 130 | −0.12 | 0.16 |
| S', cm/sec | 124 | 0.07 | 0.41 |
EDV = end-diastolic volume
BSA = body surface area
Figure 4.
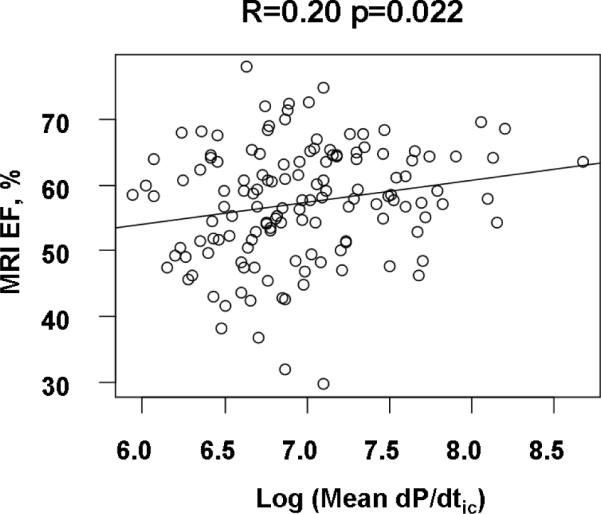
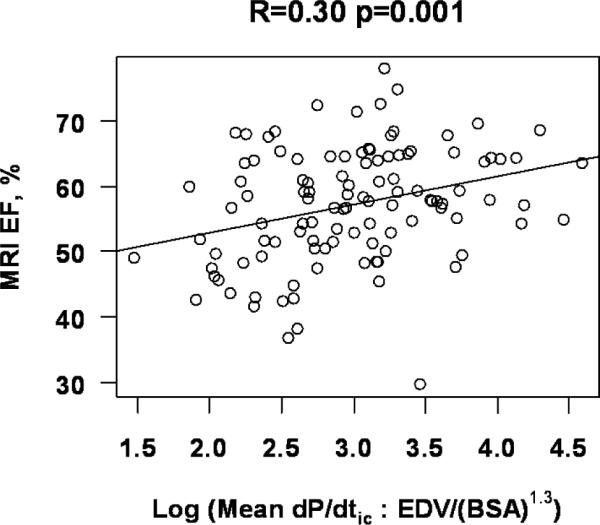
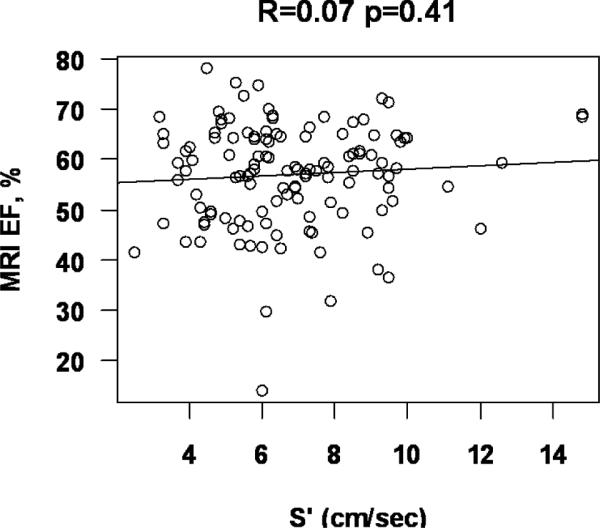
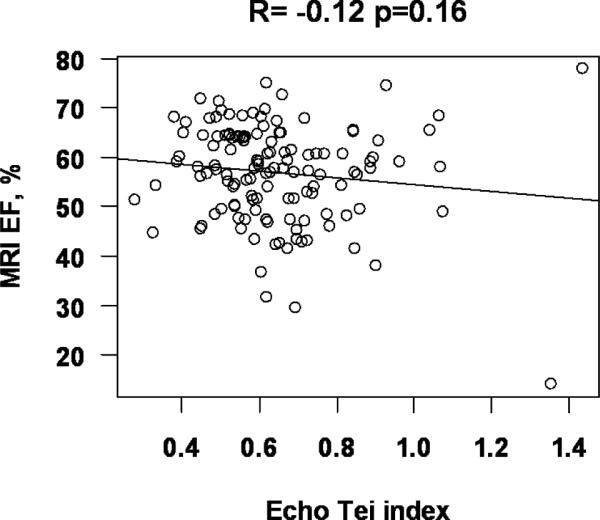
MRI EF: Ejection fraction measured by magnetic resonance imaging; dP/dtic: mean ventricular pressure change during isovolumetric contraction; Echo EDV/BSA1.3: volume correction based upon echocardiographically-determined ventricular end-diastolic volume.
The correlation between CMR-derived EF and log (mean dP/dtic) was not affected by the presence vs. absence of moderate atrioventricular valve regurgitation (p=0.33). Similarly, the correlation between CMR-derived EF and log (mean dP/dtic) was not influenced by ventricular morphology.
Statistically significant correlations did not exist between the CMR-derived EF and the other non-geometric echocardiographic indices of ventricular function (Tei index and S'; Table 2 and Figure 4). Once again, these correlations were not affected by ventricular morphology.
Comparison of patients with echocardiographic and CMR studies performed on the same day vs. patients with studies performed on different days
Of the patients who had CMR studies, 100 had echocardiograms performed on the same day as the CMR (Group 1), and 90 had the studies on different days (within 3 months of each other, without any intervening major therapeutic intervention, Group 2). Patients in Group 1 did not differ from those in Group 2 with regard to age at study (11.9±3.5 vs. 12.7±3.1 yrs, p=0.09) or age at Fontan completion (3.5±2.2 vs. 3.4±1.9 yrs, p=0.72). When the analyses were limited to patients who had studies on the same day, the correlation between log(mean dP/dt) divided by [EDV/(BSA)]1.3 with MRI EF remained significant (p=0.036 rather than p=0.001) despite the smaller sample size because the correlation coefficient changed very little in the analysis restricted to this smaller subpopulation (R=0.27 rather than R=0.30). In this subpopulation, the correlation coefficients between the CMR-based EF and Tei index and S' were also similar to those encountered in the entire study population and remained statistically insignificant.
Correlation between echocardiographically-derived measurements of EF and non-geometric indices of ventricular function
Of the 546 patients enrolled in the Fontan Cross-Sectional Study, 414 (76%) had echocardiographic images from which the EF could be calculated (59±10%). Of these, 359 had data from which the mean dP/dtic could be calculated. Log (mean dP/dtic) was correlated with the echocardiography-based estimates of EF (R=0.18, p<0.001). Once again, this correlation was strengthened modestly when log (mean dP/dtic) was corrected for preload (R=0.20, p<0.001). Statistically significant correlations (p<0.001) also existed between S', Tei index and echocardiography-based estimates of EF, but these correlations were weaker than the correlation between EF and log (mean dP/dtic) (Table 3).
Table 3.
Pearson correlation (r) between echocardiography-derived EF and non-geometric indices of ventricular function
| Index | N | r | p-value |
|---|---|---|---|
| Log (mean dP/dtic) | 359 | 0.18 | <0.001 |
| Log (mean dP/dtic / EDV/(BSA)1.3) | 359 | 0.20 | <0.001 |
| Tei index | 367 | −0.13 | 0.01 |
| S', cm/sec | 344 | 0.15 | 0.004 |
EDV = end-diastolic volume
BSA = body surface area
Correlation between mean dP/dtic and other non-geometric indices of ventricular function
Among the 320 patients who had both log (mean dP/dtic)/ [EDV/(BSA)]1.3 and the Tei index, a negative correlation was observed (R = −0.19; p <0.001). Among the 303 patients with log (mean dP/dtic)/ [EDV/(BSA)]1.3 and the S', a positive correlation was observed (R = 0.19; p<0.001; Table 4).
Table 4.
Pearson correlation (r) of log (mean dP/dtic )/[EDV/(BSA)]1.3 vs. non-geometric indices of ventricular function
| Index | N | r | p-value |
|---|---|---|---|
| Tei Index | 320 | −0.19 | <0.001 |
| S', cm/sec | 303 | 0.19 | <0.001 |
EDV = end-diastolic volume
BSA = body surface area
Reproducibility of measurements
The intra-rater agreements for mean dP/dtic and S' were excellent, and for Tei index were good, whereas inter-rater agreements were excellent for dP/dt, moderate for S', and poor for Tei index. (Table 5)
Table 5.
Intra-Class Correlation Coefficient (95% CI) for S', Mean dP/dtic, and Tei index.
| Variable | Intra-rater ICC | Inter-rater ICC |
|---|---|---|
| S' | 0.91 (0.79, 0.96) | 0.69 (0.39, 0.86) |
| Mean dP/dtic | 0.93 (0.83, 0.97) | 0.91 (0.78, 0.96) |
| Tei index | 0.75 (0.47, 0.89) | 0.24 (0.0 0.56) |
| Log (Mean dP/dtic) | 0.96 (0.90, 0.98) | 0.94 (0.86, 0.98) |
ICC = Intra-class correlation coefficient
Discussion
The indices chosen for analysis in this study were selected because they are functions solely of velocity, pressure and/or time. Consequently, they are not subject to the geometric assumptions inherent to other echocardiographic indices of ventricular function, nor are they dependent upon adequate visualization of the ventricular endocardial surface. They are therefore theoretically well suited for use in patients with complex ventricular anatomy, wall motion abnormalities and limited echocardiographic windows; conditions commonly encountered among patients who have had Fontan procedures.
We found that there was a weak correlation between the CMR-derived measurement of EF and mean dP/dtic. This correlation was strengthened when an adjustment for preload (EDV corrected for body surface area) was incorporated into the model. This observation may be related to the known preload-dependency of peak dP/dt13 and/or to the fact that EDV measurements are also used in the calculation of EF. Other non-geometric indices did not correlate with CMR-derived EF. In the larger cohort of patients with echocardiography-derived estimates of EF, mean dP/dtic once again emerged as the non-geometric index of ventricular function possessing the strongest correlation with EF.
The trends observed for the entire population persisted when our analyses were limited to patients who had CMR and echocardiographic studies performed on the same day, This observation suggests that the absence of stronger agreement between echo and CMR measures could not be attributed to changes during the time interval between the two studies.
A statistically significant positive correlation was found between mean dP/dtic and the S'. The correlation was in the direction expected as, for each of these indices, higher values are associated with superior ventricular function. A statistically significant negative correlation was found between mean dP/dtic and the Tei index. This too is expected, since a higher Tei index is associated with depressed ventricular function. It must be noted, however, that the correlation between the Tei index and mean dP/dtic is likely due, at least in part, to the fact that the isovolumetric contraction time is a component of the equations used for the calculation of both indices. In contrast, the mean dP/dtic and the S' are mathematically independent, and the correlation between these two indices cannot be ascribed solely to the presence of common component variables.
Whereas the mean dP/dtic is an “isovolumetric” index, and the Tei index is a “mixed” index (i.e., dependent upon events during isovolumetric contraction, ejection and isovolumetric relaxation), EF and S' are both ejection phase indices. It is therefore surprising that the correlation between the EF and S' was so weak. We speculate that this observation is due to the fact that S' measures the systolic motion of only a part (in this case the lateral wall) of the ventricle. In the anatomically complex patient with Fontan physiology, the motion of this region is may not be representative of other regions of the ventricle. In contrast, the mean dP/dtic describes a rate of pressure change that is a consequence of the contraction of the entire ventricle, not just a portion of it. Consequently mean dP/dtic correlates more strongly with EF, as they are both indices of global ventricular function.
Comparison with past studies
In earlier analyses of this study dataset, Paridon et al examined the relationship between exercise performance and mean dP/dtic.14 They found a statistically significant, albeit weak, correlation between mean dP/dtic and the oxygen pulse at peak exercise (a surrogate for forward stroke volume at peak exercise). None of the other echocardiographic indices of ventricular function studied (including ventricular volumes, mass, EF, tissue Doppler velocities, Tei index and diastolic function grade) correlated with the oxygen pulse at peak exercise, or other indices of exercise function. Hence, in the current study, the emergence of mean dP/dtic as the non-geometric index of ventricular function that correlates best with CMR-derived EF is consistent with the previously observed association between exercise performance and mean dP/dtic.
Tissue Doppler velocities, the Tei index and the mean dP/dtic have, in past studies, been used to assess the ventricular function of patients with single ventricle physiology. Vitarelli et al15 studied 24 patients who had undergone Fontan surgery and found a linear correlation between the S'and echocardiographic estimates of EF. Mahle et al16 found that the Tei index was elevated in a group of 32 patients with functionally single right ventricles who had undergone Fontan procedures. Williams et al.17 found that the Tei index was higher in patients with single ventricles compared to normal control subjects. Rhodes et al.8 and Michelfelder18 et al. found that echocardiographic estimates of dP/dt correlated well with simultaneous catheterization measurements. However, none of these studies compared these non-geometric echocardiographic indices of ventricular function to CMR-derived estimates of EF.
Past studies have demonstrated that the correlation between echocardiographic and CMR-derived estimates of EF is much stronger than the correlation that we found between mean dP/dtic and CMR-derived EF.7, 19 However, poor echocardiographic windows preclude determination of EF in some Fontan patients and this index of ventricular function is therefore not always available. For example, in this Fontan Cross-Sectional Study only 76% of the patients enrolled had echocardiographic estimates of EF. This statistic probably underestimates the scope of this problem, as the study was limited to patients 6–18 years of age. Older subjects often have more limited echocardiographic windows, and the barriers to the acquisition of echocardiographic estimates of EF would likely have been much greater if an older Fontan population had been studied. In contrast, mean dP/dtic can usually be acquired in patients with limited echocardiographic windows. It may therefore constitute the best alternative echocardiographic index of ventricular function in this patient population. Furthermore, even among patients with reliable estimates of EF, data from a second, independent index of ventricular function may be clinically worthwhile. For instance, among patients undergoing mitral valve surgery on account of severe mitral regurgitation, echocardiographic estimates of dP/dt were the best predictors of post-operative EF, and were superior to pre-operative estimates of EF.20 In an analogous manner, measurements of mean dP/dtic may usefully complement EF-based assessments of ventricular function in patients with Fontan. It is also possible that serial measurements of mean dP/dtic will more readily detect changes in ventricular contractility over time. These hypotheses may be worthwhile topics of future research.
Perhaps the central message of this study is, however, that the correlations between CMR-derived measurements of ventricular EF and the non-geometric echocardiographic indices that we evaluated are not strong. In the Fontan population a need still exists for a reliable and convenient non-invasive index of ventricular function. Potential candidates for this role include the myocardial acceleration during isovolumetric contraction (a recently described tissue Doppler index that reflects myocardial contractile function and is relatively insensitive to changes in preload and afterload21), as well as measurements derived from three dimensional echocardiographic and feature tracking technology.
Study Limitations
Although statistically significant, the relationship between mean dP/dtic and the CMR-derived EF observed in this study was modest. A number of factors may have contributed to this phenomenon. Accurate determination of the isovolumetric contraction time using pulse Doppler echocardiography requires clear visualization of the moment of mitral valve closure and aortic valve opening, a stable, clear electrocardiographic tracing, and a rapid sweep speed.8, 9 However, because the Doppler tracings recorded for the Fontan Cross-Sectional Study were not obtained expressly for the purpose of measuring the isovolumetric contraction time, these parameters may not have been optimized. Error may therefore have been introduced into the measurement of this variable and, consequently, into the calculation of mean dP/dtic.
We also utilized an assumed ventricular end-diastolic pressure to calculate mean dP/dtic. This too could be a source of error. It must also be noted that changes in preload, afterload, heart rate and contractility will not have identical effects upon the EF and the mean dP/dtic. It was not possible, in this study, to control for these disparate effects. Finally, we used the echocardiographically-determined ventricular end-diastolic volume to correct mean dP/dtic for ventricular preload. Although it was probably the best echocardiographic index of ventricular preload available for this purpose, the theoretical and practical limitations of this measurement should be acknowledged.7
Ventricular dP/dt may also be measured from continuous wave Doppler tracings of systemic AV valve regurgitation jets. While this approach is more familiar than the conceptually similar but methodologically different pulse Doppler technique employed in this study, the continuous wave Doppler method requires the presence of a measurable and properly oriented AV valve regurgitation jet. These conditions are not reliably encountered among patients following Fontan surgery and the requisite continuous wave Doppler tracings were not acquired for this Fontan Cross-Sectional Study. Consequently, we relied upon the less familiar, but more widely applicable, pulse Doppler methodology. Yilmaz et al have demonstrated that, in patients with mitral regurgitation, there is excellent agreement between measurements of dP/dt based upon these two techniques.22
The complexity of our patient population, variability in AV valve morphology and limitations in data availability permitted only qualitative assessments of AV valve regurgitation. It must therefore be recognized that the classification of AV valve regurgitation severity was only approximate.
In summary, among patients with Fontan circulations the correlation between CMR-derived measurements of ventricular EF and non-geometric echocardiographic indices of ventricular function is not strong. Of the indices evaluated in this study, however, the mean dP/dtic appears to be the best non-geometric index, especially when adjusted for ventricular preload. The potential clinical value of these measurements merits further study.
Acknowledgments
Supported by U01 grants from the National Heart, Lung, and Blood Institute (HL068269, HL068270, HL068279, HL068281, HL068285, HL068292, HL068290, HL068288).
Reference List
- (1).Hancock Friesen CL, Sherwood MC, Gauvreau K, Frank DF, del Nido PJ, Jonas RA, Mayer JE, Jr., Forbess JM. Intermediate outcomes of atrioventricular valvuloplasty in lateral tunnel Fontan patients. J Heart Valve Dis. 2004 Nov;13(6):962–971. [PubMed] [Google Scholar]
- (2).Larsson DA, Meurling CJ, Holmqvist F, Waktare JE, Thilen UJ. The diagnostic and prognostic value of brain natriuretic peptides in adults with a systemic morphologically right ventricle or Fontan-type circulation. Int J Cardiol. 2007 Jan 18;114(3):345–351. doi: 10.1016/j.ijcard.2006.01.023. [DOI] [PubMed] [Google Scholar]
- (3).Ohye RG, Gomez CA, Goldberg CS, Graves HL, Devaney EJ, Bove EL. Tricuspid valve repair in hypoplastic left heart syndrome. J Thorac Cardiovasc Surg. 2004 Feb;127(2):465–472. doi: 10.1016/j.jtcvs.2003.07.053. [DOI] [PubMed] [Google Scholar]
- (4).Reyes A, Bove EL, Mosca RS, Kulik TJ, Ludomirsky A. Tricuspid valve repair in children with hypoplastic left heart syndrome during staged surgical reconstruction. Circulation. 1997 Nov 4;96(9 Suppl):II–3. [PubMed] [Google Scholar]
- (5).Rydberg A, Rask P, Hornsten R, Teien D. Heart rate variability in children with Fontan circulation. Pediatr Cardiol. 2004 Jul;25(4):365–369. doi: 10.1007/s00246-003-0552-x. [DOI] [PubMed] [Google Scholar]
- (6).Sleeper LA, Anderson P, Hsu DT, Mahony L, McCrindle BW, Roth SJ, Saul JP, Williams RV, Geva T, Colan SD, Clark BJ. Design of a large cross-sectional study to facilitate future clinical trials in children with the Fontan palliation. Am Heart J. 2006 Sep;152(3):427–433. doi: 10.1016/j.ahj.2006.02.009. [DOI] [PMC free article] [PubMed] [Google Scholar]
- (7).Margossian R, Schwartz ML, Prakash A, Wruck L, Colan SD, Atz AM, Bradley TJ, Fogel MA, Hurwitz LM, Marcus E, Powell AJ, Printz BF, Puchalski MD, Rychik J, Shirali G, Williams R, Yoo SJ, Geva T. Comparison of echocardiographic and cardiac magnetic resonance imaging measurements of functional single ventricular volumes, mass, and ejection fraction (from the Pediatric Heart Network Fontan Cross-Sectional Study) Am J Cardiol. 2009 Aug 1;104(3):419–428. doi: 10.1016/j.amjcard.2009.03.058. [DOI] [PMC free article] [PubMed] [Google Scholar]
- (8).Rhodes J, Udelson JE, Marx GR, Schmidt CH, Konstam MA, Hijazi ZM, Bova SA, Fulton DR. A new noninvasive method for the estimation of peak dP/dt. Circulation. 1993;88:2693–2699. doi: 10.1161/01.cir.88.6.2693. [DOI] [PubMed] [Google Scholar]
- (9).Rhodes J, Marx GR, Tardif JC, Romero BA, Robinson A, Acar P, Pandian NG, Fulton DR. Evaluation of Ventricular dP/dt Before and After Open Heart Surgery Using Transesophageal Echocardiography. Echocardiography. 1997 Jan;14(1):15–22. doi: 10.1111/j.1540-8175.1997.tb00685.x. [DOI] [PubMed] [Google Scholar]
- (10).Tei C. New non-invasive index for combined systolic and diastolic ventricular function. J Cardiol. 1995;26:135–136. [PubMed] [Google Scholar]
- (11).Anderson PA, Sleeper LA, Mahony L, Colan SD, Atz AM, Breitbart RE, Gersony WM, Gallagher D, Geva T, Margossian R, McCrindle BW, Paridon S, Schwartz M, Stylianou M, Williams RV, Clark BJ., III Contemporary outcomes after the Fontan procedure: a Pediatric Heart Network multicenter study. J Am Coll Cardiol. 2008 Jul 8;52(2):85–98. doi: 10.1016/j.jacc.2008.01.074. [DOI] [PMC free article] [PubMed] [Google Scholar]
- (12).Sluysmans T, Colan SD. Theoretical and empirical derivation of cardiovascular allometric relationships in children. J Appl Physiol. 2005;99:445–457. doi: 10.1152/japplphysiol.01144.2004. [DOI] [PubMed] [Google Scholar]
- (13).Quinones MA, Gaasch WH, Alexander JK. Influence of acute changes in preload, afterload, contractile state and heart rate on ejection and isovolumic indices of myocardial contractility in man. Circulation. 1976 Feb;53(2):293–302. doi: 10.1161/01.cir.53.2.293. [DOI] [PubMed] [Google Scholar]
- (14).Paridon SM, Mitchell PD, Colan SD, Williams RV, Blaufox A, Li J, Margossian R, Mital S, Russell J, Rhodes J. A cross-sectional study of exercise performance during the first two decades of life following the Fontan operation. J Am Coll Cardiol. 2008;52:99–107. doi: 10.1016/j.jacc.2008.02.081. [DOI] [PubMed] [Google Scholar]
- (15).Vitarelli A, Conde Y, Cimino E, D'angeli I, D'Orazio S, Ventriglia F, Bosco G, Colloridi V. Quantitative assessment of systolic and diastolic ventricular function with tissue Doppler imaging after Fontan type of operation. Int J Cardiol. 2005 Jun 22;102(1):61–69. doi: 10.1016/j.ijcard.2004.04.008. [DOI] [PubMed] [Google Scholar]
- (16).Mahle WT, Coon PD, Wernovsky G, Rychik J. Quantitative echocardiographic assessment of the performance of the functionally single right ventricle after the Fontan operation. Cardiol Young. 2001 Jul;11(4):399–406. doi: 10.1017/s1047951101000518. [DOI] [PubMed] [Google Scholar]
- (17).Williams RV, Ritter S, Tani LY, Pagoto LT, Minich LL. Quantitative assessment of ventricular function in children with single ventricles using the Doppler myocardial performance index. Am J Cardiol. 2000 Nov 15;86(10):1106–1110. doi: 10.1016/s0002-9149(00)01168-1. [DOI] [PubMed] [Google Scholar]
- (18).Michelfelder EC, Vermilion RP, Ludomirsky A, Beekman RH, Lloyd TR. Comparison of simultaneous Doppler- and catheter-derived right ventricular dP/dt in hypoplastic left heart syndrome. Am J Cardiol. 1996 Jan 15;77(2):212–214. doi: 10.1016/s0002-9149(96)90604-9. [DOI] [PubMed] [Google Scholar]
- (19).Altmann K, Shen Z, Boxt LM, King DL, Gersony WM, Allan LD, Apfel HD. Comparison of three-dimensional echocardiographic assessment of volume, mass, and function in children with functionally single left ventricles with two-dimensional echocardiography and magnetic resonance imaging. Am J Cardiol. 1997 Oct 15;80(8):1060–1065. doi: 10.1016/s0002-9149(97)00603-6. [DOI] [PubMed] [Google Scholar]
- (20).Pai RG, Bansal RC, Shah PM. Doppler-derived rate of left ventricular pressure rise. Its correlation with the postoperative left ventricular function in mitral regurgitation. Circulation. 1990 Aug;82(2):514–520. doi: 10.1161/01.cir.82.2.514. [DOI] [PubMed] [Google Scholar]
- (21).Margulescu AD, Thomas DE, Ingram TE, Vintila VD, Egan MA, Vinereanu D, Fraser AG. Can isovolumic acceleration be used in clinical practice to estimate ventricular contractile function? Reproducibility and regional variation of a new noninvasive index. J Am Soc Echocardiogr. 2010 Apr;23(4):423–31. 431. doi: 10.1016/j.echo.2010.01.008. [DOI] [PubMed] [Google Scholar]
- (22).Yilmaz H, Minareci K, Kabukcu M, Sancaktar O. Diastolic blood pressure-estimated left ventricular dp/dt. Echocardiography. 2002 Feb;19(2):89–93. doi: 10.1046/j.1540-8175.2002.00089.x. [DOI] [PubMed] [Google Scholar]


